Strain Gradient Programming in 3D Fibrous Hydrogels to Direct Graded Cell Alignment
Abstract
Biological tissues experience various stretch gradients which act as mechanical signaling from the extracellular environment to cells. These mechanical stimuli are sensed by cells, triggering essential signaling cascades regulating cell migration, differentiation, and tissue remodeling. In most previous studies, a simple, uniform stretch to 2D elastic substrates has been applied to analyze the response of living cells. However, induction of nonuniform strains in controlled gradients, particularly in biomimetic 3D hydrogels, has proven challenging. In this study, 3D fibrin hydrogels of manipulated geometry are stretched by a silicone carrier to impose programmable strain gradients along different chosen axes. The resulting strain gradients are analyzed and compared to finite element simulations. Experimentally, the programmed strain gradients result in similar gradient patterns in fiber alignment within the gels. Additionally, temporal changes in the orientation of fibroblast cells embedded in the stretched fibrin gels correlate to the strain and fiber alignment gradients. The experimental and simulation data demonstrate the ability to custom-design mechanical gradients in 3D biological hydrogels and to control cell alignment patterns. It provides a new technology for mechanobiology and tissue engineering studies.
1 Introduction
Living tissues are continuously subjected to mechanical forces that are often expressed in a nonhomogenous manner across the tissue, exposing cells to stress and strain gradients.[1] These gradients act as signaling cues from the external environment to the tissue and extend to each individual cell.[2] This mechanosensing process is essential for normal tissue development and function while its impairment is linked to various disease and injury states.[3-5] Intratissue mechanical gradients lead to structural changes in the extracellular matrix (ECM) and variations in cellular phenotypes.[6] This is especially evident in load-bearing transitional tissues, such as ligaments and tendons, which are exposed to large stresses and strains that change radically toward bone or muscle insertion sites (entheses).[7-11] Developing techniques to control mechanical gradients in vitro are essential to enhance our understanding of cellular and ECM responses to complex mechanical stimuli and serve as a foundation for tools to facilitate tissue development and improve functionality of implantable biological constructs.[12]
Previous investigations have managed to examine living cell responses to uniform stretching of three-dimensional (3D) hydrogels, biomimetic materials that recapitulate the fibrous structure and soft mechanical environment of the ECM.[13, 14] For example, uniform stretch of 3D cellular constructs was shown to influence various cellular activities, including blood vessel orientation,[15] reorientation of cytoskeleton stress fibers,[16] cellular migration directionality,[2, 17, 18] and stem cell differentiation.[19, 20] Advanced techniques to investigate more complex non-homogenous anisotropic strain fields have been almost entirely limited to two-dimensional (2D) substrates, which have employed, for example, certain boundary conditions and complex 2D substrate geometries.[14, 18, 21-28] However, the ability to induce strains that spatially change across a 3D hydrogel in a controlled manner, has proven more challenging.[29] This is likely because of the soft (shear modulus typically < 1 KPa)[30] and fragile nature of the hydrogels. For example, biological hydrogels such as collagen and fibrin, cannot be clamped to a tensile machine in a conventional manner, and sophisticated stretching techniques have been introduced, such as casting gels in the form of large rings that can be stretched by two displacing pins.[12, 31, 32] Development of methods allowing for manipulation and analysis of cell-laden 3D hydrogels is of particular significance toward understanding tissue function, as cell behavior on 2D planar substrates differs substantially compared to the behavior of cells embedded in 3D matrices.[17] Furthermore, 3D hydrogel platforms are more relevant than 2D synthetic systems for the fabrication of clinically applicable implantable tissues.
In addition to understanding how strain gradients affect living cells, knowledge of their influence on the ECM structure is also of great importance, especially in reference to ECM fiber orientation. The fibrous protein structure of biological hydrogels, which act as scaffolds for embedded cells, typically aligns in the direction of maximum principal strain.[33, 34] The collective alignment of the gel fibers gives rise to nonlinear mechanical properties, conferring tissue resilience alongside resistance to large loads.[35] Moreover, under static uniform stretch, not only do the fibers align in the stretch direction, but embedded cells respond by orienting in the direction of the aligned ECM fibers in a process known as contact guidance.[33, 36] Since cell response to fiber alignment is so striking in fibrous hydrogels, control of fiber alignment can provide a valuable tool for programming gradients in tissue directionality.[29] This is of particular interest toward the development of engineering strategies for designing and generating orthopedic interfacial tissue structures which naturally contain ECM fiber alignment gradients, as, for example, in the entheses of a tendon-bone structure where the aligned region of the tendon transitions into the isotropic zone of the bone.[10, 37-41]
In our previous work, we presented a method for stretching fibrin hydrogels using a silicone strip carrier with a circular cut-out in which the gel polymerizes.[42] The strong adhesion between fibrin gels and the silicone strip allowed us to strain soft 3D hydrogels by stretching the silicone strip. This technique supports uniform gel response along the thickness of the gel (z-axis) since the sample is stretched evenly throughout its periphery. In the current study, we demonstrate how manipulation of the silicone cut-out geometry can be used to program defined strain gradients in 3D hydrogels through uniaxial stretch of the silicone strip. By designing various geometries, we show the flexibility of our method to program gradients along different selected axes. The manipulations led to the establishment of well-defined strain and matrix alignment gradients in the 3D fibrin hydrogels that directed cell alignment gradients. Our results indicate the potential of our system for engineering patterned cellular alignments, a critical aspect in tissue remodeling and regenerative medicine applications.
2 Results and Discussion
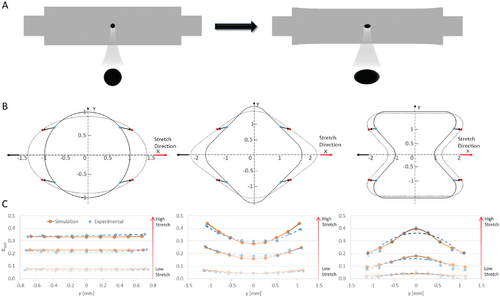
To fully harness the potential of biological hydrogels in tissue engineering applications, creative methods for controlled manipulation of the gel's fibrous structure and mechanical environment are essential. Due to their soft and fragile physical characteristics, the path to achieving this is challenging. In this study, we developed various geometrically designed 3D fibrin hydrogels using a silicone rubber carrier (Figure 1A). Fibrin adhesion to silicone rubber was exploited to transfer external stretch to the gel's fibrous structure, inducing programmable strain magnitudes that spatially change throughout the 3D hydrogel.
2.1 Engineering Strain Gradients by Geometric Design of Stretched Hydrogels
In our previous work, we demonstrated the ability to stretch soft fibrin gels (shear modulus < 1 KPa) using a silicone carrier.[42, 43] This approach has proven useful with biological gels such as fibrin and collagen due to their natural adhesion to the silicone interface. Uniaxial external stretch of the silicone strip resulted in homogenous straining of the embedded circular-shaped 3D fibrin gel from its periphery. However, more complex strain profiles typically exist in cellular microenvironments, such as the strain gradients found in interfacial tissues.[41] Various geometrical configurations and stretching methods have been introduced to guide formation of engineered tissues, but with restricted control over the developed strain field and how it spatially varies across the 3D gel.[44] Here, we engineered programmable strain gradients along predefined axes, by modifying the shape of the gel, determined by the silicone cut-out geometry (Figure 1A). As a proof of concept, we performed 2D finite element (FE) computer simulations using three distinct gel geometries stretched at increasing magnitudes by a silicone carrier (Figure 1B and Movies S1 and S2, Supporting Information). The external strain acting on the gel was defined as the change in the axial gap length of the cut-out at a given y-coordinate, normalized to the original undeformed length (along the stretch direction, hereinafter referred to as εext, Figure 1B). In Figure 1B, the distance between the blue dots defines the undeformed axial gap length and the distance between the red dots defines the deformed gap distance. A “circle” geometry was used as a “control” since it was found to generate relatively homogenous strains acting on the gel from its external edges. At the highest stretch magnitude, εext ranged from 33% at the center of the “circle” (at y = 0) to 34% at the top and bottom (y = ±0.7 mm). In contrast, gradient gels, such as the “diamond” and “hourglass” designs, contributed a more dramatic change in strain from the center toward the top and bottom regions of the gel (along the y-axis), forming gradients perpendicular to the stretch direction (Figure 1C). At the highest displacement of the silicone, εext generated in the “diamond” ranged between 28% and 44%, while the “hourglass” resulted in a range of 21–40%.
To validate our FE model, εext was measured in experiments with the same geometries and stretch magnitudes used in the simulations. For all analyzed geometries, the gradient profiles obtained in the experiments aligned with those obtained in the simulations, validating the model predications of external strain development (Figure 1C and Figure S1A, Supporting Information). Matching the external strains in the simulated geometries to the experimental setup provided us with a strong predictive tool to efficiently test any desired geometry prior to experimentation.
2.2 Computational Modeling of Internal Strains in Various Gel Geometries
To better understand how strain gradients develop internally in the gel, we analyzed the development of maximum principal strain in the simulated stretched gels (referred to as εmax, hereinafter, Figure 2). The gel was modeled as a 2D continuum material with the nonlinear elastic properties of fibrin gels measured using a Rheometer (Figure S2, Supporting Information and Experimental Section). The properties of the simulated gel concur with the experimentally measured fibrin gels under shear loading (Figure S3, Supporting Information). We used a 2D model for computational efficiency and because our previous study indicated similar responses of different cross-sections along the gel thickness (z-axis) to applied stretch.[42] We also introduced a “teeth” shape to generate more acute changes in strain (Figure 2D). A visual assessment of εmax distribution in the “diamond,” “hourglass,” and “teeth” geometries (Figure 2A–D) identified distinct changes in strain along the y-axis, the direction perpendicular to stretch, with minor changes along the stretch direction (x-axis). Quantification of εmax along the y-direction (at x = 0) uncovered distinct gradients, specific to each geometry, that were comparable to those externally induced (εext, Figure 2). The “diamond” and “hourglass” geometries supported convex and concave parabolic gradients, respectively, in accordance with the opposite slopes of the cut-out's periphery. The change in εext across the gel depended on the selected geometry, with low-to-high εmax values of 0.38 to 0.42 (circle), 0.30 to 0.52 (diamond), 0.11 to 0.36 (hourglass), and 0.06 to 0.51 (teeth).
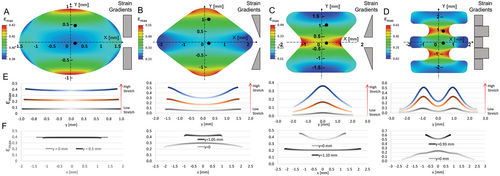
In contrast to the clear strain gradient along the y-axis, minor changes in εmax occurred along the x-axis (Figure 2F). This was particularly notable in the case of the “circle,” where no change in εmax along the x-axis was detected. The “diamond” and “hourglass” geometries also retained fairly constant strains along the x-axis, although some edge effects were observed. In contrast, the “teeth” geometry displayed much higher variations in strain along the x-axis, even after optimizing the corners to be rounder. The high x-axis strain variations are likely due to the drastic changes in width present along the vertical y-axis.
Additionally, we quantified the mean internal strain gradient along the y-axis for each geometry (Figure S4, Supporting Information). Since all geometries were designed symmetrically over the x-axis, the absolute strain values were used for each gradient measurement, without considering the direction of the slope. The flat gradient of the “circle” resulted in the lowest y-gradient values with the lowest standard deviation, in the range of 0.0007–0.0165 mm−1, further supporting its use as an ideal control shape for analyzing uniform strain under stretch. The “diamond” and “hourglass” geometries contained mild gradient values in the range of 0.01–0.15 mm−1; their relative similarities were logical, since these shapes contain similar but inverse slopes along their periphery. The “teeth” geometry, which contains the steepest changes in strain due to its programmed step-gradient, resulted in the highest internal strain gradient of 0.05–0.3 mm−1. This shape would be ideal for potentially forming 3D layered tissue structures, such as blood vessels, skin, or muscle-fat striations (e.g., cultured meat), with strips of distinct cell phenotypes differentiating in each section. Thus, we suggest a novel means of engineering a “single” scaffold system that integrates multiple cell regimes in a continuous phase, in contrast to previous strategies that combined several distinct cell layers together or fused scaffolds with different properties.[40]
2.3 Experimental Analysis of Internal Strain Gradients in 3D Fibrin Gels Under Stretch
In order to experimentally quantify the internal strain gradients induced by external stretch, an “hourglass”-shaped gel was embedded with microbeads used as fiducial markers (Figure 3). The dimensions of the experimental system and imaged region in the gel are illustrated in Figure S5 (Supporting Information). Note that, under stretch conditions, the gel is not in contact with any underlying substrate, therefore it is only affected by the silicone carrier that holds it from its circumference, not by any boundary constraints from below or above. As in the computer simulations, three stretch magnitudes were applied to the silicone carrier. Figure 3A shows the reference unstretched gel and Figure 3B shows the same gel after application of the highest stretch magnitude (εext = 40% acting on the central region, y = 0). Hereinafter, as shorthand for the magnitude of stretch in a single gel, we define ε0 as the external strain acting on the central region of the gel (εext at y = 0). The 3D volume of the gel was divided into nine equal regions spanning the y-axis. In each region, the strain tensor was measured by tracking the coordinates of each bead before and after stretch and estimating the affine transformation matrix (see Experimental Section).
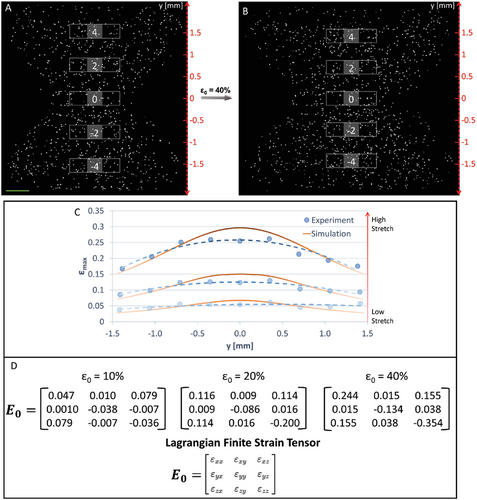
We first measured the maximum principal strains in each of the nine regions of the gel subjected to ε0 = 40% (Figure 3C). The results indicated a gradual decrease in strain from the center (y = 0) toward the extremes of the gel (y = ±1.4 mm), resembling the concave parabolic trend obtained in the simulations (represented by the orange curve in Figure 3C). Based on our previous studies, the same fibrin gels showed some degree of plasticity[45] and reduced propagation of strains from the edge of the silicone cut-out into the bulk of the gel.[42] Therefore, we incorporated plasticity into the modeled gel material (Figure 3C, and Experimental Section). Indeed, we found a better match between the experimental and simulation results when the model incorporated plasticity, particularly evident in the high strain central region of the gel (Figure S6, Supporting Information). Both the elastic- and plastic- based models show relative agreement with the experimental data at the extremes of the gel (±0.7 mm < y < ±1.4 mm), however both models deviate from the experimental data at the gel center (y = 0). Yet, the plastic-based model shows a better fit with experimental data at the gel center with a deviation range of 16–26% at y = 0 (depending on the external stretch level), while the elastic model deviates by 30–40%. At the gel center, strains are high (up to 40%), and a more complicated response of the gel may come into play than the model currently captures. More sophisticated models are needed to narrow the gap with experimental results at the gel central area, such as models that consider the discrete fibrous structure of the gel.
To obtain more detailed information about the response of the 3D gel to externally imposed strain, we calculated the Lagragian finite strain tensor (E0) in the central section of the gel (y = 0) at increasing strain magnitudes of ε0 = 10%, 20%, and 40% (Figure 3D). The magnitude of normal strains (εxx, εyy, and εzz) increased with external stretch. In the perpendicular directions to stretch, the gel exhibited large compressive strains (εyy and εzz) that were similar in magnitude to the axial strains (εxx) at 10% stretch. However, as stretch increased, εzz became more evident, indicating significant thinning of the material along its thickness. Shear strains were also present with εxz being the dominant component, possibly arising due to uneven out-of-plane deformation of the silicone cut-out edges and gradient axial strains along the y-axis.
2.4 Fiber Alignment Gradients in Response to Programmed Strain Gradients
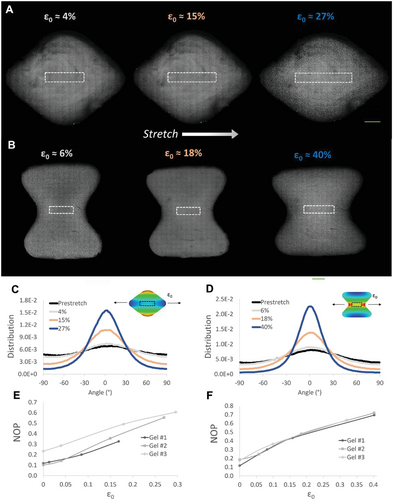
The programmable strain gradients acting in the gel can lead to alignment of gel fibers, a key structural feature of the ECM known to provide contact guidance cues that direct cell reorientation.[33, 36] The “diamond” and “hourglass” configurations were chosen for experimental analysis of fiber alignment under increasing magnitudes of external stretch (Figure 4). We used a fluorescently labeled fibrin gel in order to track the changes in fiber orientation, under a confocal microscope, in response to external stretch and formation of strain gradients. Using image analysis of the gel fibers, we generated histograms of the angle distribution of fiber orientations in the central region of the gel (white dashed rectangle, Figure 4A,B) at increasing stretch magnitudes. As stretch increased, for both geometries, more fibers reoriented around zero degrees (stretch direction), indicating fiber alignment (Figure 4C,D). Zoom-in images of the central region of the gel (highlighted rectangular regions in Figure 4A,B) demonstrate the gradual increase in fiber alignment along the stretch direction at increasing stretch magnitudes (Figure S7, Supporting Information). Moreover, we calculated the nematic order parameter (NOP), an average value of collective fiber alignment, in the marked central region as a function of ε0. The NOP increased with strain, reaching a high degree of alignment (NOP = 0.7) at 40% strain (Figure 4E,F). In the undeformed state, minor alignment was observed (NOP = 0.2), likely a result of the boundary conditions of the silicone strip leading to gel prestress. A semilinear relationship between external strain and fiber alignment was observed for the two tested gel geometries, with slopes slightly decreasing for strains above ≈20%. This is consistent with other studies that found a linear increase in fiber alignment which plateaued at higher strains.[34, 46, 47]
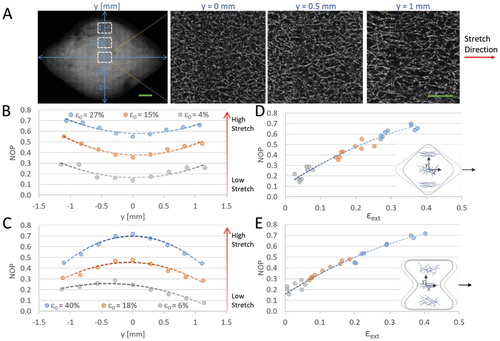
To gain further insight into the formation of gradients in fiber alignment resulting from the graded strain distribution, we compared different gel regions along the y-axis. Considering the increase in strain from the center to the extremes along the y-axis of the “diamond” geometry in both the simulations and experiments (Figure 2B), we also anticipated fiber alignment gradients along the same direction. Indeed, high magnification (40×) confocal imaging revealed that the structure of the fiber network in the “diamond” became increasingly anisotropic from section y = 0 mm toward y = 1 mm (Figure 5A). To quantify the change in fiber alignment in the different regions of the gel, NOP was measured at nine intervals along the y-axis (Figure 5B,C and Figure S1B, Supporting Information). For the “diamond” geometry, a convex-like parabolic trend was observed for NOP, resembling the strain profile (Figure 1C and 2B). To better understand the connection between external strain and fiber alignment acting in the same gel, we compared the NOP at each y-interval with the corresponding εext acting on the same y-position. This evaluation revealed a linear-like relationship between NOP and external strain up to ≈20% (Figure 5D,E and Figure S1, Supporting Information), similar to the trend in fiber alignment at the gel center exposed to increasing stretch magnitudes (Figure 4E,F). The “hourglass” gel resulted in more dramatic alignment gradients, which exhibited a concave parabolic profile (Figure 5C), possibly due to the larger area of the “hourglass” cut-out design compared to the “diamond” (See Experimental Section). At the highest stretch magnitude, NOP decreased from ≈0.72 at the gel center to ≈0.45 at the extreme regions of the “hourglass,” corresponding to a decrease in εext from 40% to 20%, respectively (Figure 5C, and Figure S1, Supporting Information). As with the “diamond,” a semilinear relationship between NOP and εext was observed for the “hourglass” (Figure 5E). The consistent relationship between fiber alignment and external strain can serve as a predictive tool for fiber alignment gradients and assist in the programming of various geometries for control of cell behavior.
2.5 Fiber Alignment Homogeneity in the x and z Directions
The 3D gel responds to external stretch in all three spatial directions. To get a clearer picture of the resulting gel gradients along other directions, we evaluated fiber alignment in the x and z directions (stretch is applied uniaxially in the x-direction). In the z-direction, the “diamond” gel demonstrated a relatively homogenous response, with a clear overlap of NOP values measured at three different z-locations, each 50 µm apart, throughout a 100 µm thick gel (Figure S8A, Supporting Information). The characteristic convex-like NOP gradient of the “diamond” gel was evident in each z-slice and was uniform throughout the 3D gel. Additionally, consistent NOP values were measured along the x-axis at two different y-positions within the “diamond” and “hourglass” gel geometries (Figure S8B,C, Supporting Information), indicating relatively homogeneous responses along the stretch direction. To eliminate edge effects, regions close to the periphery of the gel were not included in the analysis. The uniformity of response in both the z and x directions allows us to isolate the effects of strain gradients acting along a single direction (y-direction, perpendicular to stretch) on cells embedded in these 3D gel environments.
2.6 Engineering Gradients Along the Stretch Direction
The geometries presented until now resulted in y-direction gradients that occurred perpendicular to the stretch direction (x-axis). However, many tissue types in the body (i.e., orthopedic tissues) contain gradients in microenvironment structure and cell phenotype which are parallel to the direction of tension.[10, 48] In an attempt to design a geometry that supports strain gradients along the stretch axis, we simulated trapezoid gels with symmetry about the x-axis, as inspired by a previous study by Wang et al.[29] The trapezoid shape supports a gradual increase in the y-thickness along the x-axis, leading to a gradual increase in the maximum principal strain, from the narrow side toward the wide side of the trapezoid (Figure S9, Supporting Information). The trapezoid aspect ratio (ratio between wide/narrow heights) determined the slope of the generated gradient (Figure S9, Supporting Information). Interestingly, the gradient direction reported by Wang et al.[29] was opposite to our simulated model, where strain decreased from the narrow side toward the wide side of the trapezoid. Wang et al. used a system in which the gel was stretched from its ends only, while the top and bottom edges were free-hanging, whereas in our system, the gel adheres to the silicone strip along its entire periphery. To better understand the difference between these two systems, we simulated trapezoid gels with air or silicone interfaces at the top and bottom edges (Figure S10, Supporting Information). In the system by Wang et al., the gel directly sustained the stresses caused by external stretch, resulting in larger strains on the narrow edge since they were distributed over a smaller surface area (Figure S10A, Supporting Information). In sharp contrast, in our system, the silicone (and not the gel) sustained most of the stresses induced by external stretch. This resulted in higher strains acting on the wider side of the trapezoid gel, where the silicone cross-sectional area is reduced.
When testing the trapezoid geometry in experiments, we found that flat edges of the cut-out perpendicular to the stretch direction caused the silicone to “belly” in the z-plane, likely due to compressive forces from the Poison effect. To eliminate this phenomenon, the vertical edges were rounded, creating a “teardrop” shape. The gradient along the stretch direction was confirmed for the “teardrop” geometry in simulations where εmax increased from the narrow to the wider end, and the slope of the gradient was dependent on the external stretch level of the silicone (Figure 6A,B). In experiments with fibrin hydrogels, a gradual change in fiber alignment was detected by confocal imaging along the x-axis (Figure 6C). NOP quantification for various regions in the gel at three stretch magnitudes indicated changes in fiber alignment along the x-axis (Figure 6D), with trends following the changes in the simulated εmax (Figure 6B). This confirms our ability to custom-design strain and ECM alignment gradients along the tension direction, reminiscent of gradients present in the body.

2.7 Response of Cell-Laden Fibrin Hydrogels to the Programmed Gradients
To examine the effect of strain gradients on cell morphology and orientation, “hourglass”-shaped hydrogels were embedded with GFP-3T3 fibroblast cells, and statically stretched in a bioreactor, reaching ε0 = 40% external strain at the center and εext = 20% at the top and bottom regions of the gel. Z-stack tile confocal images of the entire “hourglass” construct were acquired at three time points (t = 0, 20, and 40 h) with t = 0 defined as the time of stretch initiation. High-zoom images of regions along the y-position indicated large variation in cell directionality between the central gel region (y = 0, Figure 7D) and extreme y-positions in the gel (y = ±1.6 mm, Figure 7C). For each time point, we quantified the orientation of cells located at three different regions along the y-direction (Figure 7E). Within 2 h from stretch initiation, cells were mainly rounded, and cell orientation was fairly isotropic at all tested y-regions (Figure 7A, and E, t = 2 h). After 20 h, cells oriented along the stretch direction in the central gel region (y = 0) which then gradually declined along the y-axis (Figure 7E, t = 20 h). After 40 h, cell directionality did not continue to rise, instead, the distribution of cell orientation flattened (broader peaks) across more regions (Figure 7E, 40 h), potentially indicating that once stretch sensation is saturated, cells begin growing extensions in other directions.
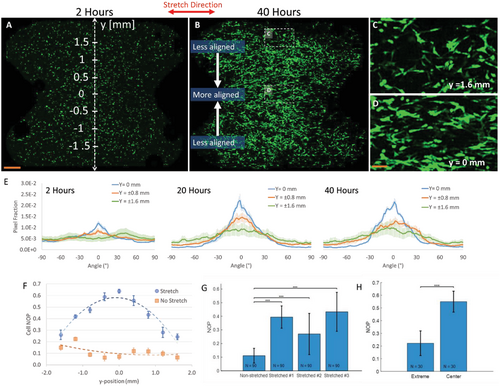
For greater resolution of the spatiotemporal changes in cellular orientation, we quantified cell alignment by NOP measurement over the y-axis at t = 20 h (Figure 7F and Figure S11, Supporting Information). A clear parabolic-like gradient was found, with increased cell alignment (NOP = 0.64) observed in the high-strain central region of the gel (Figure 7D, ε0 ≈ 40%) and lower levels of cell alignment (NOP = 0.28) observed at the extremes (Figure 7C, εext ≈ 20%, y = 1.6 mm). The formation of a similar parabolic-like gradient was consistent across different gels, although with slightly different absolute magnitudes (Figure S11, Supporting Information). No directional preference was found for control gels at all-time points (Figure 7F, t = 20 h). The differences in NOP between stretched and nonstretched gels (Figure 7G), as well is the differences between regions with different strains in the same gels (Figure 7H), were statistically significant.
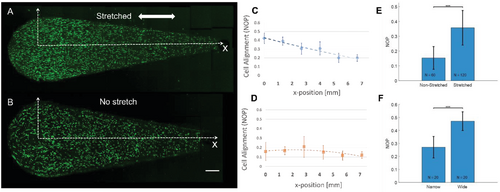
We confirmed the graded cell response with the “teardrop”-shaped hydrogel (Figure 8). Recalling from earlier, this shape leads to gradients in strains and fiber alignment along the stretch direction, as shown in Figure 6. Indeed, when actin-GFP 3T3 fibroblasts were seeded in the “teardrop” hydrogels and exposed to static stretch for 20 h, the cells oriented along the stretch axis, with more intense alignment at the wider side of the hydrogel (NOP = 0.4) which linearly decayed toward the narrow side of the hydrogel (NOP = 0.2) (Figure 8A and Figure S12, Supporting Information). Isotropic cell alignment was detected in the no-stretch control “teardrop” hydrogel (Figure 8B). The differences between stretched and non-stretched gels (NOP averaged over all positions, Figure 8E), as well as the differences between the wide and narrow sides in the same gels (Figure 8F), were statistically significant.
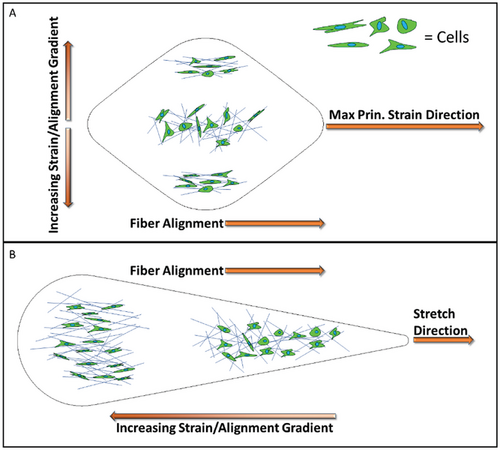
Taken together, the programmable strain distribution defined by gel geometry and external stretch, can provide a means for control of cell alignment patterns across the 3D hydrogel. Increased cell directionality at regions of higher strain is likely driven by contact guidance of the aligned fibers in these regions.[33, 36, 49] Moreover, changes in local stiffness likely also exist in the graded gel system, playing a role in modulating cell alignment patterns. Since the fibers are externally tensed, the nonlinear strain stiffening behavior (stiffness rises as strain increases) can introduce various levels of stiffness across the gel depending on the strain magnitude acting in each gel region. Also, rearrangement of the fiber network and collective fiber alignment can give rise to increased stiffness.[50] It was previously shown that fibroblasts can sense aligned fibers via mechanical resistance of the fiber network.[51, 52] Therefore, both the aligned fibers (topographic cues) together with changes in local stiffness (mechanical resistance) are possible factors that regulate the observed graded cell patterns.
Limitations of the presented programmed gel system for induction of graded cell patterning may include the following. First, under large external stretch, significant fiber alignment can be observed across all gel regions (e.g., NOP > 0.55 under 40% stretch in Figure 5B), which may reduce the gradual effect on cell directionality. Moreover, the experimental period of the graded cell patterns is limited by two main factors: (i) as time progresses, cells oriented in the direction of stretch spread along other directions than the induced one (Figure 7E, at 40 h), and (ii) the contractile forces generated by cells can lead to rearrangement of the gel fibers in an uncontrolled manner, thus modifying the originally imposed gradient.
3 Conclusions
This work described a method to program strain gradients on 3D cellular hydrogels, directed by gel geometric design and external stretch. We demonstrated the ability to predefine the gradient axis to run perpendicular or parallel to the stretch direction. Along the gradient axis, changes in maximum principal strain, ECM alignment, and cellular orientation occur (see a summary sketch in Figure 9). The engineering of a “single” hydrogel system that integrates graded ECM regimes and cell patterning in continuous phases is attractive for constructing tissues that natively exhibit complex graded multilayered architecture. We expect our work to motivate future work investigating additional bioinspired geometries, hydrogel types, and stretch regimens (i.e., cyclic, sinusoidal, biaxial), while also examining protein expression (e.g., α-smooth muscle actin) and phenotype profiles of embedded cells (e.g., differentiation of stem cells in different strain regions of the gel).
4 Experimental Section
FE Stretch Simulations
A 2D silicone-fibrin integrated system model was developed with FE software Abaqus v. 2017 (Dassault Systemes, Waltham, MA) (Figure 1A). In the Abaqus “part module,” we partitioned a silicone rectangular strip into two parts, the outer part consisting of a silicone rubber and a cut-out part embedded with a fibrin gel, and assigned each part with corresponding material properties. Both materials were represented by a continuous material model. The mechanical properties of the silicone strip used in the model were based on our experimental results of uniaxial tension demonstrating linear-elastic behavior up to 50% strain with a Young's modulus of 1.5 MPa and Poisson ratio of 0.48, as we previously described.[42] The mechanical properties of fibrin gels were modeled based on the properties of fibrin measured with a Rheometer (Figure S2, Supporting Information, and a Experimental Section below). We translated the G’ versus shear strain graph obtained from the Rheometer into a shear–stress versus shear–strain curve such that local derivatives of the stress–strain curve matched the G’ value at each strain (Figure S3, Supporting Information). In Abaqus, the Hyperelastic Ogden model was fitted based on the test data of the shear stress–shear strain values obtained in the Rheometer (Figure S3, Supporting Information). To validate the modeled gel material against the experimental Rheometer results, in Abaqus we simulated a shear loading setting in which torque was applied to a circular disk using dimensions identical to the Rheometer shear experiment. The Ogden strain energy potential order was iterated to N = 3 until reaching a satisfactory agreement between the simulations and the Rheometer results (Figure S3, Supporting Information).
To incorporate plasticity in the FE simulations, isotropic plasticity was assumed, with a material having a yield stress of 300 [Pa] and a plastic true strain of 35% when 550 [Pa] stress is reached. These values were chosen to phenomenologically include the features of the experimentally observed strain field and based on plausible ballpark values for the ECM.[53]
The geometries developed and optimized into modeled cut-outs included: “circle,” “diamond,” “hourglass,” “teeth,” and “teardrop”. Uniaxial stretch of the silicone was simulated such that one end of the silicone was fixed, and the opposite end was displaced to 3.5–10 mm, depending on the specific geometry. The location of the boundary conditions of stretch matched the placement of brackets on the silicone when it is loaded into our stretching device. The FE model was partitioned, and meshing was determined by adaptive meshing and validated against various global element sizes. Adaptive meshing rules were set using 0.5%–2% von misses stress error indicator with element sizes of 0.001–0.5 mm, depending on the region in the silicone-fibrin system.
Strain Measurements
- External strain (εext) measurement in experiments is defined as:
(1)
- External strain (εext) measurement in simulations is defined in the same manner as Equation (1). For the simulations, l0 is the axial distance between specific nodes at a given y-position of the undeformed simulated gel material and l is the axial distance between the same nodes of the undeformed simulated gel material after displacement of the modeled silicone strip.
- Local strain gradients were calculated using a finite differences method for each geometry at each stretch magnitude. The gradients were averaged (Equation 2) and equated to each other (Figure S2, Supporting Information).
(2)
Gel Polymerization in the Silicone Strip
Silicone strips were made of 580 µm-thick silicone sheets (McMaster-Carr High Temperature Silicone Rubber), cut to 17 × 80 mm2 strips. Geometric cut-outs were made in the strips using a laser cutting machine (Universal). The cut-out shapes were: “circle,” “diamond,” “hourglass,” and “teardrop” with surface areas of 3.14, 6.31, 12.10, and 11.95 mm2, respectively.
Before loading the gels into the silicone carriers, fibrinogen was labeled with Alexa Fluor 546, succinimidyl ester (Invitrogen) by mixing the fibrinogen and Alexa Fluor at a molar ratio of 7.5:1, for 1 h, at room temperature and then filtering it through a HiTrap desalting column (GE Healthcare) packed with Sephadex G-25 resin to separate the unreacted dye.[54]
As described in our previous work,[43] hydrogels were prepared by placing the silicone carrier on a strip of Parafilm in a 10 cm petri dish. Depending on the volume of the cut-out, 2.5–7.0 µL cold fibrinogen solution (10 mg mL−1, Omrix Biopharmaceuticals) was then placed in the cut-out, an equal amount of cold thrombin solution (2 U mL−1, Omrix Biopharmaceuticals) was added, and the mixture was then pipetted to promote homogenous cross-linking of the hydrogel. Samples were then transferred to a 37 °C incubator for 30–45 min, depending on the gel volume, to fully polymerize. After polymerization, the entire construct was submerged in PBS, and the Parafilm layer was gently peeled off from the bottom. To confirm gel homogeneity and adherence to the cut-out periphery throughout the thickness of the silicone, strips were attached to the stretching device, loaded onto a confocal microscope and imaged.[42, 43]
Fiber Orientation Analysis
A value of NOP = 1 indicates perfect alignment along the axial direction (angle zero), NOP = 0 indicates isotropy and NOP = −1 indicates perfect alignment perpendicular to the axial direction.
Regional Strain Analysis
Using the 3D bead locations, the Lagragian finite strain tensor was calculated for each region, at each stretched level of ε0 = 10%, 20%, and 40% (Figure 3D). These tensors offer detailed information about the behavior of the 3D stretched gel.
Static Stretching of Cell-Laden Gels
Actin-GFP 3T3 fibroblast cells (≈800 cells µL−1) were added to a 2 mg mL−1 thrombin solution. Fibrinogen was pipetted into a silicone “hourglass” cut-out, and then mixed with the cell-thrombin solution for polymerization, in a process similar to that described in section “Gel Polymerization in the Silicone Strip”. The silicone-gel construct was placed in a TC-3 bioreactor (EBERS Medical Technology SL) and stretched to static strains of ε0 = 20% and ε0 = 40% (strain acting on the central region of the gel, at y = 0) and then imaged by confocal microscopy at increasing time points from stretch initiation. Control samples grown in the bioreactor (and connected to the tensile grips) ran in parallel with the stretched gels but without application of static stretch. Z-stack confocal images were subsequently captured at t = 0 − 2, 20, and 40 h post-stretch. Resulting image stacks were then uploaded to the Imaris software to obtain 3D images.
Cell Orientation Analysis
We created a MATLAB image processing algorithm for cell detection based on “Detect Cell using Edge Detection and Morphology”.[59] This process eliminated background noise and isolated the cells from their surroundings using edge detection, dilation, filling, and smoothing functions. Processed image stacks were imported to ImageJ, divided into nine regions, and cell orientation distribution was then determined for each region using the OrientationJ plug-in as previously described (using a 9-pixel window in this case). Data from each section image in the Z-stack were averaged and standard deviation between the Z-slices was calculated. NOP values were also calculated for all the regions in each gel, enabling evaluation of cell orientation gradients along the y-axis.
Rheometer Measurement of Fibrin
The constitutive mechanical properties of fibrin gels (5 mg mL−1 fibrinogen and 1 U mL−1 Thrombin, both from Omrix Biopharmaceuticals) were measured using a HR-3 Discovery Hybrid Rheometer (TA Instruments) equipped with 20 mm diameter aluminum parallel plates with a gap of 1 mm. The temperature was set to 37 °C. Amplitude sweep tests were performed with a frequency of 0.1 Hz and strain range of 0.1–100%. The fibrin gel was prepared on the rheometer directly. After 45 min of polymerization, warm PBS was added around the gel. Three different samples were included in the analysis.
Statistics
To determine whether two measured distributions are distinguishable, we used the Kolmogorov–Smirnov test. This test makes no previous assumptions about the underlying distributions. In all figures, ***p-value (PKS) less than 10−3.
Conflict of Interest
The authors declare no conflict of interest.
Open Research
Data Availability Statement
The data that support the findings of this study are available from the corresponding author upon reasonable request.


