Combining Top-Down and Bottom-Up: An Open Microfluidic Microtumor Model for Investigating Tumor Cell-ECM Interaction and Anti-Metastasis
Abstract
Using a combined top-down (i.e., operator-directed) and bottom-up (i.e., cell-directed) strategy, an Under-oil Open Microfluidic System (UOMS)-based microtumor model is presented for investigating tumor cell migration and anti-metastasis drug test. Compared to the mainstream closed microfluidics-based microtumor models, the UOMS microtumor model features: i) micrometer-scale lateral resolution of surface patterning with open microfluidic design for flexible spatiotemporal sample manipulation (i.e., top-down); ii) self-organized extracellular matrix (ECM) structures and tumor cell-ECM spontaneous remodeling (i.e., bottom-up); and iii) free physical access to the samples on a device with minimized system disturbance. The UOMS microtumor model – allowing a controlled but also self-organized, cell-directed tumor-ECM microenvironment in an open microfluidic configuration – is used to test an anti-metastasis drug (incyclinide, aka CMT-3) with a triple-negative breast cancer cell line (MDA-MB-231). The in vitro results show a suppression of tumor cell migration and ECM remodeling echoing the in vivo mice metastasis results.
1 Introduction
For over a decade, bioengineers have been dedicated to constructing microtumor models in vitro that recapitulate the in vivo tumor microenvironment (TME).[1] In vitro microtumor models provide a venue for using human cell lines or primary patient samples (distinct from animal models with a non-human environment)[2] to perform pathogenesis studies, diagnosis/prognosis, and drug/treatment screening.[3] In light of the value in both fundamental research and translational application, recently in vitro microtumor models got further developed to better mimic the in vivo physiopathological environments, witnessing the transition from the traditional 2D cell culture [i.e., cells directly cultured on an artificial substrate such as polystyrene (PS) or glass][4] to 3D microtissues (e.g., spheroids,[5] organoids[6]) supported by ECM[7] and microphysiological systems[8] with advanced structures [e.g., lumen,[9, 10] microvascular networks (MVNs)[11]] and mass transport (e.g., vital gasses,[12] soluble factors[13]) controls.
So far various strategies have been developed to establish a TME in vitro, falling into two categories regarding the design principles – top down and bottom up. For top down, the microenvironment is defined and controlled by the operators, that is, operator-directed.[9, 10, 14] By contrast and in a bottom up approach, the microenvironment is self-organized and regulated by cells as seen in vivo, that is, cell-directed.[15] The top down approaches[16] allow geometrically precise dimensions and structures, inherently pursuing an operator-directed, stable microenvironment (e.g., spatiotemporal sample organization, nutrient level, vital gas availability and kinetics, fluid dynamics) with the environment parameters largely monitored and controlled at the global level (e.g., temperature, oxygen, carbon dioxide in standard cell culture incubators, flow rate control by syringe pumps). However, the real TMEs in the body are a highly dynamic and heterogeneous environment featuring aberrant structures (e.g., leaky microvasculatures, ECM remodeling) and mass transport dynamics (e.g., nutrients, oxygen, metabolic wastes) defined by the cells locally in the micro niche. The bottom up approaches[17] give the driver's seat back to the cells in a micro niche and therefore better mimic the in vivo processes.
A trend of using top down and bottom up combinedly to establish a TME in vitro has seen a fast growth in the past five years. In the combined top down and bottom up approaches, the operators define the system environment and structures at macrotissue scales (typically >100 µm) and in the meanwhile, cells are allowed to autonomously generate and regulate their own micro niche and fine structures (e.g., stem cell crypts,[18] MVNs[19]) at microtissue and single-cell scales (typically <100 µm). In this regime, the advantages from the top down (i.e., macrotissue-level precision and controllability) and bottom up (i.e., single-cell-level structures and autonomously regulated microenvironment dynamics) get integrated and synergized in one system.
In the combined top down and bottom up approaches, microfluidic systems especially closed-chamber/channel microfluidic systems (i.e., fluid/cells confined in a closed space by solid barriers) dominate due to the well-established fabrication methods and fluid controls.[20] While successful in many aspects, the closed-chamber/channel microfluidic systems are inherently limited by their closed system configuration that is misaligned with the open system standard (e.g., pipette, glass slide, chambered coverglass, Petri dish, microtiter plate) systematically adopted in biology and biomedicine. Specifically, there is no easy and non-destructive physical access to the samples on a closed device. The closed system configuration makes real-time spatiotemporal sample organization on a device (e.g., for sample/drug loading, manipulation, and collection) challenging and disruptive to the established TME.
Here, we leverage a newly introduced sub-branch in open microfluidics known as Exclusive Liquid Repellency (ELR)-empowered Under-oil Open Microfluidic System (UOMS)[12, 21-28] to establish an open microfluidic microtumor model with combined top down and bottom up. The ELR physics allows inherent (i.e., surface-texture and surfactant independent) and absolute liquid repellency (with Young's contact angle θ = 180°),[21, 23] which lays the foundation for the top down fabrication of open microfluidic channels in UOMS with micrometer-scale spatial resolution and lossless sample processing. Furthermore, ECM materials (e.g., collagen Type I) can be introduced into the microchannels via a unique microfluidic sample distribution method named “under-oil sweep distribution”[24, 25] and self-organize into a structured bottom up with different levels of microfiber alignment from random to aligned via a Laplace-pressure-driven local lateral flow.[25] Tumor cells seeded through the oil overlay onto the under-oil microchannels interact with the ECM layer, further remodeling the ECM structure bottom up which in turn influences cell morphology and migration. Thanks to the oil-media barrier, the UOMS microtumor model allows real-time, free physical access to the system with minimized system disturbance (e.g., media loss via evaporation, airborne contamination, irreversible and destructive intervention). In this work, we present the governing physics, design principle, and self-organization mechanism of the under-oil TME. As a proof of principle, we test the UOMS microtumor model with a repurposed anti-metastasis drug [incyclinide, a matrix metalloproteinase (MMP) inhibitor that went through several clinical trials for brain tumors, soft tissue tumors, and metastatic cancer treatment], showing its successful capture of the drug efficacy consistent with the in vivo (mice model) results.
2 Results and Discussion
Microfluidic cell culture has many advantages over the conventional bulk-scale cell culture (e.g., Petri dish, microtiter plate) including microstructure development and mass transport control for better mimicking the dynamic and heterogeneous cellular microenvironments as seen in vivo.[20] In microfluidics, closed-chamber/channel microfluidic systems dominate due to historical reasons and intuitive fluid controls (i.e., fluid in a closed space defined by solid barriers). However, in biology and biomedicine, open systems (such as pipettes, glass slides, chambered coverglass, Petri dishes, and microtiter plates) are systematically adopted. To better align with the open system standard, open microfluidics [i.e., fluid in an open space with at least one solid barrier removed, exposing the fluid to the ambient air (single-liquid-phase microfluidics) or a secondary fluid (multi-liquid-phase microfluidics) for free physical access to the system] were introduced.[29] While promising in biological and biomedical applications, broad adoption of open microfluidic systems had been stymied (before 2015) due to the limited spatial resolution (largely limited to millimeter scale), system stability (e.g., media loss via evaporation, airborne contamination), fluid controls (e.g., low and limited flow rate range, lack of on-demand flow switch) compared to closed-chamber/channel microfluidics.
2.1 Top Down – Double-ELR Open Microfluidic Surface Patterning
Recently, we introduced ELR (i.e., Exclusive Liquid Repellency)[21] – an extreme wettability where a liquid is inherently and absolutely repelled on a surface (Figure 1) – to open microfluidics, initiating a new sub-branch known as ELR-empowered UOMS. Enabled by ELR[21] and Double-ELR (i.e., under-oil water ELR + under-water oil ELR on a chemically patterned surface),[24] the ELR-empowered UOMS[25] achieved a series of advanced functions in open microfluidics including i) free physical access to the system with minimized system disturbance, ii) inherent antifouling and lossless sample processing, iii) micrometer-scale spatial resolution of open microchannels, iv) open-fluid single-cell trapping, v) improved flow rate range (e.g., comparable to blood flow in the circulatory systems), and vi) on-demand reversible open-fluid valves. These advances not only make ELR-empowered UOMS comparable to closed-chamber/channel microfluidics in functionality but also enable new applications in biology and biomedicine.[26, 27]
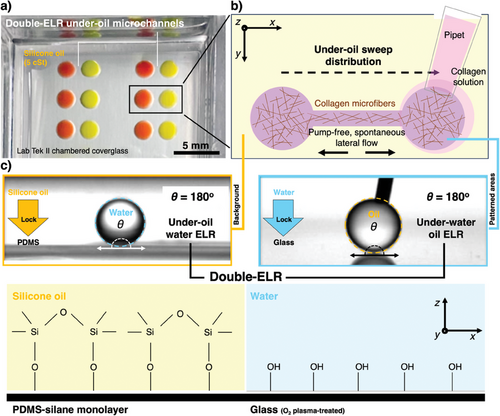
Enabled by Double-ELR, a selected pattern (e.g., two circular spots connected by a straight channel adopted in this study) can be readily prepared on a surface (e.g., glass, PS) by under-oil sweep distribution (Figure 1a,b, Experimental Section). A hanging drop of the target media (e.g., collagen solution) at the end of a pipet tip is dragged across the Double-ELR chemically patterned surface (Figure 1c). The aqueous media gets spontaneously and robustly dispensed onto the patterned area, leaving the background (i.e., the unpatterned area) absolutely protected from being fouled. The sweep operation is performed under oil, minimizing volume loss via evaporation and airborne contamination. The spatial resolution of the surface patterns is defined by the polydimethylsiloxane (PDMS) stamps (or masks) prepared with standard photolithography (Experimental Section).
2.2 Bottom Up – Self-Organization of ECM Microstructure Driven by Spontaneous Lateral Flow
Here, we first analyze the fluid dynamics (Section I, Supporting Information) of a set of microchannels with the same channel length (L = 0.5 mm) and varying channel width (W = 0.1, 0.2, 0.3, and 0.5 mm) (Figure 2c–h). To simulate the triple-negative breast cancer ECM microenvironment, we selected collagen Type I (the most abundant ECM component of breast stroma) and the typical concentration 2–3 µg mL−1 used as a standard in research. The analytical results showed that ΔPmicrochannel-spot and Rh (Figure 2c) increase with Rh much faster than ΔPmicrochannel-spot as channel width decreases, resulting in a decrease of Q (Figure 2d) quickly. From after under-oil sweep distribution to equilibrium, Vpumping (Figure 2d) gets spontaneously pumped into the two spots. The direct driving force of collagen microfiber alignment in the microchannel is the shear force generated by the spontaneous lateral flow. The intensity of shear force can be quantitatively reflected by v (Figure 2e). The duration of shear force is described by t (Figure 2e). By leveraging the spontaneous lateral flow, different levels of collagen microfiber alignment from random to aligned can be achieved by simply adjusting the channel dimensions (e.g., channel width in this section) (Figure 2f–h). For a given channel length (e.g., L = 0.5 mm), the microfiber alignment increases first and then decreases as the channel width decreases. This trend can be understood by considering v and t jointly (Figure 2e). A larger channel width leads to a higher v (and thus shear force), however, a shorter t for the microfibers to align with the flow. As shown in both the analytical and experiential results, the highest alignment is achieved with the microchannels of 2-2-L0.5-W0.3 (in mm) (Figure 2h). From W = 0.3 mm, both the increase and decrease of channel width lead to decreased microfiber alignment due to either not enough time or not enough linear velocity of the lateral flow.
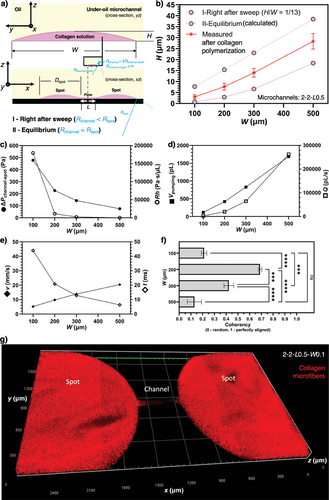
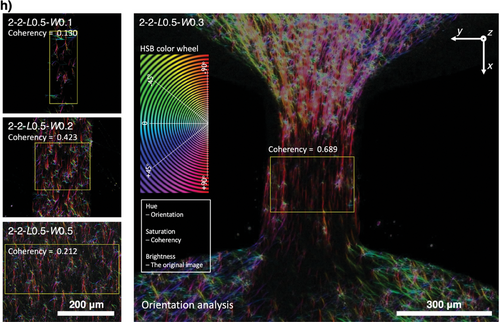
Next, we further investigate the influence of channel length on the ECM microfiber alignment in the under-oil microchannels (Figure S2, Supporting Information). As predicted by the under-oil fluid dynamics analysis (Figure 2c–e) and for a given channel width (and thus the same ΔPmicrochannel-spot), an increase of channel length will lead to a decrease of v but an increase of t. Therefore, the increase of channel length should result in an increase of microfiber alignment but eventually decrease if the channel length gets too large. This hypothesis is proved by the experimental results (Figure S2b,c, Supporting Information). It is worth noting that the lateral flow generation and dynamics in UOMS are fundamentally different from the traditional closed microchannels with active pumping.[30] Right after the sweep, the lateral flow is driven by the “local” Laplace pressure differential rather than the global pressure drop by active pumping. A part of the volume gets pumped into the two spots, generating spontaneous later flows in two opposite directions in the channel (Figure 1b,a). Due to the orders-of-magnitude difference in the fluid volume between the spots and the microchannels (Table S1, Supporting Information), the lateral flow gets significantly damped after reaching the spots, leading to much weaker to no microfiber alignment effect compared to the microchannels (Figure S2d, Supporting Information). The seemingly non homogeneous distribution of collagen between the spots and the channel revealed in the 3D microscopic image (Zeiss Apotome 3 quasi-confocal image) in Figure 2g is simply caused by the stark difference of collagen volume. As shown in Figure 2a,b, the height-to-width ratio of the liquid layer from double-ELR patterning is ≈1/13. The collagen layer thickness on the spots (2 mm/13–55 µm) is significantly larger than in the channel (<40 µm). The zoomed-in images in Figure 2h showed the real morphology and microfiber structure in the channels. Together, this unique under-oil fluid microenvironment allows us to get different ECM microfiber alignments by simply selecting the channel length, channel width, and spot diameter. Via an under-oil sweep (for a 2.5D ECM microenvironment with the cells seeded on top of the ECM microfibers) or multiple layer-by-layer sweeps (for a 3D ECM microenvironment with the cells embedded in the ECM microfibers) (Figure S3, Supporting Information), the spontaneous lateral flow drives the ECM microfibers into a specific level of alignment during the polymerization process. This feature provides an efficient and high-throughput approach to reconstructing an ECM microenvironment that recapitulates the typical structures seen in either healthy tissues or a cancer lesion.
2.3 Bottom Up – Tumor Cell/Fibroblast-Driven Spontaneous ECM Remodeling
It is known that the cells in the TME including tumor cells and fibroblasts can strongly remodel the collagen microfiber alignment, facilitating tumor cell migration and metastasis.[31] In cancers, ECM remodeling and alignment often promote tumor growth, invasion, and metastasis by providing structural support and guiding cellular movement.[7] Additionally, aligned ECM can facilitate resistance to chemotherapy and immunotherapy by creating physical barriers that hinder drug penetration and immune cell infiltration.[32] Understanding the relationship between ECM remodeling/alignment and tumor cell behavior has led to the development of novel treatment strategies targeting tumor-ECM interaction to enhance drug delivery and improve therapeutic outcomes, highlighting the significance of ECM in cancer progress and treatment.[33]
In this section, we investigate the ECM remodeling capability and capacity by tumor cells [MDA-MB-231 – a migratory breast cancer cell line, green fluorescence protein (GFP)-labeled] with and without fibroblasts [healthy human oral fibroblasts (HorF) versus cancer-associated fibroblasts (CAF), 1:1 ratio with tumor cells] using the UOMS microtumor model (Figure 3). Two seeding densities of MDA-MB-231 were tested at 5000 and 20000 cells µL−1. The MDA-MB-231 cells were added onto one of the spots (the proximal spot) of the microchannels [2-2-L0.4-W0.3 and 2-2-L0.5-W0.5 with ECM (collagen Type I, 2.5 mg mL−1, red fluorescence protein (RFP)-labeled] under oil in 1 µL of media. At the low 5000 cells µL−1 seeding density, the tumor cell monoculture groups showed ≈40% ECM contraction by 18 h. Interestingly, the 5000 cells µL−1 tumor cell-fibroblast co-culture groups showed noticeably higher ECM contraction in ≈50 and 70% for CAF and HorF, respectively. In comparison, the high 20 000 cells µL−1 seeding density groups (both monoculture and co-culture) all showed higher ECM contraction in ≈55 to 65% compared to the 5000 cells µL−1 tumor cell monoculture groups. The influence of fibroblasts on ECM contraction in the high seeding density groups was not obvious (seemingly lower than the tumor cell monoculture group but no statistical significance). The tumor cells on the cell seeding spot took a random directionality. By contrast, the tumor cells in the microchannel took a noticeably elongated cell morphology in the direction along the ECM microfiber bundle (Figure S4, Supporting Information). In all these tests (Figure 3a,b), the distal spot of the microchannels without cell seeding showed a stable ECM structure with no contraction. Therefore, we attributed the ECM contraction to the remodeling caused by the tumor cells and fibroblasts. In conditions with a relatively low tumor cell density, the existence of fibroblasts in the TME apparently leads to more ECM contraction. In conditions with a high tumor density, the ECM contraction is significant with and without the existence of fibroblasts. The influence of fibroblasts on tumor cell-ECM interaction is intriguing and potentially an important direction to further explore.
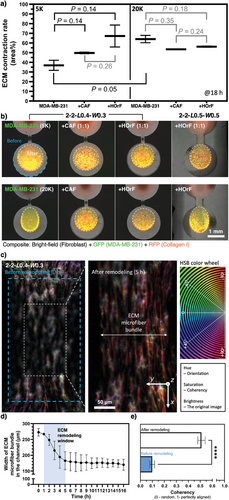
Next, we further look into how the ECM contraction on the cell seeding spot may affect the ECM structure in the microchannel (Figure 3c–e). We chose to use the 2-2-L0.4-W0.3 microchannel to start with a low microfiber alignment in the channel (coherency <0.1) and 20000 cells µL−1 seeding density for a strong ECM contraction on the cell seeding spot. The results showed that at ≈1 h from cell seeding the ECM contraction on the cell seeding spot started causing a visible contraction of the microfibers in the channels and quickly in ≈4 h the microfibers in the channel got focused into a tight bundle (Figure 3d; Movie S1, Supporting Information). After 5 h, the ECM remodeling in the channel reached a steady stage. Due to the strong stretching, the microfiber alignment in the channel significantly increases (coherency >0.5) (Figure 4e). If the channel width is less than 0.3 mm, the tested tumor cells at the high 20000 cells µL−1 seeding density eventually snap the microfiber bundle (see results and expanded discussion in the next section, Movie S2, Supporting Information). The MDA-MB-231 cells used in this work are GFP-labeled. Since GFP is only expressed in live cells and dead cells lead to a quick loss of GFP and fluorescence, cell viability can be easily monitored and evaluated in real-time and in situ. At least up to 18 h we didn't notice any change in GFP intensity, which indicates high viability of the cells in the tests on our device. These ECM contraction assays demonstrated with the UOMS microtumor model can be used to evaluate the ECM remodeling capacity of primary tumor cells from patients in different cancer types and/or stages.
2.4 Capture of Two Different Modes of Tumor Cell Migration: Individual Cell Migration Versus Cell Cluster Slingshot
TME represents a lesioned micro niche in tissue with a complex set of stresses (e.g., low nutrients, hypoxia, high acidity) on the cells. The accumulated stresses during carcinogenesis eventually trigger epithelial-mesenchymal transition (EMT) and cancer metastasis.[34] A more developed TME is expected to inflict more stress on the cells, which could affect the process of tumor cell migration.
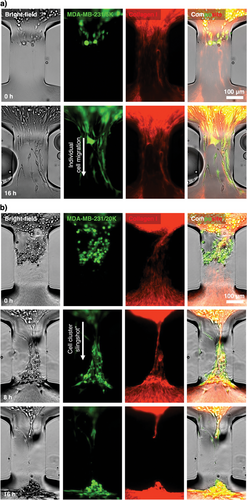
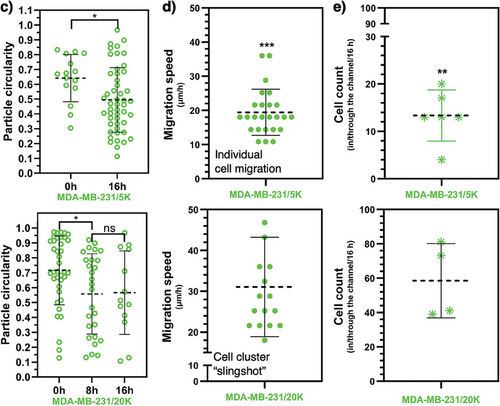
Here, we investigate if the UOMS microtumor model may capture any difference in tumor cell migration at different tumor cell seeding densities [i.e., low (5000 cells µL−1) and high (20 000 cells µL−1) seeding densities to partially mimic the different levels of stress at the early and late tumor niche development] (Figure 4). At the low 5000 cells µL−1 seeding density, the MDA-MB-231 cells, as expected, migrated into the microchannel (2-2-L0.3-W0.2) toward the distal spot without cells. The migrating cells in the microchannels showed noticeably elongated cell morphology (>100 µm in cell length compared to ≈15 µm of the cells at a neutral state on the proximal spot) strictly following the aligned collagen microfibers (Figure 4a,c; Movie S2a, Supporting Information). As shown in the previous section, the low seeding density causes ≈40% ECM contraction during tumor cell migration in 24 h, exerting weak to little remodeling of the collagen microfibers and bundle in the microchannel.
By contrast, the MDA-MB-231 cells at the high 20 000 cells µL−1 seeding density strongly contracted the ECM on the proximal spot, stretching the collage microfibers and bundle in the microchannel (2-2-L0.3-W0.2) (Figure 4b; Movie S1 and S2b, Supporting Information). The strong ECM contraction heavily stretched and tightened the collagen microfiber bundle in the microchannel and finally snapped it. The tumor cells accumulated at the entrance of the microchannel got spontaneously focused into a cluster, strictly following the stretched microfiber bundle and showing a similar elongated cell morphology (Figure 4c) as observed in the 5000 cells µL−1 groups. During the snap of the microfiber bundle at the end, the whole cluster got pulled into the distal spot in a slingshot-like motion (Movie S2b, Supporting Information). Compared to the cell migration speed of individual cells at ≈20 µm h−1, the cell cluster slingshot resulted in a much higher motion speed at ≈32 µm h−1 (Figure 4d) and consequently a higher cell count reaching the distal spot (≈14 cells per microchannel for individual cell migration versus ≈60 cells per microchannel for cell cluster slingshot) (Figure 4e). We further tested the conditions with fibroblasts (CAF and HOrF) and our results showed that tumor cell density was predominant in determining between the two migration modes – individual cell migration or cell cluster “slingshot”.
As opposed to the broadly reported individual cell migration, tumor cell cluster or collective migration has been reported as an emerging tumor invasion mechanism that may reshape the understanding of cancer metastasis and anti-metastasis treatment strategies.[35-37] The UOMS microtumor model successfully captures individual cell migration and a cell cluster slingshot-like motion associated with tumor cell seeding density and spontaneous tumor cell-ECM remodeling/contraction (Figures 3 and 4). In the experiment, we observed that tumor cells kept migrating to the distal spot after the microfiber bundle was snapped in the microchannel. Previous studies in tumor cell migration showed that aligned ECM fibers don't lead to significantly increased tumor cell migration speed but make the tumor cell migration more directional and thus more efficient to evade immune surveillance. In light of this knowledge, the individual cell migration will be likely the winner in an enough long-term test (e.g., days), once the microfiber bundle breaks after the cell cluster slingshot resulting in loss of directionality. Our results in Figure 4 highlight a short-term cluster migration mechanism of tumor cells enabled by tumor cell-ECM interaction that may contribute to tumor metastasis and immune invasion. While we preserve the caveat if similar cell cluster motion mechanisms may exist in vivo or not, the UOMS microtumor model demonstrates its capability to establish and investigate a variety of tumor cell-ECM microenvironments and interactions with open system standard and configurations.
2.5 Anti-Metastasis Drug Test on Suppressing Tumor Cell Migration and ECM Remodeling
Cancer metastasis is the leading cause of mortality in cancer diseases regardless of cancer subtypes.[38] For example, in breast cancers, TNBC, HER-2 positive, and inflammatory subtypes have poorer survival rates partially due to the higher metastatic potential.[39] Drug therapy with substantial anti-metastasis efficacy may improve prognosis in patients at the early to mid stages.[40]
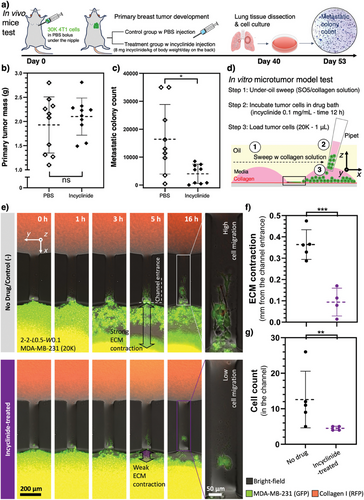
In the last section, we further demonstrate the translational capability of the UOMS microtumor model in anti-metastasis drug tests. We selected incyclinide – an MMP inhibitor – to target the ECM remodeling. Incyclinide demonstrated an anti-metastatic effect in mice models inoculated with breast cancer cells (Figure 5a–c). Interestingly, incyclinide did not significantly decrease the primary tumor mass compared to the control group (Figure 5b; Figure S5, Supporting Information). However, the reduction of metastasis to the lung in the treated group is statistically significant (Figure 5c). We then tested the possible anti-metastasis effect in vitro with the UOMS microtumor model by measuring single-cell migration and ECM remodeling (Figure 5d–g). The microchannels we chose in this test are 2-2-L0.5-W0.1. The 0.1 mm channel width facilitates cell count and tracking in the channel (see Experimental Section) compared to thicker channels. In the UOMS microtumor model, the no-drug control groups showed strong ECM contraction on the seeding spot and high tumor cell migration into the microchannel (Figure 5e,g; Movie S3, Supporting Information). By contrast, the incyclinide-treated groups showed significantly weaker ECM contraction on the seeding spot and lower tumor cell migration into the microchannel (Figure 5e,g; Movie S3, Supporting Information). Note that the ECM contraction here [≈ 0.4 mm radial contraction (Figure 5f) that is equivalent to 65% area contraction rate as calculated in Figure 3] was calculated as the distance differential between the edge of the cell seeding spot and the edge of the contracted ECM due to the high magnification imaging needed for cell tracking. We acknowledge that in vitro microtumor models, to the best so far, only recapitulate a subset of the parameters involved in a TME in vivo. The anti-metastasis effect on mice might not be necessarily and completely explained by the tumor-cell ECM interactions revealed in the UOMS microtumor model, however, the UOMS microtumor model could be used as a pre-screening platform for anti-metastasis/anticancer drug screening before animal model tests.
3 Conclusion
In vitro microtumor models[1] continue to play an important role in cancer pathology studies and clinical applications, for example, patient stratification, drug testing, and treatment screening. While a decent cluster of in vitro microtumor models has been reported, most of these models were developed based on closed-system microfluidics.[41] The closed-system configuration is not well aligned with the open-system standard in biology and biomedicine, adding adoption and implementation barriers to the end users (e.g., biologists, and oncologists) where the most impact is expected to see from using these models.
In this work, we aim to leverage the ELR-empowered UOMS[12, 21-28] to establish an open microfluidic in vitro microtumor model with controlled, self-organized ECM microenvironments for studying tumor cell-ECM interactions and pre-screening of anti-metastasis strategies. Our design principle is driven by combined top down and bottom up for synergized controllability and efficiency. The operators are only required to design the surface patterns top down. Defined by the Laplace pressure-driven lateral flow dynamics, a layer of ECM can be readily introduced into an array of open microchannels [e.g., 24 units per standard chambered coverglass (6 cm × 2.4 cm in footprint), max. 4 pieces of chambered coverglass per run of imaging] by a fast sweep[24, 25] (in a minute) with either homogeneous or heterogeneous compositions and structures. The following polymerization and self-organization of the ECM microfibers occur spontaneously on the UOMS microtumor device bottom up. The ELR physics and absolute antifouling property[21] make the device fabrication and sample operation/on-device manipulation error-proof, which significantly lowers the adoption and implementation barriers. Cells and reagents (e.g., fresh/conditioned culture media, drug solution, pathogens, etc.) can be easily added to or collected from the units of interest on a device with minimized system disturbance.
Further validation of the UOMS microtumor model with patient samples and more drugs is a necessary step toward clinical applications. Lateral flow can be easily introduced to the UOMS microtumor model via active pumping or passive pumping.[25] The study of tumor cell-ECM interaction, tumor cell migration, and tumor-immune interaction in a dynamic flow environment better mimics the real TME in vivo. For patient sample assay and drug screening, the free physical access and flexible spatiotemporal sample organization in the UOMS microtumor model will greatly facilitate the assay functionality, for example, the timing of drug loading, seamless and non-destructive on-chip sample collection (e.g., conditioned media, cells of interest) during the assay.
This UOMS microtumor model can be further integrated with other UOMS-based technologies including autonomously regulated oxygen microenvironment (AROM),[12] microliter whole blood assay (µ-Blood),[42] microbial communities,[26, 43] ELR-antimicrobial susceptibility testing (AST),[27] micro total analysis system (µTAS),[22] and label-free spectroscopies (e.g., multiphoton,[26] Raman,[28] and IR[44]). Thanks to its natural alignment with the open system standard, the UOMS microtumor model is compatible with the automated liquid handling tools (e.g., robotic pipetting/microtiter plate preparation systems) in biology and clinical laboratories. Integrated with lab automation will further increase the efficiency, consistency, and throughput of the UOMS microtumor model.[23]
Tumor-associated collagen signatures (TACS) have been developed as a marker for the staging of breast cancer malignancy.[45-47] The coherency and orientation of collagen fibers vary significantly between benign and malignant tissues (TACS1-8).[47] Normal breast stroma is characterized by loosely packed collagen fibers around the ducts, whereas the collagen fibers in tumor tissues demonstrate increased density and form bundles radiating from the tumor boundary, correlating directly with metastasis. The UOMS microtumor model demonstrates that tumor cells can rapidly reorganize the ECM microenvironment via mechanobiological interaction in <12 h ex vivo. In the meanwhile, the reorganized ECM microenvironment affects tumor cell migration (e.g., individual cell migration versus cell cluster slingshot) and possibly invasiveness. Different from the micro-tumor models constructed with a pre-set, stable ECM microenvironment, the UOMS microtumor model emphasizes the simulation and quantification of the dynamic TME as observed in vivo. The following primary tumor cell study in the UOMS micro-tumor model will help better understand tumor cell-ECM interaction – specifically ECM remodeling – and development of intervention strategies that mitigate/suppress metastasis – the real killer of cancer.
4 Experimental Section
Preparation of the ELR-Empowered UOMS Devices
The detailed protocol was described in the previous publications.[24, 25] Briefly, the process includes i) surface modification, ii) surface patterning, and iii) under-oil sample loading. Surface modification introduces a monolayer of covalently bonded PDMS-silane (1,3-dichlorotetramethylsiloxane, Gelest, SID3372.0) molecules by vacuum chemical vapor deposition (CVD) (Bel-Art F420220000, Thermo Fisher Scientific, 08-594-16B) at RT. In this work, standard chambered coverglass [Nunc Lab-Tek-II, 2 well (155379), #1.5 borosilicate glass bottom, 0.13 to 0.17 mm thick was used; Thermo Fisher Scientific] to prepare the devices. The following surface patterning step was to transfer a designated pattern from a PDMS stamp (or mask) to the PDMS-silane grafted surface by selective oxygen plasma treatment (100 W 1−1 min) (Diener Electronic Femto, Plasma Surface Technology). Finally, oil (silicone oil, 5 cSt, 317667, Sigma–Aldrich) was added to the device and cellular/molecular samples can be loaded under-oil by under-oil sweep distribution or regular pipetting.
Under-Oil Microchannels with ECM Coating
The under-oil ECM microchannels was prepared by under-oil sweep distribution. Collagen gel (Rat Tail, Type I, CLS354249, Corning) was prepared with 1:1 volume ratio of the original collagen stock (≈10 mg mL−1) to 2% (wt.) 2-[4-(2-hydroxyethyl)piperazin-1-yl]ethanesulfonic acid (HEPES) 2×phosphate-buffered saline (PBS) solution, followed by another 1:1 volume ratio dilution with the target cell culture media. The final collagen solution was supplemented with 5% (vol.) fluorescent collagen (RFP or GFP) and lastly adjusted to pH 7.4 with 0.5 m sodium hydroxide (NaOH) endotoxin-free aqueous solution. All these operations were done on ice to prevent pre-polymerization. After sweeping, the ECM microchannel devices were left at RT (≈21 °C) for 1 h to allow a complete polymerization.
Cell Culture and Passage
MDA-MB-231 cells (GFP labeled) were cultured in Dulbecco's modified Eagle's medium (DMEM) (11960051, Thermo Fisher Scientific) + 10% fetal bovine serum (FBS) (10437010, Thermo Fisher Scientific) and 1% Penicillin-Streptomycin (15140122, Thermo Fisher Scientific) in a standard carbon dioxide (CO2) incubator [at 37 °C with 18.6% O2, 5% CO2, 95% relative humidity (RH)] in a T75 tissue culture flask. When reaching ≈50% confluency, the cells were first washed with 1×PBS then trypsinized with 0.05% Trypsin (25200056, Thermo Fisher Scientific). The released cells were counted and resuspended to 20000 cells µL−1 and then diluted down to 5000 cells µL−1 stocks. 1 µL of the cell suspension was loaded to the cell seeding spot by regular pipetting through the oil overlay. The UOMS microtumor model devices were kept in a standard CO2 incubator before and during the imaging gaps.
In Vitro Incyclinide Treatment and Cell Migration
40 mg of incyclinide (TA9H94533373, Sigma-Aldrich) was dissolved in 1 mL dimethyl sulfoxide (DMSO) to reach 40 µg µL−1. 1 µL of the incyclinide solution was added to each 10 mL of culture media. After cell passage, the cells were incubated with the incyclinide-supplemented culture media for overnight. The incyclinide-treated cells were first washed with 1×PBS then trypsinized with 0.05% Trypsin. The released cells were counted and resuspended to 20000 cells µL−1 and then diluted down to 5000 cells µL−1 stocks. 1 µL of the cell suspension was loaded to the cell seeding spot by regular pipetting through the oil overlay.
In Vivo Incyclinide Treatment and Tumor Metastasis
The mice model experiments were performed in the Liu Lab (Liberty University). 20 of 8-week-old BALB/c mice (Jackson Laboratory) were inoculated with 4T1 mouse mammary cancer cells at 30K cells per mouse in the fat pad under nipple number 9. 10 days later when tumors became palpable, 10 mice were treated with incyclinide dissolved in 1×PBS with a pH of 7.8. Incyclinide was administered subcutaneously at 8 µg Kg−1 daily. Control mice received the save volume of 1×PBS at the same pH. Mice were sacrificed 40 days after inoculation (30 days of treatment). The organs of the mice were weighed to calculate the organ index (defined as the ratio of individual organ weight to that of the total body weight). Lungs were minced and digested with 1×PBS solution containing collagenase IV (17104019, Thermo Fisher Scientific) at 1 mg mL−1 and elastase at 6 U mL−1 (E-240, Goldbio) for 1 h. The cell suspension was filtered using a 70-µm cell strainer (43-50070-51, PluriSelect) and cultured in RPMI 1640 (11875093, Gibco, Thermo Fisher Scientific) supplemented with 10% FBS, 6-thioguanine at 10 µg mL−1, and Gibco Antibiotic-Antimycotic (15240062, Thermo Fisher Scientific). Colonies of metastatic cells were stained with crystal violet and counted after 13 days of incubation. The Mann-Whitney U test was used for statistical differences. Ethical approval for this in vivo study was granted by the Liberty University Institutional Animal Care & Use Committee (protocol number 82.220907) to Dr.Yingguang Liu on Sep.7.2022.
Imaging and Time Lapse
Bright-field, fluorescence images and videos were recorded on a Nikon Ti Eclipse inverted epifluorescence microscope (Nikon Instruments). The UOMS microtumor model devices were kept at 37 °C, 21% O2, 5% CO2, and 95% RH via an on-stage incubator (Bold Line, Okolab) during imaging. A Zeiss Apotome 3 epifluorescence microscope was used to record the quasi-confocal fluorescence images.
Image/Video Analyses
Image/video analyses were performed in Fiji ImageJ. i) Surface area analysis. Regions of interest (ROIs) were drawn manually on the target ECM regions in ImageJ and then measured. ii) Orientation analysis. The orientation analysis of the ECM microfibers was performed in ImageJ using the OrientationJ plugin. The color survey[48] images were generated with “OrientationJ Analysis”. The coherency was measured with “OrientationJ Measure”. iii) Cell morphology analysis. The circularity of cells was analyzed in ImageJ using the “Analyze → Analyze Particles…” function. iv) Cell counting and speed tracking analysis. Manual counting was performed in ImageJ with the timelapse videos recorded on the Nikon microscope by counting each individual cell that passes into the channel. For speed tracking, images in a timelapse were transferred into ImageJ, where cell tracking was performed manually using the MTrackJ plugin. Once MTrackJ was selected, the “Add” option allows tracking of each individual migrating cell. Once the manual tracking was done for each migrating cell, measurements could be taken automatically. Measurements were created through the MTrackJ measurements option. All data graphs were prepared in GraphPad Prism 10.1.2. Videos were edited and compiled in the VSDC video editor.
Statistical Analysis
Raw data was directly used in statistical analysis with no data excluded. Data was averaged from at least 3 replicates (unless otherwise stated) and presented as mean ± standard deviation (S.D.) if applicable. The statistical significance was specified in the figure captions. All statistical analyses were performed with one-way ANOVA in GraphPad Prism 10.1.2.
Acknowledgements
Experimental work was performed in the MMB Lab facility at the University of Wisconsin-Madison. The authors thank Dr. David J. Beebe for offering suggestions. The mice experiments were supported by Dr. Yingguang Liu and performed in the Liu Lab at the College of Osteopathic Medicine, Liberty University (Liberty University Institutional Animal Care and Committee Protocol 82). We thank Dr. Adeel Ahmed (the MMB Lab) for the discussion on the recent progress in microfluidics-based ECM alignment techniques. Funding: The animal model work was supported by the Liberty University Center for Research and Scholarship.
Conflict of Interest
The authors declare no conflict of interest.
Author Contributions
C.L. and J.L. contributed equally to this work. C.L. conceived the project and designed the research. C.L. directed the under-oil microtumor model development and C.L., J.L., Z.A., M.A.F., and B.R. performed data collection. J.L., A.K., S.N., and Y.L. designed and conducted the in vivo mice experiments. C.L., J.L., and N.W.H. performed data analysis and visualization. C.L. and Y.L. supervised the project. C.L. and J.L. wrote the manuscript and all authors revised it.
Open Research
Data Availability Statement
The data that support the findings of this study are available from the corresponding author upon reasonable request.


