Poly-L-lactic acid/lead(II) acetate basic colour indicator membrane for visual monitoring in shrimp freshness
Funding information: This work was financially supported by the Natural Science Foundation of Inner Mongolia, China (2021MS03017), Science and Technology Program of Inner Mongolia, China (2021GG0430), National Natural Science Foundation of China (31760481).
Abstract
Seafood products are prone to deterioration and, therefore, require a label that identifies quality with the naked eye. A visual freshness colour indicator membrane incorporated with poly-L-lactic acid and lead(II) acetate basic is designed via electrospinning technology for freshness monitoring. The colour indicator membrane had a uniform fibre thickness with an average diameter of 1.54 μm and a large specific surface area. In addition, the colour stability of the membrane did not vary with temperature and humidity. The hydrogen sulfide (H2S) responsivity results showed that the membrane gave a rapid and accurate response to the freshness of shrimp, and the detection limit of H2S is 0.45 ppm. Finally, in application, the colour change of the membrane correlated linearly with the freshness of the shrimp, allowing the quality of the shrimp to be identified with the naked eye. The experimental results showed that poly-L-lactic acid/lead(II) acetate basic colour indicator membrane had great potential in the detection of shrimp freshness.
Highlights
- The colour indicator membrane had a large specific surface area for more sensitive freshness detection.
- The colour indicator membrane was sensitive to H2S with a minimum detection limit of 0.45 ppm.
- The colour change of the membrane correlated with the freshness index of the shrimp.
1 INTRODUCTION
Seafood products are rich in high-quality proteins, unsaturated fatty acids and biologically available trace elements, which were not readily found in terrestrial food.1, 2 In addition, 17% of global edible meat production is seafood, so it played a vital role in people's healthy diet.3 As consumers demand for seafood products, more and more fresh seafood is being shipped across the country. During transportation, the uncontrolled storage environment and transportation temperature can lead to microbial growth and multiplication in seafood products, producing a large number of spoilage and pathogenic bacteria, which can lead to diarrhoea, vomiting, and even death, and other food-borne diseases.4 Food safety widely concerned consumers.
Traditional methods of monitoring food freshness include gas chromatography,5 liquid chromatography,6 electronic tongue,7 electronic nose8 and capillary electrophoresis.9 However, these methods had limitations, relying on expensive instruments and complex operations, time consuming and destructive to samples. The ‘shelf life’ on food package can no longer accurately show the remaining consumption time of food.10 In recent years, people began to pay attention to the research of intelligent packaging, hoping to achieve real-time monitoring of packaging through internal changes in product quality, and provide consumers with information about product status.11 It is urgent to develop fast, simple, cheap, biodegradable and accurate sensors for real-time detection of shrimp freshness.
Microbiological and chemical spoilage of seafood products can lead to the release of different compounds such as amines, ammonia, hydrogen sulfide (H2S), carbon dioxide and organic acids.12 H2S is a volatile gas produced during meat deterioration, which is mainly produced in the degradation of sulfur-containing amino acids.13 The accumulation of H2S is one of the indicators of seafood spoilage.14 Wang et al. prepared an aggregation-induced emission (AIE)-active fluorescent probe with aggregated state transition for sensing H2S in a ratiometric manner for the detection of freshness in shrimp and beef.15 The colour of the strips changed from green to red under UV light as the meat changed from fresh to rancid with increasing storage time. Lin et al. synthesized a mimetic enzyme based on Cu2+-modified boron nitride nanosheets-supported gold nanoparticles (AuNPs/Cu2+-BNNS), which can be used to catalyse the oxidation of 3,3′,5,5′-tetramethylbenzidine (TMB).16 The H2S gas can inhibit the activity of AuNPs/Cu2+-BNNS toward catalytic oxidation of TMB. The AuNPs/Cu2+-BNNS sensors were successfully applied to detect H2S produced by pork spoilage with satisfying results. Therefore, H2S is considered to be a characteristic compound for assessing meat deterioration. Lead(II) acetate basic (LAB) is a well-known dye that reacted with H2S to form dark brown precipitates of lead sulfide (PbS) (Pb (CH3COOH)2 + H2S=PbS↓ + 2CH3COOH).17 Poly-L-lactic acid (PLLA) is a new type of biodegradable material, mainly derived from the starch extracted from natural crops such as wheat, sugar cane, corn and renewable plant resources, fermented into lactic acid and then synthesized PLLA of a certain molecular weight through chemical synthesis.18 PLLA has good bio-compatibility and mechanical properties. PLLA is one of the most promising compost plastics.19 It could be fully degraded into carbon dioxide and water in nature, which is an excellent polymer base.
Accordingly, in this study, we developed a colour indicator membrane for monitoring the freshness of shrimp at 25°C. The membrane is based on the correlation between the release of H2S and the freshness of shrimp during spoilage of seafood products. The colour indicator membrane is prepared by electrostatic spinning of LAB and PLLA solutions. LAB could be evenly distributed in the PLLA solution. The colour indicator membrane prepared by electrostatic spinning technology increased the specific surface area of the membrane to facilitate adequate contact between LAB and H2S for monitoring the freshness of shrimp. The results confirmed that the prepared colour indicator membrane can accurately and quickly respond to the corresponding colour of H2S released from shrimp. Therefore, it can be used as a non-contact naked eye visual colour indicator membrane for seafood freshness monitoring.
2 MATERIALS AND METHODS
2.1 Materials
The shrimp used in the experiment was fresh shrimp, which is purchased from Dongwayao Market (Hohhot, China). PLLA (Mw = 100 000), LAB, dichloromethane (DCM), N,N-dimethylformamide (DMF), H2S(100 ppm) and hydrochloric acid are obtained from Sigma-Aldrich (Sinopharm Chemical Reagent Co., Ltd., China). Plate count agar was purchased from Huankai Microbial (Guangdong, China).
2.2 Preparation of colour indicator membrane
2.2.1 Preparation of electrostatic spinning solutions
PLLA solution was prepared by dissolving the PLLA in DCM by continuous stirring until the solution became transparent and homogeneous. LAB was dissolved in DMF with a constant stirring until the LAB was uniformly distributed in the DMF solution. Then, the electrostatic spinning solution was prepared by adding the LAB solution to the PLLA solution and stirring well. The concentration of PLLA was 12% (w/v), the ratio of DCM/DMF (v/v) was 4:1 and the concentration of lead acetate basic was 0%, 0.3% (w/v) and 0.6% (w/v) respectively.
2.2.2 Preparations of colour indicator membrane
The PLLA/LAB colour indicator membrane was prepared using a TL-Pro (Shenzhen Tongli Technology Co., Ltd., China). The polymer solution was loaded into a syringe (20 mL volume). Then, the syringe was fixed on the electrostatic spinning machine. Nanofilaments were collected with aluminium foil. The distance between the collector and the spinneret was 15 cm. A feed rate of electrostatic spinning was 1 mL/h, and the rotation speed of the drum was 150 rpm, voltage 20 KV, humidity 20%. The colour indicator membranes with 0%, 0.3% and 0.6% LAB were named PLLA, PLLA/0.3 LAB and PLLA/0.6 LAB, respectively.
2.3 Characteristics of colour indicator membrane
2.3.1 Analysis of microstructure
The microstructure of colour indicator membrane was studied by a scanning electron microscope (SEM) (SEM-TM4000 Plus, Hitachi High-Technologies Corporation, Japan). The colour indicator membrane was sprayed with gold for easy observation. The distribution of fibre diameters is measured by Image Pro-Plus 6.0 (National Institute of Health, USA) to measure 100 randomly selected points in the SEM image.
2.3.2 Fourier transform infrared (FTIR) spectroscopy
LAB powder, PLLA membrane, and PLLA/LAB membrane are analysed by attenuated total reflection (ATR) IRSpirit-T, (Shimadzu Corporation, Japan). The spectrum collection waves ranged from 500 to 4000 cm−1. The spectrum of each sample is obtained by averaging three scans with a resolution of 4 cm−1.
2.3.3 Water contact angle
The fully dried colour indicator membrane is fixed on the glass plate. The water contact angle (WCA) of the PLLA membrane and PLLA/LAB membrane are measured with an SL200KB Contact Angle System (KINO Industry Co., Ltd., USA). Images are taken with a configured digital camera, and water contact values are captured by a software.
2.4 Stability of colour indicator membrane
2.4.1 Humidity stability
The 2 × 2 cm of PLLA/0.6 LAB colour indicator membrane was placed in a constant temperature and humidity chamber at 25°C and 20%, respectively and 80% humidity. The colour change of the membrane before and after 2 h is measured by CR-10 Plus colour difference meter (Konica Minolta Investment Ltd., Japan), illuminant D65 and a 10° viewing angle. At each humidity level, three samples are placed, and each sample is measured three times.
2.4.2 Temperature stability
where L*0, a*0 and b*0 are the initial chromaticity values of the colour indicator membrane, and L*, a* and b* are the chromaticity values after placement.
2.5 H2S responsivity
where L*0, a*0, and b*0 are the initial colour values of the membrane in a petri dish headspace containing 0 ppm H2S solution, and L*, a*, b* are the colour values of the membrane after reacting with H2S.
2.6 Application of colour indicator membrane in the detection of shrimp freshness
The PLLA/0.6 LAB colour indicator membrane was applied to monitor the freshness of shrimp during storage. Shrimp was placed in petri dish (Diameter = 9 cm), and the PLLA/0.6 LAB membrane (2 × 2 cm) was attached to the headspace of the petri dish without direct contact with the shrimp. The samples were stored in a constant temperature and humidity chamber at 25 ± 1°C. The samples were photographed and recorded by the camera. The colour change of PLLA/0.6 LAB membrane was measured by a CR-10 Plus colour difference meter. Three samples were randomly allocated to the total bacterial colony (TVC) according to GB 4789.2-2016.
2.7 Statistical analysis
All samples were prepared in triplicate, and the experimental data was expressed as mean ± standard deviation (SD). Statistical analysis was carried out using SPSS. Figures were processed using Origin 7.0 software (Origin Labs).
3 RESULTS AND DISCUSSION
3.1 Characteristics of colour indicator membrane
3.1.1 Morphology and diameter distribution
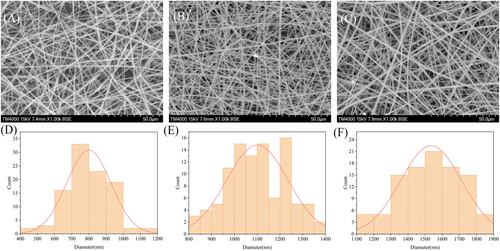
Figure 1 showed the microstructure of the colour indicator membrane at different concentrations. The PLLA membrane structure had uniform fibres, a smooth surface, and a diameter of 799 mm (Figure 1A,D). After adding LAB to the PLLA solution, the fibre of the obtained fibrous membrane remained uniform and surface was smooth (Figure 1B,C). Moreover, LAB was observed to aggregate in the fibrous membrane. Then, with the increase of LAB concentration, the fibre diameter increased from 1.10 to 1.54 μm (Figure 1E,F). This phenomenon may be due to the increase of solution concentration leading to the increase of viscosity with the increase of LAB concentration.20 As the solubility of the solution increased, the viscoelasticity of the polymer jet increased, making it more difficult to stretch the fibre, so the fibre diameter increased. The fibrous shape was beneficial to the increase of the specific surface area of the colour indicator membrane, and the lead acetate dye was more likely to be exposed to gas. In summary, the colour indicator membrane had a larger specific surface area, thus improving the sensitivity of freshness detection.
3.1.2 FTIR spectra
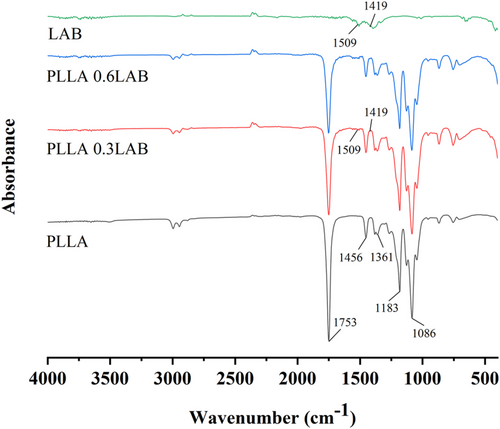
The chemical interaction between the PLLA and LAB was evaluated using FTIR, and the consequent FTIR was shown in Figure 2. In the spectra of PLLA, PLLA 0.3 LAB and PLLA 0.6 LAB, the absorption peaks observed around 1753 and 1456 cm−1 were attributed to the bending vibrations of the -C=O and -CH3.21, 22 In addition, the absorption peaks at 1183 to 1087 cm−1, which was due to the multimodal distribution of -C-O-C- bonds of different groups and atoms.23 The peak value around 1361 cm−1 was bending the vibration of -C-H.24 In the spectrum of LAB, PLLA 0.3 LAB, and PLLA 0.6 LAB, two arm peaks at 1509 and 1419 cm−1 could be attributed to the symmetric stretching vibration of -C=O and the absorption vibration of the asymmetric stretching vibration.25 No new chemical bonds were generated in PLLA 0.3 LAB and PLLA 0.6 LAB, and only physical changes occurred in PLLA/LAB colour indicator membrane. Thus, FTIR spectra revealed that LAB was successfully incorporated in the PLLA.
3.1.3 WCA
The WCA was an important indicator of the wettability of a material's surface, with WCA θ = 90° being the boundary between hydrophobicity and hydrophilicity.26, 27 When WCA θ > 90°, it indicated that the colour indicator membrane was hydrophobic and not easily wet by liquids, and the larger the contact angle, the better its hydrophobicity. When WCA θ < 90°, it indicated that the colour indicator membrane was hydrophilic and easily wetted by liquids, and the smaller the contact angle, the stronger the hydrophilic ability. As shown in Figure 3A, the WCA of the PLLA membrane was 116.45°, indicating that PLLA was hydrophobic due to the large number of hydrophobic groups contained in PLLA, such as methyl groups and so forth.28, 29 As shown in Figure 3B,C, the WCA of the colour indicator membrane was 117.85° when adding LAB at a concentration of 0.3%, and 119.95° as the concentration of LAB increased to 0.6%. Therefore, the colour indicator membrane with the LAB concentration of 0.6% was the best for hydrophobicity. The WCA concentration of the added LAB was greater than 90°, indicating that the colour indicator membrane is hydrophobic and not susceptible to water molecules, which creates beneficial conditions for subsequent experiments.30

3.2 Stability of PLLA/0.6 LAB colour indicator membrane
3.2.1 Humidity stability
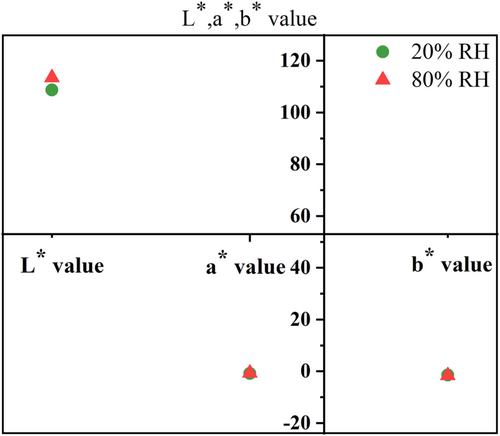
During spoilage, the proteins of seafood products was decomposed under the action of micro-organisms and protein enzymes, leading to an increase in free water.31-33 The humidity stability test was designed to investigate the corresponding colour stability of the colour indicator membrane when the moisture content changed in the packaging environment. This experiment investigated the colour change of the colour indicator membrane at 20% and 80% humidity. As shown in Figure 4, the colour indicator membrane indicated the colour change by L*, a* and b* values. In Figure 4, there was a slight change of L* values in the colour indicator membrane at 20% relative humidity (RH) and 80% RH, while a* and b* values were almost the same. The results showed that humidity had no effect on the colour of the colour indicator membrane. The experiment showed that the PLLA/0.6 LAB membrane had good humidity sensitivity. It can be applied to shrimp freshness monitoring.
3.2.2 Temperature stability
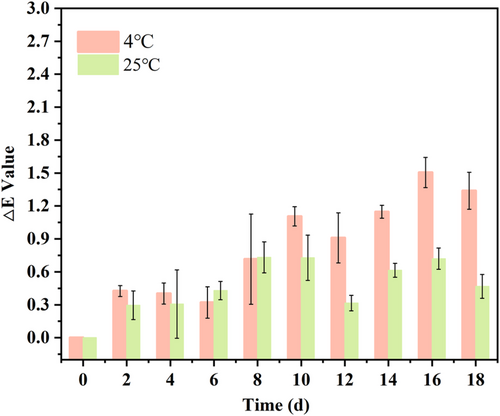
Temperature stability could be assessed as the reliability of the colour indicator membrane in practical application. In order to simulate the actual storage environment of shrimps, 4°C and 25°C were used as experimental temperatures to determine the colour stability of the colour indicator membrane. In Figure 5, the colour of the colour indicator membrane was more stable in 2–8, 10–14 and 16–18 days at 4°C, and colour changed more in 8–10 and 14–16 days. The colour of the colour indicator membrane changed little at 25°C. Although there were fluctuations in the colour change of the colour indicator membrane, ΔE < 3.34 With ∆E > 3, human eyes could identify colour changes. In general, the colour indicator membrane exposed to air for a long time would be oxidized. It was because LAB was not readily decomposed.35 As a result, the PLLA/0.6 LAB colour indicator membrane had excellent colour stability and could be used for shrimp freshness monitoring.
3.3 H2S responsivity
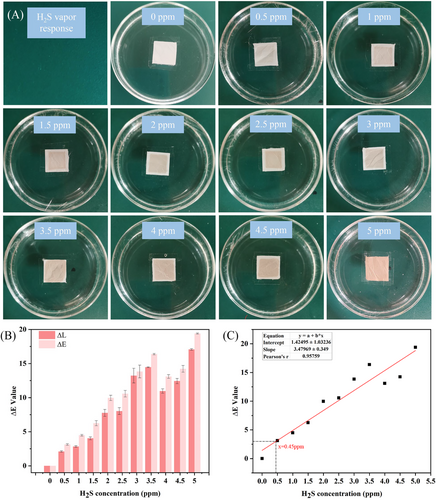
H2S produced during spoilage of seafood is an important indicator of quality. Therefore, to determine the ability of the colour indicator membrane to detect H2S, H2S gas with different concentrations was used to simulate the environmental changes caused by the seafood denaturation process. As shown in Figure 6A, the colour of the colour indicator membrane changed from white to dark brown as the H2S concentration increased, indicating that the membrane was as sensitive as expected. Moreover, it can be seen in Figure 6B that the colour change of the colour indicator membrane was mainly due to the change of L value caused by the generation of black–brown PbS. In addition, as shown in Figure 6C, the detection limit of the colour indicator membrane for H2S was calculated to be 0.45 ppm, which verified the ability of the membrane to detect H2S.36 The colour indicator membrane was prepared simply. Some H2S response labels today require the preparation of metal nanoparticles as an indicator material.15, 16 The colour indicator membrane provided a rapid colour response to different concentrations of H2S.
3.4 Application of colour indicator membrane in shrimp freshness monitoring
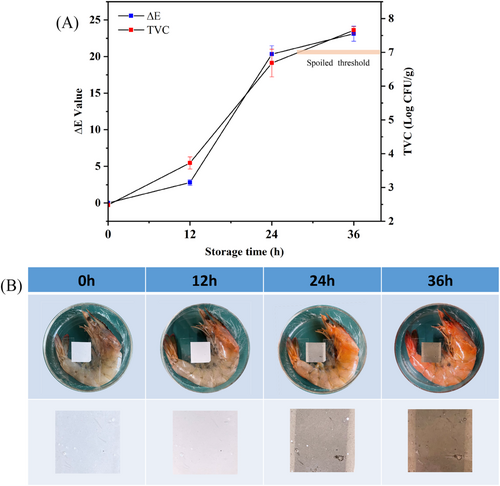
Shrimps are rich in nutrients such as proteins, minerals, and vitamins.37, 38 Therefore, it can provide a rich source of nutrients for microbial growth.39, 40 The growth and multiplication of microorganisms is one of the main factors in shrimp spoilage and is one of the most important indicators of shrimp freshness.41 According to Koutsoumanis,42 a TVC count exceeding 7.0 Log (CFU/g) was considered to be spoiled and unfit for consumption. As shown in Figure 7A, the initial colony count of shrimp at 0 h was 2.48 Log (CFU/g). With the increase of storage time, the total colony count of shrimps at 36 h was 7.65 Log (CFU/g), exceeding 7.0 Log (CFU/g). Therefore, at 36 h, the shrimp had deteriorated and could not be eaten. The colour change of the colour indicator membrane and the corresponding shrimp freshness were shown in Figure 7A,B. It was observed that ∆E in Figure 7A increased with the increase of storage time. This result was due to the accumulation of PbS. In Figure 7B, the PLLA/0.6LAB colour indicator membrane was white at 0 h and gradually darkened with the increase of storage time. At 12–24 h, the TVC content was close to the spoilage limit, and the shrimp was in a sub-fresh state. At this time, the colour indicator membrane was grey. The shrimp deteriorated at 36 h, and the colour of the colour indicator membrane became dark brown. The experimental result of ΔE was consistent with the results of the shrimp TVC. Compared with pH-responsive freshness detection labels responding to biogenic amines produced by meat during spoilage,43, 44 the colour indicator membrane responds only to H2S and detects the substance more uniquely. The results showed that colour indicator membranes could accurately detect the freshness of shrimp.
4 CONCLUSIONS
The PLLA/LAB colour indicator membrane was developed for shrimp freshness monitoring. The LAB was dispersed into PLLA-based fibres using electrostatic spinning technology to give the colour indicator membrane a larger specific surface area. Through H2S responsivity, we found that the colour indicator membrane had high colour responsiveness to H2S. When applied to the packaging of shrimps with a TVC value above the spoilage threshold, the colour indicator membrane displays a visually distinguishable colour, from white to dark brown. The experiments on shrimp samples showed that the PLLA/LAB colour indicator membrane had considerable potential in monitoring food freshness.
ACKNOWLEDGEMENTS
This work was supported by the Natural Science Foundation of Inner Mongolia, China (2021MS03017), Science and Technology Program of Inner Mongolia, China (2021GG0430), and National Natural Science Foundation of China (31760481). We thank Mrs. Lingling Wu for polishing the manuscript.
Open Research
DATA AVAILABILITY STATEMENT
The data that support the findings of this study are available from the corresponding author upon reasonable request.


