In Situ Mass Spectrometric Reaction Monitoring of Atmospheric Corrosion Processes
Abstract
A set-up for in situ mass spectrometric reaction monitoring of gas phase mediated reactions is presented. Important constructive parameters for a reaction chamber for the investigation of atmospheric corrosion processes is discussed. The presented cell is especially well suited for atmospheric corrosion studies but it can easily be modified to be applicable in other fields of research as well. The atmospheric corrosion of electrolytically deposited zinc surfaces on steel during wet- and dry-cycles is investigated as a model reaction. Corrosion rates as well as current densities during the first wet- and dry cycle are calculated and discussed. Complementary scanning Kelvin probe (SKP) measurements are performed to show the electrochemical changes occurring at the metal/air-interface throughout the corrosion process. Contact potential difference versus distance measurements performed in advance to determine the maximum measurement distance, which allows investigating rough salt loaded sample surfaces via SKP surface scans.
1 Introduction
A vast number of different investigation techniques has been established in atmospheric corrosion studies over the years. The neutral salt spray test or other simple corrosion tests became standard tests in steel producing and steel processing companies in the last decades.1, 2 The time span until red rust formation occurs and/or the mass loss are determined, which provide in general very little mechanistic insight into corrosion processes. Furthermore, weathering conditions applied in these tests are very harsh. Therefore, these methods are mainly used for quality control.
To get a deeper mechanistic understanding of the corrosion behavior, metallic coatings and metal surfaces have been investigated in natural or more realistic environments. Long term natural weathering experiments were performed by Mendoza et al.3 who investigated the influence of environmental parameters and important pollutants such as SO2 or CO2 at coastal, urban-industrial, and rural areas. Wallinder et al.4 studied the influence of exposure direction or angle of inclination on run off rates. Raman5-7 and infrared spectroscopy,7-10 XRD,5, 7, 9, 10 as well as XPS11 have been used to determine the general corrosion product composition on corroded metal surfaces. The influence of different corrosive gases like SO2,5, 12 NO2,5 and CO213 as well as localized corrosion due to NaCl loads5, 12-15 or single salt crystals12-14, 16 has extensively been studied in laboratory experiments. Recently, the focus lies on in situ corrosion studies in mild to natural conditions. In that regard, spectroscopic methods like Raman spectroscopy,5, 6, 8, 14 (photoelastically modulated) infrared reflection absorption spectroscopy (IRRAS)8, 10, 17-19 or even vibrational sum frequency spectroscopy8, 20 have proven to be valuable tools for the investigation of the chemical composition of corroded surfaces. Electrochemical changes are monitored in situ using scanning Kelvin probe.21-26 The activation of the surfaces as well as the formation of anodic and cathodic spots can be visualized by a spatial mapping of the contact potential difference (CPD).
As potential measurements provide only information about the driving force for a reaction, it is important to acquire complementary quantitative information of the reaction under investigation. At the very beginning of the corrosion process this has to be realized by the use of very sensitive weighing techniques like quartz crystal microbalance (QCM), which can measure mass changes as small as 0.7 ng cm−2.27, 28 QCM was frequently used in combination with IRRAS,18, 29 vibrational sum frequency spectroscopy,8, 20 or intermittent contact mode-AFM.30 The major drawback of the QCM method is that the substrate has to be a coated quartz crystal and the layer thickness is limited to a few micrometres. Industrial coatings cannot be applied onto the crystal surface and only pure metals or model alloys30-32 can be investigated. Another possibility to quantify the corrosion rates of metals and alloys, which has been presented by Stratmann et al.,33 is to measure the pressure loss due to oxygen consumption during the corrosion process. These values can be used to calculate the corrosion rates. A new approach to this concept is presented in this paper using mass spectrometry. Previous work on corrosion studies using mass spectrometry was done by Hyung-Suk Oh et al.34 who investigated the corrosion resistance of graphitized carbon support in a polymer electrolyte membrane by on-line monitoring of the CO2 development in fuel cells.
In this work, a corrosion cell was designed, which can be coupled to a mass spectrometer, used to in situ determine the oxygen consumption rates.
2 Materials and Methods
2.1 Sample Preparation and Experimental Conditions
Electrolytically zinc coated steel sheets (voestalpine Stahl GmbH) with a thickness of 0.78 mm were cut into 7 × 2 cm2 sized pieces. The surface was cleaned using dichloromethane (p.a., Merck) steam and consequently washed with dichloromethane and ethanol (p.a., VWR). The cut edges were varnished to avoid galvanic corrosion. After the lacquer had dried, the samples were immersed in an artificial sea salt solution. Thereby an average salt load of 0.16 ± 0.02 g cm−2 is applied on the zinc surface. The artificial sea salt was prepared according to ASTM-D-1141.35 The exact composition is summarized in Table 1. The salts were dissolved in one litre of 0.055 μS cm−1 water. Between and after each preparation step, the samples were dried and stored in an inert nitrogen atmosphere.
| Salt | Weight/mg |
|---|---|
| NaCl | 24.54 · 103 |
| MgCl2 · 6H2O | 5.19 · 103 |
| Na2SO4 | 4.08 · 103 |
| CaCl2 | 1.16 · 103 |
| KCl | 695.7 |
| NaHCO3 | 201.0 |
| KBr | 100.3 |
| H3BO3 | 27.5 |
Glass slides with dimensions of 7 × 2 cm2 were used as a substitute for the sample sheets in the background measurements.
Experiments were conducted in a closed natural atmosphere with an external air pressure of 102 020 Pa at room temperature. The relative humidity was kept between 90% and 93% during the wet cycles using a saturated Na2SO4 solution. Dry cycles were performed over silica gel resulting in a final relative humidity below 5% after 20 h of drying.
2.2 Experimental Setup
Mass spectrometric (MS) measurements were performed on an ESD 100 InProcess Instruments (IPI) quadrupole mass spectrometer (QMS). This instrument uses a single quadrupole mass filter providing a mass range of 1-100 amu. This very low mass range makes it especially useful for reaction monitoring of gas phase mediated reactions. Typical applications are listed in Table 2. The inlet system of the QMS consists of a quartz capillary, which is heated to 150 °C to avoid condensation on the capillaries inner walls. Gaseous analytes are guided through this capillary directly into the ion source of the QMS, where ions are produced by electron impact ionization. The capillary can be directly attached to a reaction chamber or an external measurement cell. The pressure inside the ion source was 3.26 · 10−4 Pa. Analytes are transferred via sub-pressure from the reaction cell through the heated capillary to the ion source. A customized and 3D printed reaction chamber was coupled to the mass spectrometer. The cell is described in more detail in subsection 3.1.
| Process | Detected species | m/z |
|---|---|---|
| Catalysis research | H2+ | 2 |
| Hydrogen release from metal hydrides | H2+ | 2 |
| He–D2 analysis | He+ D2+ | 4 4 |
| Exhaust gas analysis | NO2 (NO2+) SO2 (SO2+) CO2 (CO2+) H2O (H2O+) | 30 64 44 18 |
| Element and isotope specific detection | 13C, 15N | – |
Scanning Kelvin probe (SKP) measurements were performed on a device from Wicinski & Wicinski GbR using a 355 μm NiCr (90/10) tip. In order to enable SKP surface scans of the rough salt loaded and corroded sample surfaces, an optimum scan distance between tip and sample has to be determined in advance. Even though the SKP system used is equipped with an automatic height control plus topography acquisition, a rough surface can be problematic. If the distance between tip and sample is too small, a tip crash is highly probable for very rough surfaces with steep edges in the surface topography, as it is the case for salt deposits on metal surfaces. Additionally, stray capacitances can distort the potential acquisition.37 On the other hand, CPD measurement is most accurate at low tip-sample distances.38, 39 To be able to measure reliable CPD values, the dependency of the CPD on the tip-sample distance was determined, as can be seen in Figure 1. The change in CPD strictly follows a linear function up to 70 μm distance between sample surface and KP tip. At distance values above 70 μm the change in CPD does not follow a linear function anymore. Reliable qualitative statements on the electrochemical behavior of the sample surface cannot be given any longer. Experiments were performed at a distance of 26.5 μm, which was sufficient to avoid collision of KP tip and sample surface. At a distance of 26.5 μm the CPD is increased by 10 mV which is rather small compared with changes of 330 mV upon transfer of samples from dry-to-humid atmospheres during the actual corrosion experiments.
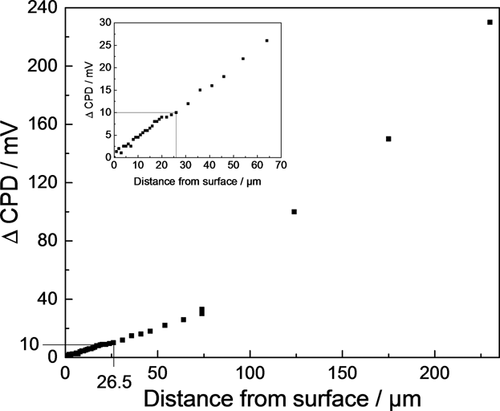
The SKP was calibrated at atmospheric conditions using a Cu/CuSO4 (saturated) electrode. Given potentials refer to the standard hydrogen electrode (SHE) scale. The SKP is installed in a closed chamber. Humidity inside the SKP chamber was adjusted by an automatic, software controlled climate system. In order to obtain dry conditions, the chamber was flushed with dry synthetic air (5.0, Linde). Higher humidity values were adjusted by evaporation of water from a water reservoir heated with a Peltier element.
3 Results and Discussion
3.1 Cell Design of the Reaction Chamber
A reaction cell for in situ reaction monitoring was designed, which can be seen in Figure 2. The cell can be coupled with a QMS. The cell is specifically designed to measure oxygen consumption rates during atmospheric corrosion processes. The cell was 3D printed on a Replicator 2× (MakerBot) using an acrylic butadiene styrene (ABS) filament. By slightly modifying cell body design and material, this cell is also applicable in other fields, where gas phase mediated reactions are relevant e.g., catalysis research,34 combustion, or isotope studies (cf. Table 2). For aggressive and hot media, it is recommended to change the body material to high quality steel or titanium. If used for monitoring of combustion reactions, the chamber temperature should be regulated to compensate for large temperature changes.
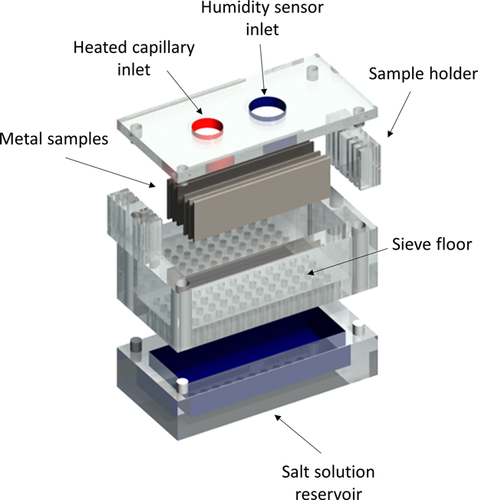
The body of the cell consists of four main parts, which can easily be disassembled and exchanged. All connections are realized as plug type connectors for a fast replacement before and during the measurements. The bottom part of the cell serves as a reservoir for saturated salt solutions. As listed in Table 3, the humidity can easily be adjusted over a wide range by saturated salt solutions 40-42 and silica gel.
| Salt | Relative humidity [%]a) |
|---|---|
| MgCl2 | 32.78 ± 0.16 |
| K2CO3 | 43.16 ± 0.39 |
| Mg(NO3)2 | 52.89 ± 0.22 |
| NaNO3 | 74.25 ± 0.32 |
| NaCl | 75.29 ± 0.12 |
| (NH4)2SO4 | 80.99 ± 0.28 |
| KCl | 84.34 ± 0.26 |
| Na2SO4 | 93.0 ± not available |
- a) Equilibrium relative humidity at 25 °C of the saturated salt solution.
A sieve floor with 48 holes with a diameter of 2 mm each is attached directly on top of the bottom part of the cell. The number of holes must be high enough to keep the relative humidity constant but must not be too small to avoid capillary effects. Two sample holders can be inserted in the sieve floor to guarantee a constant distance between the steel sheets and to adjust the heated MS capillary in the center of the cell without getting damaged or touching the sample surface. A lid with two holes is placed on top to seal the chamber. The larger inlet is used to connect the humidity/temperature sensor (USB Datalogger UTDL 10 (ELV)). The MS capillary is plugged into the second opening of the top side. For easier handling the end of the capillary is placed in a conical PTFE connector. It is important that the chamber is closed hermetically using rubber seals as the mass spectrometer reacts very sensitive to external pressure changes. The ratio of sample surface to chamber volume has to be maximized to yield relatively large signal changes at the detector. The sample holder is designed to be able to place six steel sheets each with a size of 2 × 7 cm2 and a maximum thickness of 1.5 mm simultaneously inside the cell. The joints of the sample holder are filled with neutral cross-linking silicone to avoid accumulation of water between sample and sample holder due to capillary effects in humid atmospheres. Therefore, the surface area of 168 cm2 is slightly reduced to 163.2 cm2 due to coverage of the sample edges by the sample holder. This gives a total sample surface of 163.2 cm2 compared to a relatively small chamber volume of only 144 cm3. An average atmospheric height of 0.30 cm can be calculated above the sample surface taking into account the volume reduction by the sample holders and considering only the top part of the cell being filled with air.
3.2 Oxygen Consumption During Wet/Dry Cycles of Zinc
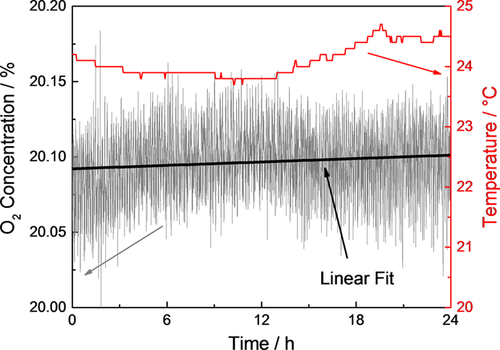
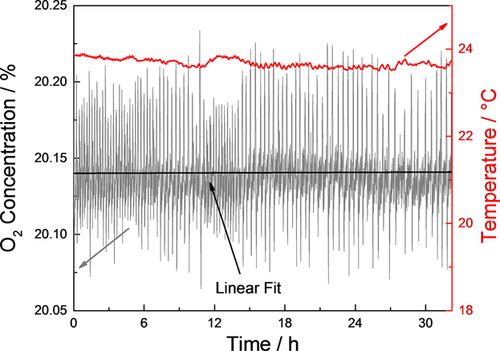
The oxygen consumption during the atmospheric corrosion of sea salt loaded zinc surfaces was investigated. After 24 h pre-run the O2 concentration signal of the mass spectrometer was monitored in a humid atmosphere as can be seen in Figure 3. The signal was monitored for at least 18 h to obtain an average value which is temperature independent as the temperature changes by approx. ±0.5 °C during 24 h (day and night). The signal changes were fitted by a linear fit, which was further used for background correction.
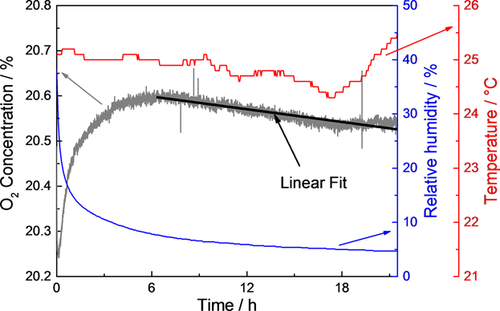
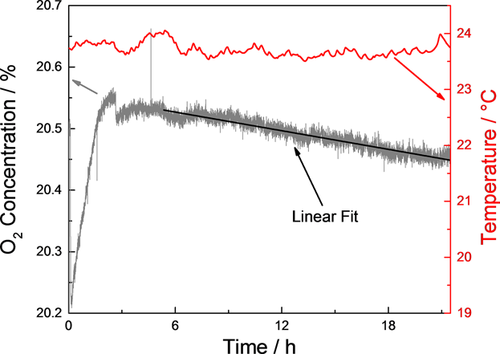
Another background signal was collected during the dry cycle, which can be seen in Figure 4. This time, the background fitting function was measured already 7 h after starting the drying process as the atmospheric corrosion especially takes place during the initial drying process. Moreover, during the first 7 h the relative humidity is still decreasing and therefore, no stationary conditions, which are necessary for a background determination, are available.
The oxygen consumption of electrolytically deposited zinc layers was investigated during wet (Figure 5) and dry (Figure 6) cycles. Atmospheric conditions were identical during background and sample measurements.
On zinc surfaces the following corrosion product classes are frequently reported: metal oxides and hydroxides,2, 5, 9, 10, 14, 16, 17, 19, 43, 44 sulphides,17, 43 sulphites,17, 43 sulphates,2, 9, 17, 43, 44 chlorides,2, 5, 7, 9, 14, 16, 17, 19, 23, 43, 44 carbonates,2, 7, 9, 14, 16, 17, 19, 23, 43 and nitrates.43 Which species are formed strongly depends on the specific reaction conditions. A typical corrosion product formation sequence on zinc in neutral chloride/CO2 containing environments45 as present during the studies in this work (cf. Table 1) includes the formation of a thin natural ZnO/Zn(OH2) layer within seconds. Hydrozincite (Zn5(OH)8Cl2 · H2O) and simonkolleite (Zn5(OH)8Cl2 · H2O) are formed within hours/days. According to other lab experiments46 it can be assumed that chlorides accelerate the dissolution of zinc underneath the oxidized zinc surface at the anodic sites whereas oxygen is reduced to OH− at the cathodic sites. Consequently, Zn2+ and Na+ ions will migrate toward the cathodic sites and Cl− as well as OH− migrate toward the anodic areas to maintain electroneutrality. Consequently, simonkolleite is formed (Equation 1) in the anodic regions and hydrozincite is formed (Equation 2) in the cathodic regions.23 Within months or even years mixed sulfate containing zinc salts would be formed in the presence of SO2. Sulfate formation may occur even during the early corrosion stages in highly SO2 polluted environments.
 (1)
(1) (2)
(2)Although different corrosion products may be formed on a zinc surface depending on the exact atmospheric conditions two reactions are always the basis for the formation of these products. The anodic dissolution of zinc (Equation 3) and the cathodic reduction of oxygen (Equation 4) which yields a Zn(OH)2 covered surface (Equation 5).
 (3)
(3) (4)
(4) (5)
(5)This means that the oxygen consumption rate can be used to calculate the current density on the sample surface (Equation 6) as well as the zinc consumption rate (Equation 7). The calculation of the current density enables a comparison with electrochemical measurements of the zinc corrosion rate.
 (6)
(6)j = Current density/μA cm−2
ks = Oxygen consumption rate/ %(O2) s−1
p = Cell pressure = 101 325 Pa
V = Cell volume = 0.000144 m3
R = Ideal gas constant (8.314459 J mol−1 K−1)
T = Temperature 297.15 K
zO2 = Electrochemical valence = 4 (see Equation 4)
F = Faraday constant (96485.33289 C mol−1)
A = Sample surface area = 0.01632 m2
 (7)
(7)ΔhZn = Annual zinc loss/μm y−1
ky = Oxygen consumption rate/%(O2) y−1
zZn = Electrochemical valence = 2 (see Equation. 3)
M = Molar mass of Zn (65.38 g mol−1)
ρZn = Zinc density (7.14 g cm−3)
The respective oxygen consumption rates during wet- and dry-cycles were determined using the values of the linear fit functions from Figure 3 to Figure 6, as presented in Table 4. The calculated current densities and annual zinc losses are listed in Table 5. Typical literature values range between 0.5 and 15 μm zinc loss per year depending on the exact weathering conditions.43, 44, 47 The zinc consumption rate that was found within this study (23.4 μm y−1) is higher than typical values in literature. This can be explained by the absence of a stable protective layer that is formed upon first exposures to sea salt.44, 48 Typically compounds like Zn5(OH)8Cl2 · H2O, Zn4(OH)6SO4 · nH2O (n = 3-5), ZnO, Mg,(OH),Cl but also CaO · Al2O3 · SiO2, phosphates and iron based compounds may form depending on the exact sea water composition.
| kO2/%O2 s−1 | |
|---|---|
| Wet cycle | |
| Background | +1.05 · 10−7 |
| Sample | −0.06 · 10−7 |
| Effective | −1.11 · 10−7 |
| Dry cycle | |
| Background | −13.05 · 10−7 |
| Sample | −14.00 · 10−7 |
| Effective | −0.94 · 10−7 |
During the drying phase (first 6 h after changing from humid to dry atmosphere) both background and sample measurement are strongly influenced by the decreasing relative humidity. Especially the background measurement is affected as can be seen in Figure 4. In these conditions it is difficult to correlate background and sample signal appropriately due to these signal changes. Therefore, a calculation of the corrosion rate during this first part of the dry cycle with non-stationary conditions is problematic. The values for corrosion rate during the dry phase, presented in Table 4, are thus calculated under stable, dry atmospheric conditions.
3.3 SKP Measurements During Wet-/Dry-Cycles
In 1990 Stratmann et al.49 were the first to use non-scanning Kelvin probe for the investigation of the corrosion behavior during wet-/dry cycles. They were able to show the activation and deactivation of iron/copper alloy surfaces between wet- and dry-phases. In 2001 Williams et al.50 used scanning Kelvin probe to investigate filiform corrosion on coated aluminum alloys at elevated temperatures at high relative humidities. Since then also other groups23, 50, 51 have successfully applied SKP for the in situ investigation of atmospheric corrosion processes. Additional CPD measurements have been performed using SKP in this work to show the electrochemical state as well as changes on the sample surface during corrosion and especially during wet- and dry-phases.
A CPD map of the sample surface of 10 × 10 mm2 was measured after loading the sample with artificial sea salt and drying it in an inert atmosphere, which can be seen in Figure 7a. Further CPD mappings of the same area were recorded during 3 days of wet and 3 days of dry phase. The time needed for one measurement was approximately 5 h. Sample screening speed was limited by the surface roughness. An exemplary SKP scan after 40 h during the wet phase is shown in Figure 7b. An exemplary scan during the drying phase after 72 h in a wet atmosphere and further 10 h in a dry atmosphere is presented in Figure 7c. Drastic electrochemical changes were observed when exposing the sample to a wet atmosphere and subsequently to dry atmosphere which indicates an electrochemical activation and deactivation of the surface. The average CPD values of the 10 × 10 mm2 area are plotted against time as shown in Figure 8. At 0 h the sample was measured in a dry atmosphere. It can be seen that transfer from a dry to a humid atmosphere leads to an activation of the salt loaded zinc surface: the average CPD changes from −0.10 to −0.43 V. During the wet phase, the CPD steadily decreases down to −0.59 V. After 3 days, a dry atmosphere was adjusted. At this point, the mean CPD rises strongly to −0.26 V until the CPD decreases further 3 days to −0.36 V until it rises again slowly. The more negative CPD (−0.26 to −0.36 V) during the drying phase compared to the initial mean CPD (−0.10 V) supports recent literature results that substantial corrosion may also take place during the drying phase.52-55 Schindelholz et al.54 reported that at a low relative humidity (rH) of 23% corrosion of steel sustained. A significant increase in conductance of artificial sea water deposits was measured down to <2 % rH even after 24 h. It is suggested that this is due to fluid trapping and because of the formation of metastable MgCl2 hydrates. The CPD during the drying phase is still significantly higher compared to the wet cycle indicating a deactivation of the surface after changing the atmospheric conditions.
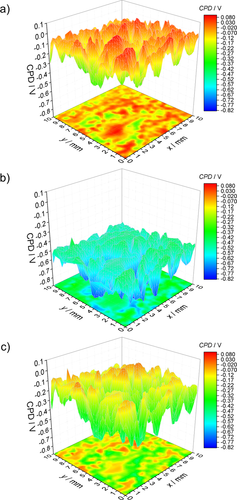
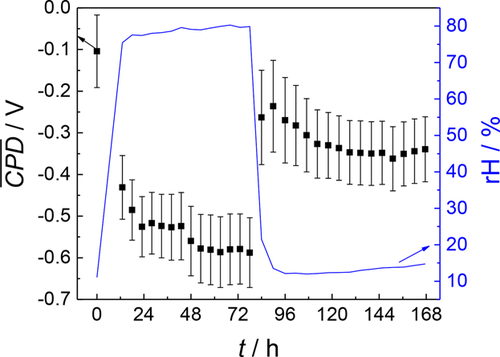
As can be seen in Figures 7 and 8 the CPD varies strongly within a surface scan. This can be deduced to the existence of cathodic areas of oxygen reduction (higher CPD values) and anodic areas of metal dissolution (lower CPD values). In accordance with other studies46 these cathodic and anodic sites are strongly localized and do not change during the experiment. Many of these microelectrode areas are formed at the zinc surface.
4 Conclusion
In this work a reaction cell for coupling with a low mass range mass spectrometer for in situ reaction monitoring has been presented. The modular cell design that is presented within this paper is specifically adjusted for atmospheric corrosion studies. Due to its modular design it can easily be modified to meet the requirements in other fields of research such as catalysis research or investigation of combustion processes as well.
The atmospheric corrosion of artificial sea salt loaded zinc surfaces was investigated as a simple model reaction. Zinc consumption rates of 23 μm y−1 during the first wet cycle and of 20 μm y−1 during the first dry cycle were calculated. It is expected that the corrosion rate will further decrease during the dry cycle when the salt deposits are completely dry.
Additional contact potential difference measurements were performed on the rough, salt loaded zinc surfaces in humid- and dry conditions to emphasize the drastic electrochemical changes at the sample surface during corrosion especially when changing the atmosphere from dry to humid and vice versa. The existence of many localized microelectrode cathodic as well as anodic areas of oxygen reduction and metal dissolution was shown using SKP. To be able to perform SKP studies on very rough, salt loaded sample surfaces, the maximum measurement distance was investigated at which the CPD still follows a linear function. A maximum measurement distance of 70 μm was determined for a 355 μm CrNi needle to still be able to study rough salt loaded sample surfaces. At larger tip-sample distances the CPD does not follow a linear function any longer.
Acknowledgements
The financial support within the Comet Programme given by the Austrian Government via FFG (Austrian Research Foundation Agency) and by the Government of Lower Austria and Upper Austria are gratefully acknowledged. A.W.H. and C.K. acknowledge a special research grant for the low-mass mass spectrometer from the government of Upper Austria.
Conflict of Interest
The authors declare no conflict of interest.


