Histopathologic Features and Transcriptomic Signatures Do Not Solve the Issue of Magnetic Resonance Imaging-Invisible Prostate Cancers: A Matched-Pair Analysis
ABSTRACT
Background
Multiparametric magnetic resonance imaging (mpMRI) is pivotal in prostate cancer (PCa) diagnosis, but some clinically significant (cs) PCa remain undetected. This study aims to understand the pathological and molecular basis for csPCa visibility at mpMRI.
Methods
We performed a retrospective matched-pair cohort study, including patients undergoing radical prostatectomy (RP) for csPCa (i.e., ISUP grade group ≥ 2) from 2015 to 2020, in our tertiary-referral center. We screened for inclusion in the “mpMRI-invisible” cohort all consecutive men (N = 45) having a negative preoperative mpMRI. The “mpMRI-visible” cohort was matched based on age, PSA, prostate volume, ISUP grade group. Included patients underwent radiological and pathological open-label revisions and characterization of the tumor mRNA expression profile (analyzing 780 gene transcripts, signaling pathways, and cell-type profiling). We compared the clinical-pathological variables and the gene expression profile between matched pairs. The analysis was stratified according to histological characteristics and lesion diameter.
Results
We included 34 patients (17 per cohort); mean age at RP and PSA were 70.5 years (standard deviation [SD] = 7.7), 7.1 ng/mL (SD = 3.3), respectively; 65% of men were ISUP 2. Overall, no significant differences in histopathological features, tumor diameter and location, mRNA profile, pathways, and cell-type scores emerged between cohorts. In the stratified analysis, an upregulation of cell adhesion and motility, of extracellular matrix remodeling and of metastatic process pathways was present in specific subgroups of mpMRI-invisible cancers.
Conclusions
No PCa pathological or gene-expression hallmarks explaining mp-MRI invisibility were identified. Aggressive features can be present both in mpMRI-invisible and -visible tumors.
1 Introduction
In the last years, multiparametric magnetic resonance imaging (mpMRI) has become a key element in the diagnosis and staging of prostate cancer (PCa) [1]. Several randomized, controlled trials have demonstrated that mpMRI-targeted biopsies increase the detection of high-grade PCa while decreasing that of low-grade tumors, considered as clinically insignificant. Using mpMRI as a diagnostic tool allows to reduce the number of unnecessary biopsies and clinically insignificant cancers [2-4]. The usefulness of mpMRI is not into question. Nevertheless, despite its good performance, mpMRI is not foolproof.
A certain proportion of PCa remains invisible to mpMRI, even in high-volume centers with expert radiologists. In a consecutive series of 1042 patients undergoing template biopsy, the incidence of clinically significant PCa (csPCa) in men with negative mpMRI was reported at 12% [5]. When analyzing whole-mount prostatectomy specimens, the incidence of csPCa not seen on expertly read mpMRI was 28% [6]. In a study that evaluated the eligibility for focal therapy in men based on mpMRI and biopsy results as compared to histopathology from their radical prostatectomy (RP) specimens, significant cancer in biopsy- and mpMRI-negative lobes was found in 39% of 185 lobes, including one case with advanced stage [7]. We recently published the results of a multicentric study on 1.992 men undergoing MRI-targeted, elastic fusion biopsy, showing that 710 had positive findings outside mpMRI targets, of which 58% were clinically significant [8].
To date, the reason why some high-grade tumors are missed by mpMRI is still unknown. In the recent past, there has been an increased drive to better understand the nature of mpMRI-invisible disease, particularly at the molecular level [9, 10]. It has been hypothesized that mpMRI visibility of individual tumors is driven by specific genomic features, with high PI-RADS tumors preferentially harboring molecular hallmarks of aggressiveness [11]. It has been suggested that mpMRI visibility might result from a dysregulation of multiple patterns, including noncoding transcripts [12].
Starting from the hypothesis that both intrinsic tumor characteristics and the interplay with peritumoral microenvironment could shape mpMRI visibility, the aim of the present study is to further understand the histologic and molecular basis for tumor visibility, through a pathological and molecular evaluation of clinically significant mpMRI-invisible tumors as compared to mpMRI-visible ones.
2 Patients and Methods
2.1 Study Design
We retrospectively reviewed our institutional database to retrieve the records of patients with negative prebiopsy mpMRI diagnosed with csPCa at systematic biopsy. We retrieved 45 patients that underwent RP between 2015 and 2020. mpMRI was considered negative if no targets scored as PI-RADS ≥ 3 were detected. csPCa was defined as ISUP ≥ 2. After the exclusion of 15 patients with missing clinical, radiological and/or pathologic data, 30 patients were included in study. All RP were performed with the Da Vinci robot (Intuitive). The flow-chart of the study is shown in Supporting Information S1: Material 1.
The study was conducted according to the Helsinki Declaration and all patients signed an informed consent for clinical and pathological data collection. No formal ethical committee approval was needed according to the Agenzia Italiana del Farmaco—AIFA guidelines for observational studies.
2.2 mpMRI Revision
Pre-biopsy mpMRIs were performed using a 1.5-T or 3-T scanner, with or without an endorectal coil, and consisted of multiplane T1- and T2-weighted imaging, diffusion-weighted imaging (DWI), and dynamic contrast enhancement according to the European Society of Urogenital Radiology guidelines [13]. The 30 negative mpMRIs were reviewed by two experienced radiologists (M. G. and R. F., with > 1000 prostate mpMRI readings) and scored using the PI-RADS v.2 or 2.1 protocols [14]. After revision, 11 patients were excluded for the presence of at least one area scored as PI-RADS ≥ 3.
2.3 Pathological Revision
Histopathological features of RP specimens were collected from pathological reports and the slides were reviewed by two experienced pathologists (L. B. and E. V.), following the International Society of Urological Pathology standards [15]. After pathological revision, two more cases were excluded due to a very small tumor volume (diameter < 3 mm) that would have hampered the histopathological evaluation and the gathering of sufficient tissue for molecular analysis.
Histopathological features of interest were: tumor grade, tumor stage, presence of positive surgical margins, perineural invasion and high-grade prostatic intraepithelial neoplasia (HG-PIN), diameter and location of the main tumor node (as a surrogate of tumor volume), foamy cells component (defined by a cut-off of > 10% of the tumor volume), glomeruloid/cribriform pattern, extracapsular extension, involvement of seminal vesicle, and percentage of pattern 4.
2.4 Gene Expression Profiling
Two 10-μm-thick formalin-fixed, paraffin-embedded (FFPE) tissue sections were obtained from each tissue block, and the tumor tissue was collected in a sterile Eppendorf tube. Multiplex gene expression profiling was performed to characterize the tumoral transcriptome and provide a molecular evaluation of the tumoral microenvironment. To do so, we chose the nCounter Tumor Signaling 360 Panel that detects the expression of 780 messenger RNA (mRNA) targets: 760 tumor-related genes and 20 housekeeping genes (Supporting Information S1: Material 2).
RNA isolation was performed using the FFPE RNA Isolation Kit (Roche Diagnostics GmbH), according to the manufacturer's protocols. Total RNA concentration was assessed using a NanoDrop spectrophotometer (Thermo Fisher Scientific Inc.). NanoString nCounter technology was used to measure relative expression levels of genes related to the biology of the tumor, microenvironment, and immune response: 300 ng of total RNA from each sample were hybridized to the nCounter Tumor Signaling 360 Panel, according to the manufacturer's instructions (NanoString Technologies).
The analyses were set up according to the protocol provided by the manufacturer. Expression data were normalized and analyzed with the nSolver Analysis Software (version 4.0.62). For background correction, the mean count of negative controls plus 2 times the standard deviation (SD) was subtracted from the counts for each gene. The means of the supplied positive controls and the geometric mean of the housekeeping genes were used to normalize the measured expression values. Both positive and negative controls were included in the panel, according to the manufacturer's instructions. Additionally, the Advanced Analysis module (version 2.0.115) was used to perform differential expression analyses. Briefly, by the differential expression analysis tool (nSolver Advanced Analysis module), for each gene, a single linear regression was fit using all selected covariates to predict expression. A volcano plot was generated to display each gene's −log10 (p value) and log2 fold change with the selected covariate. Highly statistically significant genes fell at the top of the plot above the horizontal lines, and highly differentially expressed genes fell to either side. Horizontal lines indicated various p value thresholds. In addition, using the nSolver Advanced Analysis module, we performed Pathway score analysis genes as well as Cell Type Profiling. Pathway Score Module combined genes associated to same pathway, determining their activation level, within the analyzed subgroups. Cell Type Profiling Module used genes described as characteristic of various cell populations to measure these populations' abundance.
2.5 Statistical Analyses
Statistical analysis of clinical, radiological, and histopathological data was performed with SPSS version 28.0 (IBM Corp.). Continuous data were reported as means and SD and categorical parameters were shown as counts/percentages. Mann–Whitney U, Wilcoxon's rank test, and Pearson's χ2 tests were used when appropriate to compare continuous and categorical variables. Statistical significance was set at two-sided p < 0.05.
Statistical analyses of gene expression profiling were carried out using GraphPad Prism software (version 9.4.0 for MacOS, GraphPad Software, www.graphpad.com). The differences in the distribution of the variables evaluated based on clinical-pathological parameters were analyzed using parametric and non-parametric tests (Pearson's χ2 test, Wilcoxon's rank test). Raw data from Cell Type Profiling and Pathway Score analyses were statistically evaluated using Mann–Whitney Test with a p value of 0.05 as relevant.
2.6 Case-Control Matching
Case–control matching was performed to find a comparable cohort of 17 prebiopsy mpMRI-visible cases from the same RP database. The matching was performed with SPSS version 28.0 (IBM Corp) using the following variables: age at RP, PSA, prostate volume at mpMRI, ISUP grade at biopsy, and RP (Supporting Information S1: Material 3).
All patients in the mpMRI-visible cohort had a positive pre-biopsy mpMRI (scored as PI-RADS ≥ 3) and a prostate biopsy positive for csPCa on mpMRI targets. RPs were performed in the same timeframe of the mpMRI-invisible cohort.
3 Results
3.1 Characteristics of mpMRI-Visible and mpMRI-Invisible Cohorts
After radiological and pathological revision, we included 17 patients with csPCa and negative prebiopsy mpMRI (“mpMRI-invisible cohort,” see Figure 1), matched to 17 patients with csPCa and positive prebiopsy mpMRI (“mpMRI-visible cohort”).
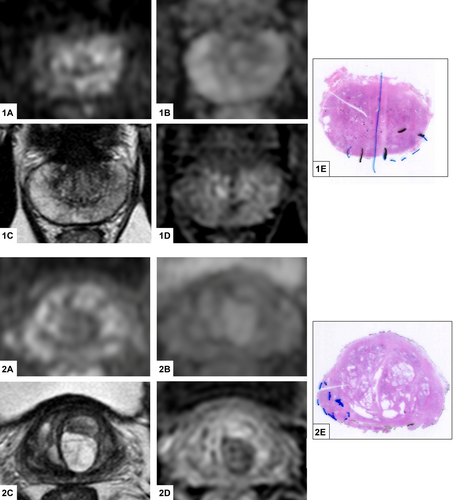
Clinical, radiological, and histopathological features of the two cohorts are shown in Table 1. No statistical differences were observed between the two cohorts, because of the matching strategy. At a median follow-up of 37 months (IQR 25–50 months), no significant differences in terms of oncological outcomes were observed between the two cohorts: three patients per cohort experienced biochemical recurrence and no patients died for PCa.
| Overall | mpMRI-invisible cohort | mpMRI-visible cohort | p value | |
|---|---|---|---|---|
| Age at RP, years, mean (SD) | 70.47 (7.68) | 71.24 (7.29) | 69.71 (8.19) | 0.70 |
| PSA at RP, ng/mL, mean (SD) | 7.1 (3.3) | 7.3 (3.3) | 6.9 (3.3) | 0.86 |
| PSA density at RP, mean (SD) | 0.21 (0.15) | 0.23 (0.18) | 0.19 (0.11) | 0.44 |
| Multiparametric MRI | ||||
| Prostate volume at mpMRI, cc, mean (SD) | 41.7 (18.9) | 41.0 (21.3) | 42.3 (16.8) | 0.61 |
| PI-RADS v 2.1, n (%) | — | |||
|
— | — | 2 (12) | |
|
— | — | 11 (64) | |
|
— | — | 4 (24) | |
| Target location, n (%) | — | |||
|
— | — | 14 (76) | |
|
— | — | 1 (6) | |
|
— | — | 3 (18) | |
| Target diameter, mm, median (range) | — | — | 10 (5–23) | — |
| Prostate biopsy | ||||
| Timeframe from mpMRI to biopsy, mo, mean (SD) | 2.1 (1.0) | 2.3 (1.2) | 1.8 (0.8) | 0.32 |
| ISUP grade at biopsy, n (%) | 0.73 | |||
|
2 (6) | 1 (6) | 1 (6) | |
|
22 (65) | 11 (65) | 11 (65) | |
|
8 (29) | 4 (23) | 4 (23) | |
|
1 (3) | 0 (0) | 1 (6) | |
|
1 (3) | 1 (6) | 0 (0) | |
| Radical prostatectomy | ||||
| Timeframe from mpMRI to RP, mo, mean (SD) | 5.4 (1.8) | 5.8 (1.8) | 5.1 (1.7) | 0.24 |
| ISUP grade at RP, n (%) | 0.74 | |||
|
22 (65) | 11 (65) | 11 (65) | |
|
10 (29) | 5 (29) | 5 (29) | |
|
1 (3) | 0 (0) | 1 (6) | |
|
1 (3) | 1 (6) | 0 (0) | |
| Primary Gleason pattern, n (%) | 1 | |||
|
22 (65) | 11 (65) | 11 (65) | |
|
12 (35) | 6 (35) | 6 (35) | |
| pT stage, n (%) | 0.15 | |||
|
6 (18) | 2 (12) | 2 (24) | |
|
23 (68) | 13 (76) | 10 (58) | |
|
3 (9) | 0 (0) | 3 (18) | |
|
2 (6) | 2 (12) | 0 (0) | |
| Extracapsular extension, n (%) | 5 (15) | 2 (12) | 3 (18) | 0.63 |
| Seminal vesicle invasion, n (%) | 2 (6) | 2 (12) | 0 (0) | 0.15 |
| Laterality of PCa, n (%) | 0.65 | |||
|
6 (18) | 2 (12) | 4 (24) | |
|
28 (82) | 15 (88) | 13 (76) | |
| Tumor location at RP, n (%) | 0.50 | |||
|
18 (53) | 10 (59) | 8 (47) | |
|
14 (41) | 6 (35) | 8 (47) | |
|
2 (6) | 1 (6) | 1 (6) | |
| Perineural invasion, n (%) | 28 (82) | 14 (82) | 14 (82) | 1 |
| Positive surgical margins, n (%) | 6 (18) | 3 (18) | 3 (18) | 1 |
| Presence of HGPIN, n (%) | 31 (91) | 16 (94) | 15 (88) | 0.55 |
| Tumor diameter (main node), mm, median (range) | 12 (3–35) | 11 (5–35) | 12 (3–25) | 0.30 |
| Tumor diameter (main node), mm, n (%) | 0.30 | |||
|
15 (44) | 9 (53) | 6 (35) | |
|
19 (66) | 8 (47) | 11 (65) | |
| Foamy cell component, n (%) | 11 (32) | 5 (29) | 6 (35) | 0.71 |
| Glomeruloid/cribriform pattern, n (%) | 9 (26) | 4 (24) | 5 (29) | 0.70 |
| Oncological follow-up | ||||
| Biochemical recurrence, n (%) | 6 (18) | 3 (18) | 3 (18) | 1 |
| Biochemical recurrence-free survival, months, median (95% CI) | 66.2 (52.4–80.0) | 58.4 (49.7–67.1) | 69.3 (52.0–86.7) | 0.72a |
| 3-years biochemical recurrence-free survival | 87% | 83% | 93% | 1b |
| Cancer-specific deaths, n (%) | 0 (0) | 0 (0) | 0 (0) | 1 |
| 3-years cancer-specific survival survival | 100% | 100% | 100% | — |
- Abbreviations: CI, confidence interval; HGPIN, high-grade prostatic intraepithelial neoplasia; ISUP GG, International Society of Urological Pathology; mpMRI, multiparametric magnetic resonance imaging; PI-RADS, Prostate Imaging Reporting & Data System; RP, radical prostatectomy.
- a Log-rank.
- b Wilcoxon.
3.2 Histopathological Features
In the mpMRI-invisible cohort, all cancers were located in the peripheral zone at biopsy. In the mpMRI-visible cohort, most targets were located in the peripheral zone (76%) and had a median target diameter of 10 mm; all targets were diagnosed as csPCa and no contralateral tumor was detected at systematic mapping.
At RP, most cancers were bilateral in both groups, being 15/17 mpMRI-invisible and 13/17 mpMRI-visible cases. Two mpMRI-invisible patients presented seminal vesicle invasion (pT3b), whereas three mpMRI-visible cases had extracapsular extension (pT3a). Presence of HG-PIN was noted in almost all cases among the cohorts. Histopathological features of aggressiveness were comparable in both groups, with no significant differences in main tumor diameter (median 11 vs. 12 mm, p 0.30), foamy cells component (29% vs. 35%, p 0.71), or glomeruloid/cribriform pattern (24% vs. 29%, p 0.70). ISUP grades were similarly distributed, with an equal number of ISUP 2 (65% each) and 3 (29%). One ISUP 4 was mpMRI-visible and one ISUP 5 was mpMRI-invisible.
3.3 Molecular Comparison Between mpMRI-Invisible and mpMRI-Visible
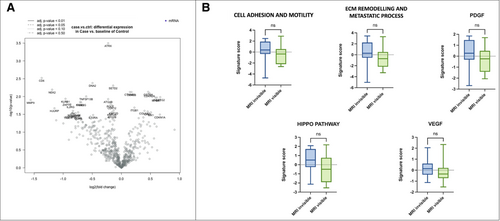
All samples were analyzed by applying a wide panel of genes involved in well-known oncogenic pathways and in tumor microenvironment modulation. The general comparison between the mpMRI-invisible and mpMRI-visible cohorts showed no differences in mRNA expression profile (including PTEN), pathways, and cell type score analyses.
However, we observed a trend toward the differential expression of some genes involved in metastatic and invasive processes, increased mRNA levels of COL6A2 and MYL9 and downregulation of MMP9 (Figure 2).
3.4 Molecular Analysis of the Two Cohorts Stratified for Factors Related to PCa Aggressiveness
Since the general comparison between the two cohorts did not show any differences, we compared mpMRI-invisible and mpMRI-visible stratifying for histopathological features of aggressiveness: primary pattern, glomeruloid/cribriform growth pattern, foamy cells, and tumors diameter.
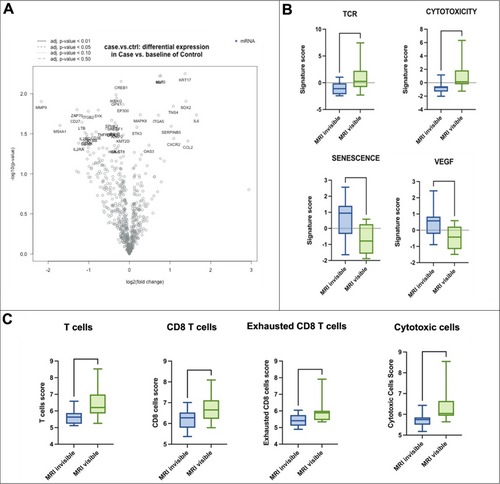
In the subgroup of primary pattern 3 tumors, no differences in the gene expression profile were noted. However, functional pathways analyses and cell type profiling showed an upregulation of the pathways related to T-cell receptor activation (p = 0.04) and cytotoxicity (p = 0.002) in the mpMRI-visible cohort, whereas an upregulation of the pathways related to senescence (p = 0.01) and VEGF (p = 0.02) was seen in the mpMRI-invisible cohort. These data are corroborated by the cell type profiling analysis, which showed again the upregulation in mpMRI-visible of T Cells (p = 0.01), CD8 T Cells (p = 0.04), exhausted CD8 T cells (p = 0.02) and cytotoxic cells (p = 0.002) (Figure 3). No such differences were noted in the subgroup of primary pattern 4 tumors.
In the subgroup of csPCa with the presence of a glomeruloid/cribriform growth pattern, the gene expression profile did not highlight any differences. Nevertheless, pathway score analysis showed an upregulation of signatures related to cell adhesion and motility (p = 0.031) in the mpMRI-invisible cohort (Figure 4A). No such differences were noted comparing the subgroups characterized by the absence of glomeruloid/cribriform growth pattern.
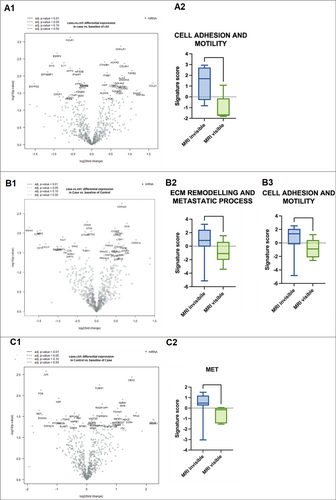
In the subgroup with foamy cell component, no differences in gene expression, pathway score, or cell type profiling were noted. Instead, the subgroup without foamy cells component showed the upregulation of cell adhesion and motility (p = 0.01) and extracellular matrix (ECM) remodeling and metastatic process (p = 0.03) pathways in mpMRI-invisible tumors (Figure 4B).
Stratifying the two cohorts for tumor diameter < 12 mm, we observed in the mpMRI-invisible group a trend of higher expression of genes involved in the metastatic process, such as JUN, FOS, HGF, and RET, as well as the upregulation of MET pathway (p = 0.01) (Figure 4C). No differences were observed in the subgroup of tumors ≥ 12 mm.
4 Discussion
A csPCa completely invisible at mpMRI is a rare but real entity, so much that current European guidelines recommend a systematic prostate biopsy when clinical suspicion of PCa is high, even if the mpMRI is negative [1]. To date, the reason of mpMRI-invisibility in clinically significant tumors, defined by ISUP grade ≥ 2, is still unknown. It has been hypothesized that mpMRI-visibility of PCa might be related to pathological, molecular, and microenvironmental features of aggressiveness [12].
In 2019, Houlahan et al. profiled the genomes and transcriptomes of 40 ISUP grade 2 tumors (20 mpMRI-visible and 20 mpMRI-invisible), finding that mpMRI-visible tumors were enriched in aggressive hallmarks, including genomes with increased mutation density, a higher prevalence of intraductal carcinoma/cribriform architecture pathology, and altered abundance of 102 transcripts, including overexpression of noncoding RNAs such as SCHLAP1. According to these findings, a confluence of aggressive molecular and microenvironmental phenomena should underlie mpMRI visibility of localized PCa [12]. In line with these findings, a systematic review by Norris et al. reported that mpMRI-visible cancers tend toward enrichment of molecular features of increased aggressivity, including phosphatase and tensin homolog (PTEN) loss and genomic classifier scores [16]. More recently, Lehto and colleagues studied 45 RP patients with ISUP grades 2–3 including 15 with mpMRI-invisible lesions, and proved that MRI-visible csPCa harbor more aggressive histomic and transcriptomic features than mpMRI-invisible cancers [17].
Nevertheless, the debate on the characteristics associated to mpMRI visibility of csPCa is still open. Parry and colleagues performed a multicore analysis of six RP samples with whole-genome, exome, methylation, and transcriptomic profiling. Of 22 tumor cores, 6 were mpMRI-invisible and 3 of them harbored one or more genetic alterations commonly observed in metastatic castration-resistant PCa. Intratumor genomic, epigenomic, and transcriptomic heterogeneity was found within mpMRI-visible lesions, and addressed to the conclusion that a negative mpMRI may miss csPCa harboring dangerous genetic alterations [18]. Similarly, the analysis of 331 RP cases with negative mpMRI proved that they harbor comparable oncological outcomes as mpMRI-visible tumors, in terms of csPCa rates, positive surgical margins, and biochemical recurrence rates [19].
In the present study, we analyzed the histopathologic features and the transcriptomic signatures of a series of mpMRI-invisible csPCa, looking for some distinctive differences with similar mpMRI-visible tumors. The case–control matching allowed to correctly balance the two cohorts, differently from aforementioned studies [11, 12]. Among the strengths of our study there is the radiological revision of images that ruled out falsely negative invisible cases. Due to the revision by two expert radiologists, 11 cases were excluded for the presence of at least one area scored as PI-RADS ≥ 3. Furthermore, the pathologic revision guaranteed the correct attribution of the ISUP score and studied histopathological features that might be involved in the mpMRI visibility, such as stage, tumor size, foamy component, or glomeruloid/cribriform pattern. Interestingly, all the histopathological features were comparable between visible and invisible cancers. Similar to our findings, Mikoshi et al. had shown a similar distribution of intraductal or cribriform variants between MRI-detectable and -undetectable csPCa. On the contrary, mpMRI-detectable cancers were significantly larger than undetectable ones, whereas no such difference was found in our study. According to the results of Mikoshi and colleagues, the mpMRI detectability of csPCa is strongly associated with the relative area fractions of cancer cells, stroma, and luminal spaces rather than conventional histopathological parameters [20]. Van Houdt and colleagues analyzed 34 patients scheduled for RP, finding that invisible regions on mpMRI have lower tumor density, heterogeneous tumor morphology, and are typically located in the transitional zone [21]. Our study contradicts these results, showing several cases of MRI-invisible csPCa with high grade and peripheral location.
As for gene expression profiling, Multiplex gene expression profiling was performed to characterize the tumoral transcriptome using the nCounter Tumor Signaling 360 Panel that evaluates the expression of 780 mRNA targets: 760 tumor-related genes and 20 housekeeping genes (Supporting Information S1: Material 2). This panel was selected since it allows to assess signatures related to both tumor functions and microenvironment remodeling enabling to test our hypothesis that visibility on MRI could be related to intrinsic tumor and/or microenvironment characteristics.
In our analysis, we did not find any significant differences in mRNA profiles or pathways scores. However, stratification for the studied histopathological features revealed some differences. First, an upregulation of the pathways related to cell adhesion and motility, and to the ECM remodeling and metastatic process was evident in the mpMRI-invisible cohort. ECM is a crucial component of the metastatic niche and enzymes involved in its remodeling, such as MMP [22], affect cancer spreading and tumor angiogenesis. These findings highlight the potential aggressiveness of mpMRI-invisible csPCa and are in contrast with those published by Lehto et al., who showed that mpMRI-visible csPCa harbor more aggressive histomic and transcriptomic features than mpMRI-invisible ones, reflecting in a poorer prognosis [17]. It is important to highlight that we focused on totally invisible clinically significant cancers stratified for specific histopathological features, whereas Lehto and colleagues enrolled 15 patients based on having at least one mpMRI-invisible csPCa lesion, but they were allowed to have 0–3 mpMRI-visible lesions. Totally invisible cancers might behave very differently from those who harbor contemporarily visible and invisible ISUP ≥ 2 lesions, representing roughly 33% of cases as we showed in a recent publication [8]. We believe that drawing conclusions on PCa behavior based on the comparison of visible and invisible PCa nodules in the same prostate might introduce a bias, as the prognosis is usually dictated by the worst nodule found in the prostate. Second, our paired-matched analysis does not confirm the smaller size of the invisible lesions as compared to the visible ones, nor the histological components closer to benign tissue than cancer. Third, Letho and colleagues identified cell division, inflammation, and transcriptional regulation pathways upregulated in mpMRI-visible csPCas, whereas our study observed differentially expressed genes and functional pathways involved in metastatic and invasive processes in the mpMRI-invisible cohort, in more than one stratification (absence of foamy cells and tumor diameter < 12 mm). Analyzing csPCa with a primary pattern 3 we highlighted the upregulation of pathways related to T-cell receptor activation and cytotoxicity in the mpMRI-visible cohort, thus linked to immune response and inflammation. Overall, we did not observe differences in PTEN expression levels. Li and colleagues had previously identified a set of four genes (PHYHD1, CENPF, ALDH2, GDF15) that predict mpMRI visibility, progression-free survival, and metastatic disease, but we were not able to test them as these genes were not included in our panel [11].
One final aspect to be commented on is related to the oncological outcomes, that were comparable between our two cohorts. Considering the limited follow-up of the study, three biochemical recurrences were found in each group and no significant differences were noted to date.
Among the limitations of study, we acknowledge the small sample size as a reflex of the rarity of totally mpMRI-invisible csPCa, the short follow-up, and the use of a targeted panel for transcriptomic analysis that nevertheless included 760 tumor-related genes. Furthermore, the cohort in study is not representative of the whole population of csPCa, having included only patients with clinical suspicion of PCa, such as abnormal PSA levels or DRE findings. Finally, subgroup analyses conducted after matching might be affected by overfitting.
We strongly believe that totally mpMRI-invisible csPCa is an entity not to be underestimated and the present study confirms the need for a systematic mapping of the prostate when the clinical suspicion of PCa is high, notwithstanding a negative mpMRI. Therefore, mpMRI-invisible ISUP ≥ 2 PCas should be treated the same as mpMRI-visible ones, since they share similar molecular features of aggressiveness.
5 Conclusions
The mpMRI-invisibility of certain csPCas cannot be elucidated by means of specific histopathological features or gene expression profiles. Histopathological and transcriptomic features of aggressiveness can be found both in mpMRI-invisible and -visible tumors, which are therefore attributable to a unique continuum and amenable to similar management.
Author Contributions
Study design: Marco Oderda, Giancarlo Marra, Paola Cassoni, and Paolo Gontero. Data acquisition: Alessandro Marquis, Elena Vissio, and Marco Gatti. Imaging review: Riccardo Faletti and Marco Gatti. Pathology review: Irene Ruggirello, Elena Vissio, Paola Cassoni, and Giulia Orlando. Gene expression analysis: Luca Bertero, Giulia Orlando, and Luca Mangherini. Analyzing data: Luca Bertero, Marco Oderda, and Luca Mangherini. Drafting the manuscript: Marco Oderda, Giorgio Calleris, Alessandro Marquis, Luca Bertero, and Marco Gatti. Manuscript revision for important intellectual content: Marco Oderda, Alessandro Marquis, Luca Bertero, Giorgio Calleris, Riccardo Faletti, Marco Gatti, Luca Mangherini, Giulia Orlando, Giancarlo Marra, Irene Ruggirello, Elena Vissio, Paola Cassoni, and Paolo Gontero.
Acknowledgments
The present project was supported by a grant of “Rete Oncologica Piemonte e Valle d'Aosta.” Open access publishing facilitated by Universita degli Studi di Torino, as part of the Wiley - CRUI-CARE agreement.
Ethics Statement
The study was conducted according to the Helsinki Declaration and all patients signed an informed consent for clinical and pathological data collection. No formal ethical committee approval was needed according to the Agenzia Italiana del Farmaco—AIFA guidelines for observational studies.
Conflicts of Interest
The authors declare no conflicts of interest.
Open Research
Data Availability Statement
The data that support the findings of this study will not be published in a repository and are available from the corresponding author, M.O., upon reasonable and motivated request.


