Prostate cancer cells demonstrate unique metabolism and substrate adaptability acutely after androgen deprivation therapy
Mikolaj J. Filon and Amani A. Gillette contributed equally to this study.
Abstract
Background
Androgen deprivation therapy (ADT) has been the standard of care for advanced hormone-sensitive prostate cancer (PC), yet tumors invariably develop resistance resulting in castrate-resistant PC. The acute response of cancer cells to ADT includes apoptosis and cell death, but a large fraction remains arrested but viable. In this study, we focused on intensively characterizing the early metabolic changes that result after ADT to define potential metabolic targets for treatment.
Methods
A combination of mass spectrometry, optical metabolic imaging which noninvasively measures drug responses in cells, oxygen consumption rate, and protein expression analysis was used to characterize and block metabolic pathways over several days in multiple PC cell lines with variable hormone response status including ADT sensitive lines LNCaP and VCaP, and resistant C4-2 and DU145.
Results
Mass spectrometry analysis of LNCaP pre- and postexposure to ADT revealed an abundance of glycolytic intermediates after ADT. In LNCaP and VCaP, a reduction in the optical redox ratio [NAD(P)H/FAD], extracellular acidification rate, and a downregulation of key regulatory enzymes for fatty acid and glutamine utilization was acutely observed after ADT. Screening several metabolic inhibitors revealed that blocking fatty acid oxidation and synthesis reversed this stress response in the optical redox ratio seen with ADT alone in LNCaP and VCaP. In contrast, both cell lines demonstrated increased sensitivity to the glycolytic inhibitor 2-Deoxy- d-glucose(2-DG) and maintained sensitivity to electron transport chain inhibitor Malonate after ADT exposure. ADT followed by 2-DG results in synergistic cell death, a result not seen with simultaneous administration.
Conclusions
Hormone-sensitive PC cells displayed altered metabolic profiles early after ADT including an overall depression in energy metabolism, induction of a quiescent/senescent phenotype, and sensitivity to selected metabolic inhibitors. Glycolytic blocking agents (e.g., 2-DG) as a sequential treatment after ADT may be promising.
1 INTRODUCTION
Prostate cancer (PC) is the most commonly diagnosed malignancy in men and the second most prevalent cause of cancer-driven mortality, with an estimated 34,000 deaths projected for 2021.1 While low risk localized disease can be effectively treated, many patients with advanced symptomatic disease will go on to develop resistance to androgen deprivation therapy (ADT) and develop castrate-resistant prostate cancer (CRPC)2 with a median survival of ~42 months.3 ADT in murine xenografts and human PC tissues is associated with a decrease in the proliferative index, but surprisingly low levels of apoptosis.4, 5 ADT-treated cells continue to be metabolically active, despite cell cycle arrest, and adopt a senescent or quiescent phenotype.6 One underutilized therapeutic strategy that has the potential to improve patient outcomes involves eradicating these persistent cancer cells that remain after ADT, as they play a key role in the development of CRPC.
Metabolic targeting of advanced PC is an active area of investigation,7, 8 but the combination with ADT represents a unique approach to improve PC therapy. Recently, a number of common drugs targeting metabolic pathways (e.g., metformin, statins) have been tested in combination with ADT for PC, resulting in modest improvements in survival.9-12 However, though these drugs target specific molecules, for example, statins target HMG-CoA reductase in the mevalonate metabolic pathway, they also have significant off-target effects including decreasing mitochondrial respiratory capacity.13 Furthermore, different statins display variable results in the clinic, atorvastatin, for example, has been shown to be more effective than simvastatin in advanced PC patients treated with androgen deprivation.14 A better understanding of the metabolic vulnerabilities in PC cells in the initial period after ADT will facilitate improvements in ADT combination treatments that target specific metabolic pathways.
Unlike many malignancies, PC does not demonstrate the Warburg effect, which is the preference to convert glucose to lactate to meet anabolic demands despite the presence of oxygen. In contrast, benign prostate tissue relies on aerobic glycolysis for energy generation and Warburg metabolism is present in normal prostate tissue due to its dependence on citrate secretion, a key intermediate in the tricarboxylic acid (TCA) cycle.15 Studies suggest that PC is not glycolytic and upregulates fatty acid (FA) for energy, particularly de novo lipid synthesis, with lipid biosynthetic enzymes upregulated by AR signaling.16 Similarly, glutamine transports proteins and enzymes responsible for its conversion to glutamate, which serves as a carbon source for the TCA and can be used to make FAs, are regulated by AR and increase in PC.16 Previous work on PC metabolism has focused on hormonally intact cancers.15, 16 A number of studies on the relationship between androgens and PC metabolism have examined the effects of androgen supplementation. To date, there has not been a broad analysis of changes in metabolism during the early response of hormone-sensitive PC cells to ADT.
Technologies to investigate metabolic changes include mass spectrometry (MS), which provides detailed information on the relative abundance of metabolites in a cellular environment and the analysis of protein expression levels which estimate relative fluxes through metabolic pathways, especially with enzymes that act as rate limiting steps.17 Newer approaches include two-photon optical metabolic imaging (OMI) and extracellular flux analysis (Seahorse) that contextualize changes in metabolite levels and more comprehensively characterize metabolic phenotypes. OMI is a nondestructive, label-free microscopy technique that monitors single-cell metabolism in live cells based on the two-photon autofluorescence of co-enzymes NAD(P)H and FAD. The optical redox ratio (ORR), defined as the ratio of the fluorescence intensity of NAD(P)H to that of FAD, reflects the redox state of the cell, as NAD(P)H is an electron donor while FAD is an electron acceptor.18, 19 Importantly, changes in the ORR relate to changes in the glycolytic index,20 oxygen consumption,21 and glutamine consumption.22 It is useful as an early marker of drug response in cells. A complementary approach is Seahorse that measures both oxygen consumption and the extracellular acidification rate (ECAR) of cells.23, 24
In the current study, we find that hormone sensitive PC cell lines in the early time period after ADT have a decreased overall energy metabolism and display features of quiescence and senescence compared to untreated conditions. Screening selected pathway inhibitors indicates resistance to metabolic inhibitors (e.g., FA) after ADT for advanced PC. However, we find that ADT followed by glycolytic inhibitors synergistically reduces cell number and warrants further investigation. Our results further suggest unique metabolic susceptibilities exist after ADT that are not seen with simultaneous ADT and metabolic treatment.
2 METHODS
2.1 Cell lines, cell culture, and androgen deprivation
Androgen-dependent LNCaP (ATCC) were routinely cultured in in RPMI-1640 medium (Corning) supplemented with 10% fetal bovine serum (FBS; Gibco, Invitrogen) and 1% penicillin/streptomycin (PS, Cell grow), and VCaP PC cells were cultured in DMEM medium (Corning) containing 4.5 g/L glucose supplemented with 10% FBS, and 1% PS. Both were grown at 37°C in 5% CO2. Androgen deprivation was achieved via substitution of 10% charcoal-stripped serum (CSS) for FBS.25 C4-2 and Du145 cells were cultured in RPMI or DMEM medium, respectively, with the same condition as above.
2.2 MS metabolite analysis
Triplicate analysis of cells placed in androgen depleted media was carried out at the West Coast Metabolomics Center at UC Davis. Briefly, untargeted metabolomics profiling screening for all detectable compounds using validated gas chromatography-time-of-flight mass spectrometry (GC-TOF MS) method was used to profile the cells at the two time-points (4 and 8 days after androgen deprivation). Details of the protocols used for metabolite extraction, derivatization, gas chromatography–mass spectrometry (GC-MS) data acquisition, and data processing have been described in detail previously.26, 27 Compound identifications were made based on their retention index and comparisons of their mass spectra to the BinBase metabolomics database using the BinBase algorithm.28
2.3 OMI
Fluorescence lifetime images were taken on a custom built inverted multiphoton microscope (Bruker Fluorescence Microscopy), as previously described.20 Briefly, the system consists of an ultrafast laser (Coherent Inc.), an inverted microscope (Nikon; Eclipse Ti), and a 40× water immersion (1.15NA; Nikon) objective. Four independent fields of view were acquired per replicate with two experimental replicates for each condition (8 total). NAD(P)H and FAD images were acquired sequentially for the same field of view using an excitation wavelength of 750 nm and a 440/80 nm emission bandpass filter for NAD(P)H fluorescence, and an excitation wavelength of 890 nm and a 550/100 nm emission bandpass filter for FAD fluorescence. Fluorescence lifetime images were collected using time correlated single photon counting electronics (SPC-150; Becker & Hickl) and a GaAsP photomultiplier tube (H7422P-40; Hamamatsu). A pixel dwell time of 4.8μs was used to acquire 512 × 512 pixel images over 60 s total integration time. The photon count rates were maintained at 2–6 × 10⁵ photons/s to ensure adequate photon observations for lifetime decay fits, and no photobleaching. The instrument response function was measured from second harmonic generation of urea crystals excited at 900 nm, and the full width at half maximum was calculated to be 220 ps. A Fluoresbrite YG microsphere (Polysciences Inc.) was imaged as a daily standard for fluorescence lifetime, fit to a single exponential decay, and the measured lifetime was 2.1 ns (n = 7), which is consistent with published values.29
2.4 Quantification of OMI images
NAD(P)H and FAD fluorescence lifetime images were analyzed using SPCImage software (Becker & Hickl) as previously described.30 Binning of only 3 × 3 pixels was used to preserve spatial resolution for each bin, the fluorescence lifetime decay curve was deconvolved with the instrument response function and fit to a two-component exponential decay model, . In this model I(t) is the fluorescence intensity at time t after the laser excitation pulse, α represents the fractional contribution from each component, C accounts for background light, and τ represents the fluorescence lifetime of each component.30 A two-component model was used because both NAD(P)H and FAD can exist in two conformational states, bound or unbound.18, 31 The mean lifetime (τm) of both NAD(P)H and FAD were calculated as τm = α1τ1 + α2τ2. The total intensity was calculated from the lifetime decay by summing the photons detected at each pixel in the image. The intensity of NAD(P)H was then divided by the intensity of FAD for each pixel to calculate the ORR.
A previously described an automated cell segmentation pipeline was created in Cell Profiler and applied to NAD(P)H intensity images.32 Briefly, pixels belonging to nuclear regions were manually identified and the resulting round objects were stored as a mask. Cells were identified by propagating out from each nucleus, an Otsu Global threshold was used to improve the propagation and prevent it from continuing into background pixels. Cell cytoplasm was defined as the cell border minus the nuclei. Values for τm, τ1, τ2, α1, and intensity of NAD(P)H and FAD as well as the ORR were measured for each cell cytoplasm. For each variable, values for all cells within a treatment group were pooled together, 115–850 cells were analyzed per condition.
2.5 Metabolic inhibitor assay
Cells were seeded in 2 ml of either control or ADT media on 35 mm glass bottom imaging dishes at a density of 20,000 cells for LNCaP and VCaP, and 10,000 cells for C4-2 and Du145 and grown for 4–8 days. Media was refreshed every 2 days with the final replacement occurring 24 h before imaging experiments. Treatments at the corresponding doses were started at the appropriate time before imaging.33 Two experimental replicates were repeated for each treatment.
2.6 Seahorse metabolic profiling
Oxygen consumption rate (OCR) and ECAR were measured with a Seahorse Extracellular Flux Analyzer XFe96 (Agilent), with three–four replicates per condition. LNCaP and VCaP cells were plated 1 and 2 days, respectively, before assay. Cell culture microplates were coated with Cell-Tak (22.4 μg/ml; Corning) before plating 1 × 10⁴ LNCaP or 3 × 10⁴ VCap cells per well. The assay medium used for LNCaP included pH-adjusted RPMI (Agilent) supplemented with glucose (10 mM), glutamine (2 mM), and pyruvate (1 mM), with VCaP medium using DMEM (Agilent) in place of RPMI. On the day of the assay, cells were washed twice with assay media, always leaving 30 μl of media in the wells, and incubated for 1 h in a 37°C non-CO2 incubator before assay start.
Basal OCR and ECAR were normalized by DNA per well as quantified by Hoechst fluorescence, a marker for relative cell number. After completion of assay, plates were washed with 25% PBS, after which 100 μl of sterilized nuclease-free water was added and allowed to incubate for 2 h before being frozen at −80°C. Subsequently plates were thawed, incubated with Hoechst 33258 dye at final concentration of 6.7 µg/ml in high salt TNE buffer, and scanned on a plate reader using 360 nm excitation/460 nm emission.
2.7 Western blot
Cells were collected following 4 and 8 days of CSS exposure and western performed using previously described protocols.33 Blots were then probed with antibodies overnight at 4°C against the following proteins: Fatty acid synthase (FASN) (Santa Cruz, 55580), acetyl-CoA carboxylase alpha (ACCα) (Santa Cruz, 137104), acetyl-CoA carboxylase beta (ACCβ) (Santa Cruz, 377313), carnitine palmitoyltransferase 1 (CPT1) (Santa Cruz, 393070), glutaminase (GLS) (Proteintech, 66265-1-lg), alanine/serine/cysteine-transporter 2 (ASCT2) (MyBioSource, 8292367), androgen receptor (AR) (Santa Cruz, 7305), and α-tubulin (Calbiochem, CP06). Bands were quantified by measuring the signal density, subtracting the background for each lane, and dividing by the tubulin band density before normalization to the cellular control.
2.8 Cell growth assays
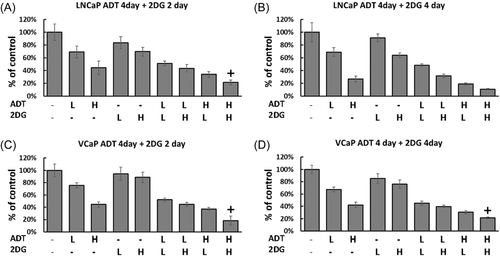
DNA levels of control and treated cells were quantitated with a fluorescent DNA assay as described. LNCaP and VCaP, respectively, were plated in 96-well culture plates containing FBS. The following day, the media was switched to either ADT (CSS medium) or regular media. For simultaneous treatment, 2-DG was applied the same time with ADT. For sequential treatment, after 4 days with ADT the cells were treated with 2-DG. Conditions for ADT included: LNCaP, Control: 10% FBS; Low: 8% CSS + 2% FBS; High: 10% CSS; VCaP, Control: 10% FBS; Low: 6% CSS + 4% FBS; High: 10% CSS. Conditions for 2-DG included: 2-DG Low (mM): LNCaP, 1; VCaP 5; High, LNCaP, 5; VCaP 10. Plates were washed and incubated with Hoechst 33258 dye at final concentration of 6.7 µg/ml in high salt TNE buffer and scanned on a plate reader using 360 nm excitation/460 nm emission at Days 6 and 8 for 2 and 4 days 2-DG treatment, respectively.
2.9 Statistical analysis
Comparisons for mass spectroscopy altered metabolites and Seahorse metrics were completed as paired two-tail t-test. Differences in OMI variables between treatment and control cells were tested using a one-way analysis of variance of control versus treatment, all p-values <0.05 were defined as significant. Treatment effect size of OMI of inhibitors was calculated using Glass's Delta (GD) [(µtreatment − µcontrol)/σcontrol].34, 35
3 RESULTS
3.1 Acute ADT induces metabolite profile alterations in PC with an abundance of glycolytic intermediates
Our group has phenotypically characterized the response of PC cells (LNCaP and VCaP) to ADT and found that most cells initially respond with decreased proliferation accompanied by apoptosis in a subset of cells within 48 h (2%–4%).6, 33 Cells then undergo senescence and quiescence by Day 8, with their associated phenotypic and gene expression changes. To obtain an overview of metabolism during this time frame, MS was used to temporally measure changes in the metabolite profile of the hormone sensitive (LNCaP) cell line at 4 and 8 days after ADT. Hormonal depletion was accomplished in cell culture using CSS removing androgens. MS evaluation of 252 metabolites found 49 and 135 were significantly different (p < 0.05) compared to control after 4 and 8 days of treatment, respectively (Figure 1A). At 4 days, 45% of the significantly altered metabolites were increased relative to control. In the 8-day group, this number increased to 59%, suggesting that some metabolites that were initially depressed relative to control became more abundant with longer exposure to ADT.
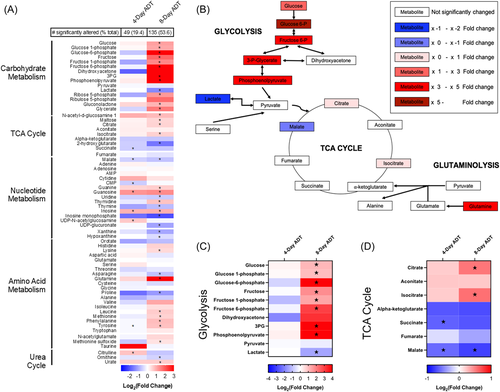
Metabolites were then organized into groups based on function (Figure 1A). Notably, there was a large group of metabolites that were significantly increased following ADT that belong in the carbohydrate metabolism category, specifically glycolysis (Figure 1B,C). Also of interest is an accumulation of substrate upstream to alpha-ketoglutarate in the TCA cycle (Figure 1D). These changes in metabolite levels after ADT motivated additional study of functional changes in redox state and oxygen consumption to assist in identifying whether metabolite accumulation might be due to increased flux through these pathways upstream, or decreased flow downstream.
3.2 ADT decreases the ORR in hormone sensitive, but not castration resistant cell lines in the acute phase
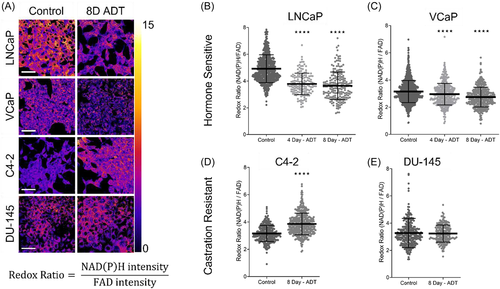
We expanded our analysis to both hormone sensitive and resistant cell lines and employed OMI to monitor the oxidation–reduction state of live cells.20 ORR measures the autofluorescence intensity of NAD(P)H relative to FAD and provides label-free images of the oxidation–reduction (redox) state of the cell thus reflecting cellular metabolism.36, 37 The fluorescence properties of NADH and NADPH overlap and are jointly referred to as NAD(P)H.
Qualitative ORR images in control and Day 8 ADT conditions confirm that cells are viable (Figure 2A). LNCaP cells exhibit a morphological shift to a more elongated shape after 8 days of ADT consistent with prior studies.38, 39 No morphological change after ADT was seen in the castration resistant lines C4-2 and Du145.40 The ORR significantly decreases with ADT in LNCaP and VCaP, at both 4 and 8 days compared to hormone replete conditions (Figure 2B,C). The reduction in the ORR with ADT in hormonesensitive lines is driven by decreases in NAD(P)H intensity and increases in FAD intensity (Supporting Information: Figure 1), reflecting a more oxidized cell redox state. As a control, the androgen resistant lines C4-2 and DU-145 were imaged after 8 days of ADT exposure and show an increase in the ORR or no change, respectively (Figure 2D,E).29, 41 NADH(P)H and FAD mean lifetimes also change when cells are grown in ADT media, however, the changes are not consistent across hormone sensitive or castration resistant cell lines (Supporting Information: Figure 2).42 Thus, OMI demonstrates that hormone sensitive cell lines show significant decreases in ORR following ADT compared to castration resistant lines, confirming that ADT induces an oxidized redox state in hormone sensitive PC cells. These data indicate that the abundance of glycolytic intermediates seen with MS is likely due to a decrease in intracellular glycolytic flux.
3.3 Seahorse and western blot analysis of ADT-treated cells reveals overall depression in energy metabolism resulting in a quiescent/senescent phenotype
To further examine the baseline metabolic responses of PC and the changes that are induced with ADT, we employed the Seahorse extracellular flux assay. The Seahorse platform detects real-time changes in cellular bioenergetics through measurements of OCR and ECAR. Together, OCR and ECAR can characterize the metabolic phenotypes of cells.43, 44 OCR and ECAR significantly decreased with 8 days of ADT exposure compared to control in both LNCaP and VCaP cells (Figure 3A,B and Supporting Information: Figure 3). OCR is related to mitochondrial respiration while ECAR is related to anaerobic glycolysis and CO2 production via the TCA cycle. The reduction of both OCR and ECAR with ADT across both cell lines indicates a decrease in overall energy metabolism. We find that hormone sensitive cell lines have an energetic/glycolytic metabolic phenotype under control conditions but shift to a more quiescent/senescent phenotype after 8 days of ADT (Figure 3C).
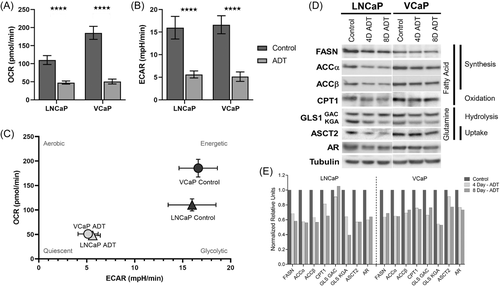
We next examined the protein expression of several key regulatory enzymes in FA and glutamine utilization (Figure 3D). An analysis of protein concentrations can provide insight into flux through pathways, especially with enzymes that act as rate limiting steps, but do not directly reflect enzyme activities.17 These pathways were specifically chosen as OMI and seahorse indicated a decreased role of glycolysis and PC is known to rely on FA metabolism.16, 45 Three enzymes related to FA synthesis, including FASN and two isoforms of ACC showed decreased expression after ADT (Figure 3D,E). Similarly, the expression of enzymes responsible for glutamine uptake and hydrolysis, ASCT2 and the kidney-type glutaminase (KGA) isoform of GLS1, decrease after both 4 and 8 days of ADT (Figure 3D,E). Importantly, AR expression decreases in early ADT, at both 4 and 8 days of ADT consistent with the literature.39 In summary, hormone sensitive PC cells treated with ADT that exhibit overall depression in energy metabolism concurrently appear to downregulate key regulatory enzymes in FA and glutamine utilization in the acute phase.
3.4 ADT reduces PC cell sensitivity to targeted metabolic pathway inhibitors in the early phase
There has been interest in whether inhibitors of metabolic pathways might improve the response to ADT given recent data demonstrating modest improvements in survival with metformin and statins in combination with ADT.8, 9 OMI is a new approach to gauge the efficacy of drugs in living cells. Based on our data, we selected several inhibitors of glycolysis, glutaminolysis, FA synthesis, electron transport chain (ETC), and FA oxidation (Figure 4A) to test on hormone sensitive PC cells after ADT. Specifically, 2-DG (2-Deoxy-d-glucose) inhibits glycolysis, Malonate inhibits succinate dehydrogenase subunit A and the ETC, BPTES [Bis-2-(5-phenylacetamido-1,3,4-thiadiazol-2-yl)ethyl sulfide] blocks GLS1 and thus glutamine conversion to glutamate, TOFA [5-(Tetradecyloxy)−2-furoic acid] inhibits FA synthesis via ACC, and etomoxir blocks FA oxidation by inhibiting CPT1. Previous work indicates that T cells and breast cancer cells that are sensitive to 2-DG, Malonate, BPTES, and etomoxir have a decreased ORR, while cells sensitive to TOFA have an increased ORR.46, 47 Significant changes with the addition of these agents to ADT may result in either an increased or decreased ORR dependent on the pathway inhibited.
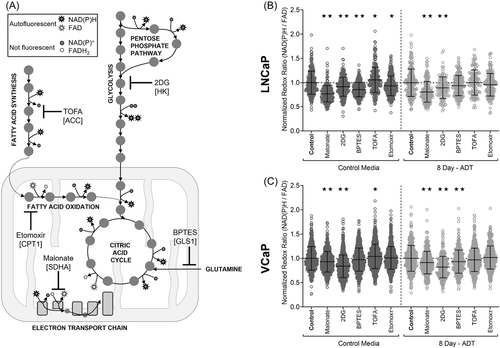
Both hormone sensitive cell lines, LNCaP and VCaP, demonstrate altered ORR responses to metabolic inhibitors after ADT compared to control conditions (Figure 4B,C). Responses demonstrate some variation between lines which is unsurprising due to their different genetic phenotypes.48 LNCaP cells in FBS control conditions show altered ORR (normalized to the media control) for all metabolic inhibitors (Figure 4B). However, after 8 days of ADT LNCaP cells only remain sensitive to 2-DG and Malonate treatment, and no longer respond to the other metabolic inhibitors tested (Figure 4B). VCaP cells in FBS alter ORR with 2-DG, Malonate and TOFA treatment. After ADT, VCaP cells remain sensitive to 2-DG and Malonate but are also sensitive to BPTES (Figure 4C). We find that both cell lines maintain consistent sensitivity to glycolysis inhibition (2-DG) both before and after ADT. The effect size, for 2-DG treatment of LNCaP was augmented with ADT (GD = 0.374) compared to control (GD = 0.353) as was VCaP (ADT GD = 0.675; control GD = 0.663). This enhanced sensitivity to 2-DG after ADT is consistent with our mass spectroscopy results (Figure 1). We also saw that both cell lines were consistently sensitive to ETC inhibition (Malonate); however, sensitivity to Malonate was reduced after ADT exposure in both LNCaP (control GD = 0.972; ADT GD = 0.678) and VCaP (control GD = 0.329; ADT GD = 0.284). Additional Mito-fuel flex results indicate changes in preferred fuel sources with ADT that support this resistance to metabolic inhibitors during acute ADT (Supporting Information: Figures 3 and 4).
Given both LNCaP and VCaP cells demonstrate consistent reductions in the ORR to 2-DG after ADT indicating a drug response, we examined whether this translated into changes in cell number. We treated cell lines with both 2-DG and ADT in two different ways, sequentially and simultaneously. First, the cells were treated by ADT for 4 days to induce an alteration in the redox ratio, and then 2-DG was administered for 2 or 4 days. Exposure to either ADT or 2-DG alone caused a reduction in growth in both cell lines (p < 0.05) compared to controls (Figure 5). Combining ADT followed by 2-DG resulted in a moderate calculated synergistic effect (0.5–0.8) in both cell lines. Second, the two cell lines were treated with both 2-DG and ADT simultaneously, however, the combination of the two agents did not show synergistic inhibition (Supporting Information: Figure 5). This emphasized the importance of ADT in inducing a metabolic susceptibility before drug inhibition.
4 DISCUSSION
ADT and novel therapies targeting the AR have produced improvements in survival for patients with advanced PC, but most patients develop resistance to these treatments.49 Determining how PC cells evade hormonal depletion could provide insight into new therapeutic strategies. It is possible that PC cells adapt to hormonal depletion through metabolic alterations that offer new targets for advanced PC.50, 51 However, few studies have comprehensively characterized metabolic changes with ADT in PC cells and furthermore characterized the dependency on those metabolic changes.
Here, multiple measurements of cell metabolism (MS, OMI, and Seahorse), found that PC cell lines during acute ADT treatment exhibited decreased energy metabolism and a senescent/quiescent phenotype arises leading to decreased sensitivity to metabolic pathway inhibition except for glycolysis. Metabolite specific MS analysis of a hormone sensitive PC line revealed significant changes in many metabolites, most notably an increased abundance of glycolytic intermediates with 8 days ADT compared to control. However, MS alone cannot comprehensively characterize metabolic phenotypes. Therefore, live cell analysis of redox state and oxygen consumption was performed during acute ADT. Decreases in ORR with ADT in hormone sensitive PC cells suggest that the abundance of glycolytic intermediates seen with MS lead to an oxidized cell state.20 This is further supported by the decrease in ECAR with ADT compared to control in hormone sensitive PC cells, which confirms a decrease in aerobic glycolysis. ADT-treated cells also consumed less oxygen compared to control, thereby generating less energy via the ETC. Decreases in both ECAR and OCR indicate decreased flux through glycolysis and the TCA cycle. This supports previous work that indicates that cells subject to acute ADT display decreased metabolic activity, reflecting a quiescent phenotype,52 with no major changes in cell viability.6
In both cell line models, protein expression levels of enzymes regulating FA and glutamine metabolism also decrease with acute ADT. Specifically, enzymes related to FA Synthesis (FASN and ACC) and glutamine hydrolysis (KGA). A recent PC study confirms our observation that ADT decreases KGA, a splicing isoform of glutaminase 1 (GLS1) upregulated by AR.53 This study finds the development of CRPC results in expression of glutaminase C (GAC), an androgen independent GLS1 isoform with more potent enzymatic activity leading to increased glutamine utilization and proliferation. Our finding of metabolic and enzymatic suppression with ADT suggests resistance to combinations with FA or glutamine inhibitors in the acute ADT setting. In contrast, with the complete development of castration resistance, increased expression of FA and glutamine has generated interest as a target.
Our goal was to uncover metabolic susceptibilities induced by ADT, therefore we applied metabolic inhibitor therapies after acute exposure to ADT. Previous work has investigated AR antagonists after ADT and observed similar signaling responses,6, 33 here, we focus on targeted metabolic inhibitors. Differences in responses to metabolic inhibitors was noted between hormone-sensitive cell lines, reflecting the genetic and perhaps epigenetic heterogeneity of PC.48, 54 Importantly, OMI of two hormone sensitive lines showed that ADT-treated cells were resistant to several targeted metabolic inhibitors, most notably inhibition of FA metabolism. Both LNCaP and VCaP cells remained sensitive to ETC inhibition with Malonate both before and after ADT, although sensitivity decreased after ADT treatment. With both LNCaP and VCaP cells, a potent inhibitor of glycolysis (2-DG) consistently affected the ORR in both ADT-treated and untreated cells, with a significant increase in sensitivity to 2-DG after ADT.
To gauge the effect of this combination on inhibition of proliferation, we extended our studies. A significant drug synergy was calculated when ADT was followed by 2-DG treatment. ADT made the cells more susceptible to glycolytic inhibition (Figure 5). 2-DG has been examined as a treatment for CRPC patients in combination with docetaxel.55 In addition, 2-DG has been used to target and induce apoptosis in senescent cells a phenotype common after ADT.56 Our data indicate that acute ADT induces a quiescent/senescent phenotype in these cell lines, and a glycolytic block given sequentially after ADT might improve patient outcomes, a hypothesis to be tested in follow-up studies of patient-derived samples. In contrast simultaneous ADT/2-DG treatment failed to demonstrate any synergy (Supporting Information: Figure 4).
There are several limitations to note in these studies. Cell lines are common models for disease but cannot capture the complexity of the tumor microenvironment or diversity between patients. Our work primarily focused on acute 4- and 8-day ADT treatment, and it is known that prolonged time-points after ADT yield diverse results in vivo. For example, previous studies have shown that expression of the major transcriptional regulator of FA metabolism, SREBP, is initially depressed following castration in mice, but subsequently upregulated to supraphysiologic levels.57 Additionally, further investigation into the mitochondrial morphology and function during acute ADT is of interest and could be pursued.
5 CONCLUSIONS
We used a multifaceted approach to metabolically characterize PC cells during acute ADT treatment, to identify potential metabolic targets. Hormone-sensitive PC cells displayed an overall depression in energy metabolism and induced a quiescent/senescent phenotype with sensitivity to selected metabolic inhibitors. Further investigation of the combination of ADT followed by 2-DG may be promising. 2-DG has a rapid metabolism and short half-life requiring higher toxic concentrations in vivo. Newer early phase glycolytic blocking agents, (e.g., WP1122) that improve the drug like properties of 2-DG are under development.58 The induction of this susceptible phenotype using ADT first is important as simultaneous treatment does not improve cell death.
ACKNOWLEDGMENTS
This study was partially supported by the UW Carbone Cancer Center Cancer Metabolomics Shared Resource directed by Drs. Josh Coon and Katie Overmyer. The authors were supported by grants from the National Institutes of Health (R01 CA185747, R01 CA205101, R01 CA211082, R37 CA226526, U01 EY032333); and the University of Wisconsin Carbone Cancer Center (Support Grant P30 CA014520 and the UWCCC Pancreatic Cancer Taskforce). Support was also provided by the Department of Defense (PCRP 150221) and AUA Foundation (to T. K.).
CONFLICT OF INTEREST
The authors declare no conflict of interest.
Open Research
DATA AVAILABILITY STATEMENT
The data that support the findings of this study are available from the corresponding author [DJ and MS], upon reasonable request.


