Controlling the incorporation of fluorinated amino acids in human cells and its structural impact
Review Editor: Hideo Akutsu
Abstract
Fluorinated aromatic amino acids (FAAs) are promising tools when studying protein structure and dynamics by NMR spectroscopy. The incorporation FAAs in mammalian expression systems has been introduced only recently. Here, we investigate the effects of FAAs incorporation in proteins expressed in human cells, focusing on the probability of incorporation and its consequences on the 19F NMR spectra. By combining 19F NMR, direct MS and x-ray crystallography, we demonstrate that the probability of FAA incorporation is only a function of the FAA concentration in the expression medium and is a pure stochastic phenomenon. In contrast with the MS data, the x-ray structures of carbonic anhydrase II reveal that while the 3D structure is not affected, certain positions lack fluorine, suggesting that crystallization selectively excludes protein molecules featuring subtle conformational modifications. This study offers a predictive model of the FAA incorporation efficiency and provides a framework for controlling protein fluorination in mammalian expression systems.
1 INTRODUCTION
Nuclear magnetic resonance (NMR) spectroscopy is a highly versatile and powerful tool for investigating proteins and providing detailed information about their structures, interactions, and dynamics both in vitro and in cells (Hu et al., 2021; Luchinat et al., 2022; Sekhar & Kay, 2019; Theillet, 2022). Despite its versatility, the use of traditional NMR-active nuclei like 1H, 13C, and 15N can be particularly challenging for the evaluation of large and complex proteins due to signal overlap and reduced sensitivity, which limit the quality of data gained from NMR experiments. Furthermore, the presence of numerous hydrogen, carbon, and nitrogen atoms makes spectra more complicated and signals difficult to assign. To address these issues, the incorporation of fluorine-19 (19F) into proteins and nucleic acids has emerged as a promising solution for the study of these molecules through 19F NMR spectroscopy (Arntson & Pomerantz, 2016; Chen et al., 2013; Divakaran et al., 2019; Gronenborn, 2022; Puffer et al., 2009; Sochor et al., 2016; Sudakov et al., 2023). 19F is an attractive alternative to the traditional NMR-active nuclei in protein studies thanks to its high sensitivity (83% of 1H). Additionally, the 19F NMR spectra exhibits a broad shift range, thus enabling resolved signals for individual fluorinated amino acids within the protein's primary sequence, despite the potential broadness of the fluorine resonances (Gerig, 1994; Kitevski-LeBlanc & Prosser, 2012). Furthermore, in-cell 19F NMR studies of fluorinated proteins and nucleic acids have recently emerged as an appealing area of research, owing to the scarcity of natural fluorine abundance within biological systems, which results in a virtual absence of the fluorine background signal (Jackson et al., 2007; Krafčík et al., 2021; Li et al., 2010; Luchinat & Banci, 2022; Zhu et al., 2022).
In recent years, the development of techniques to incorporate fluorinated amino acids into proteins, either through chemical synthesis or the most widely used biosynthetic incorporation by organisms, has enabled the study of fluorinated proteins in vitro, in bacteria and in mammalian cells. The chemical synthesis method involves the concatenation of small peptides via the thioester ligation method, offering precise control over the introduction of fluorinated amino acids. While this method allows introducing a wide variety of fluorinated synthetic amino acids, is better suited to smaller proteins due to increasing time and costs with the molecular size (Gimenez et al., 2021; Yoder & Kumar, 2002). On the contrary, biosynthetic incorporation in prokaryotic expression systems has been widely employed to introduce fluorinated amino acids in proteins of any size due to its versatility and simplicity (Crowley et al., 2012; Gee et al., 2016; Li et al., 2010; Yoder & Kumar, 2002). We have recently proposed an approach for the biosynthesis of fluorinated proteins in human HEK293T cells, which further expanded the potential applications of NMR to fluorinated proteins (Pham et al., 2023). This approach exploits the distinctive cellular environment of eukaryotic systems, thus overcoming limitations imposed by prokaryotic expression, such as the absence of chaperones, transcriptional machinery, and co-translational processing.
In this work, we show how different expression conditions allow controlling the incorporation efficiency of fluorinated aromatic amino acids into proteins expressed in human cells. We identify two optimal expression conditions: one for maximizing the incorporation of multiple fluorinated amino acids per protein molecule, which results in higher intensity signals in 19F NMR spectra and therefore is beneficial for applications where sensitivity is critical (e.g., in-cell NMR), and the other for limiting the incorporation to a single fluorinated amino acid per molecule, which minimizes structural perturbations that may arise from the interaction of fluorine atoms with their neighbors within the protein fold. For each condition, the overall incorporation of fluorinated amino acids is studied using NMR spectroscopy and the frequency distribution of each fluorinated protein form is investigated by direct mass spectrometry (MS). Furthermore, we explore the potential structural changes induced by fluorinated amino acids on a model protein, carbonic anhydrase 2 (CA2), through x-ray crystallography. Finally, we provide a predictive model to anticipate the level of incorporation of a specific fluorinated amino acid in proteins expressed in HEK293T cells, based on the amount of fluorinated amino acid added to the expression medium. This predictive model holds the potential to provide an invaluable mammalian fluorinated protein expression protocol for researchers, further advancing the frontiers of protein studies through 19F NMR spectroscopy analysis.
2 RESULTS AND DISCUSSION
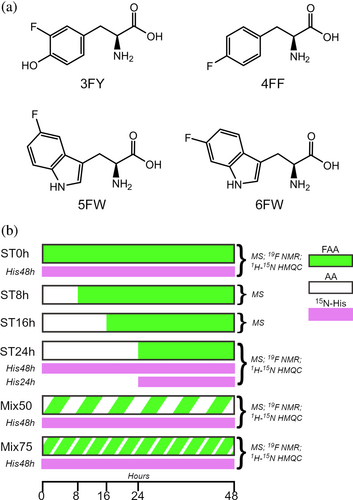
The incorporation of fluorinated aromatic amino acids (FAAs) 3-fluoro-L-tyrosine (3FY), 4-fluoro-L-phenylalanine (4FF), 5-fluoro-L-tryptophan (5FW) and 6-fluoro-L-tryptophan (6FW) (Figure 1a) in a protein expressed in HEK293T cells transiently transfected with the gene of interest is made possible by replacing a specific amino acid with its corresponding FAA in the medium during protein expression (Pham et al., 2023). As protein expression decreases when cells are supplemented with FAAs immediately after transfection, a medium switch time (ST) between 8 and 24 h post-transfection was introduced. Prior to the ST, the cells were maintained in normal medium to allow the internalization of DNA and transcription in non-fluorinated medium. Subsequently, the medium was replaced with FAA-containing medium to allow the incorporation of FAAs into the expressed protein. The total expression time was kept constant at 48 h (Figure 1b) (Pham et al., 2023). Here, the optimal conditions to maximize the incorporation of 3FY, 4FF, 5FW, and 6FW were investigated with STs of 8, 16, and 24 h (see Materials and Methods). Conversely, to optimize the diluted incorporation of FAAs, that is, such that each molecule contains only one fluorine atom, cells were incubated immediately after transfection with an expression medium containing a mixture of FAA and natural amino acid at two different ratios (Mix50 and Mix75 in Figure 1b). Unlike 4FF, 5FW, and 6FW, protein expression levels in cells incubated with 3FY-containing medium immediately after transfection was comparable to that achieved with the medium switch condition (Figure S1), albeit resulting in a reduced total number of cells. Therefore, this condition for the incorporation of 3FY was also investigated.
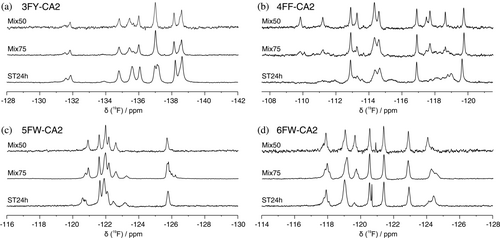
The effect of different expression conditions on the protein 19F NMR spectrum was investigated on samples of pure FAA-CA2. These samples were detected using a room-temperature 1H probe tuned for 19F detection (see Materials and Methods section). The 19F spectra of FAA-CA2 (Mix50) exhibit well-resolved and distinct peaks, whereas those of FAA-CA2 (ST24h) and, to less extent, FAA-CA2 (Mix75) display several additional signals causing multiple overlaps (Figure 2). In the Mix50 and Mix75 conditions, the overall signal intensity was markedly decreased compared to the ST24h, indicating that the fluorine incorporation is much lower when the FAA is mixed with the natural amino acid. However, the ST24h spectra suggest that this condition results in higher but still incomplete fluorine incorporation, causing the signal from each fluorine nucleus to split in many components, each arising from a unique combination of fluorine atoms present in other positions within the protein structure. In the Mix50 and Mix75 conditions fewer fluorine atoms are present in each protein molecule, causing less interference and resulting in a more resolved and cleaner spectrum.
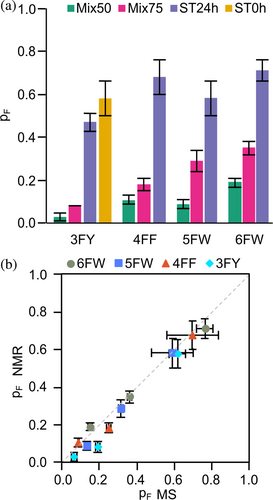
The fluorine incorporation in each expression condition was assessed by direct MS directly on cell lysates. The high resolving power of direct MS enabled us to identify in a single spectrum the populations of all coexisting fluorinated states, which differ in the number of incorporated fluorine atoms (nF) obtained in each expression condition (Figures S2, S3 and Tables S2–S5). MS analysis of FAA-CA2 samples obtained with medium switch conditions revealed two distinct and well-separated populations, namely the non-fluorinated protein (nF = 0) expressed prior the medium switch and the fluorinated proteoforms with different number of incorporated fluorine atoms (nF ≥1) expressed after the medium switch (Figure S4). Conversely, the distributions obtained from the FAA-CA2 (Mix50) and (Mix75) samples showed a single population comprising proteoforms with lower nF values (Figure S5). Both the post-switch and the Mix distributions have the characteristic shape of binomial distributions, indicating that the incorporation of FAAs is a purely stochastic phenomenon in all the expression conditions tested, that is, that the probability of incorporation (pF) is independent of the position along the protein sequence. We therefore derived pF for all the expression conditions tested (Figure 3 and Table S6).
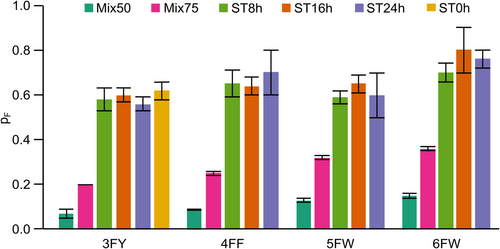
The pF values of the Mix samples were much lower than those obtained with the medium switch, consistent with the lower signal intensity observed in the 19F NMR spectra. Furthermore, analysis of the ST samples shows that pF remains relatively constant regardless of the ST value, indicating that the medium switch time only changes the amount of total fluorinated protein expressed, but not the probability of fluorine incorporation. The pF of the 3FY-CA2 (ST0h) sample is also comparable to the pF of the ST8h, ST16h, and ST24h samples, consistent with the 19F NMR spectrum of 3FY-CA2 (ST0h), which is superimposable to that of 3FY-CA2 (ST24h) (Figure S6). Therefore, introducing the FAA at the beginning of protein expression or after an arbitrarily long incubation time has no effect on the incorporation efficiency in the protein expressed post-switch. Overall, these data indicate that 100% fluorine incorporation cannot be accomplished even when the FAA is administered immediately after transfection, and suggest that a pool of natural amino acid remains inside the cells after the medium switch, retaining the potential to produce proteins containing both non-fluorinated and fluorinated amino acids.
To determine whether the fluorine incorporation could also be assessed by NMR spectroscopy, CA2 was expressed in the presence of both FAA and 15N-labeled histidine. The histidine side-chain 1H and 15N chemical shifts were used to monitor the presence of nearby fluorine atoms, which induce a change in the chemical surroundings. In the medium switch condition, labeled histidine was introduced to the expression medium either immediately after transfection or 24 h post-transfection together with the FAA. In the mix condition, labeled histidine was introduced immediately after transfection along with the FAA + non-FAA mixture (Figure 1b). Each expression condition was analyzed by 2D 1H-15N NMR directly on the cell lysate. The spectra of FAA-CA2 (ST24h + His48h) showed two distinct signals with different intensities for each histidine (Figure S7) as a consequence of being either in the non-fluorinated protein form or in the fluorinated one. Conversely, in the spectra of FAA-CA2 (ST24h + His24h) the signals arising from the non-fluorinated protein form were much weaker but still clearly detected (Figure 4). In the spectra of FAA-CA2 (Mix50) and (Mix75), the signals from the fluorinated protein were barely detected, as expected given very low fluorine incorporation reported by MS (Figures S8 and S9).
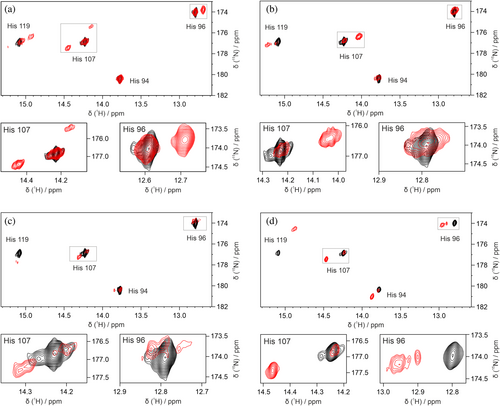
Assuming that the position of the cross peak corresponding to the fluorinated protein is primarily influenced by a single fluorine atom, with minimal influence from other fluorine atoms, the extent of fluorine incorporation within each sample was estimated by signal integration. 15N-histidine added immediately after transfection provides the overall fluorine content in the total protein population, whereas labeled histidine added 24 h post-transfection allows focusing on the protein expressed after the medium switch, and thus can be used to estimate the probability of fluorine incorporation in the FAA-medium (Table S7 and Figure 5a). The good agreement between pF values derived from NMR on lysates and direct MS suggests that, albeit with higher uncertainty, the incorporation of FAAs can also be estimated by NMR spectroscopy by resorting to 15N-histidine or similar amino acid-type selective labeling schemes (Figure 5b).
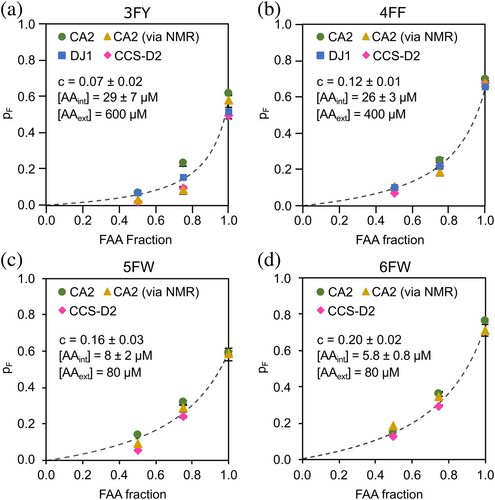
In order to examine the probability of FAA incorporation across different proteins, we analyzed the distribution of fluorinated proteoforms of two additional proteins: the Parkinson-related protein deglycase (DJ-1), and the second domain of the copper chaperone for SOD1 (CCS-D2) (Figures S10 and S11). Overall, the pF values obtained for DJ-1 and CCS-D2 were comparable to those of CA2 expressed under the same conditions, thus demonstrating that the probability of FAA incorporation in our HEK293T expression system does not depend on the specific protein being expressed, rather is solely a function of the amount of FAA in the expression medium (Figure 6). Based on this finding, the pF values obtained by MS were globally fitted with a unified model of FAA incorporation efficiency (Equation 3 in Materials and Methods), which for each FAA depends solely on (i) the total amino acid provided (FAA + AA) in the medium, (ii) a “selectivity coefficient” c which accounts for the fact that the expression machinery recognizes FAAs less efficiently than their corresponding natural AAs, and (iii) the residual endogenous natural AA (AAint), which remains available for protein synthesis after replacing the medium. Using the values of c and AAint obtained for each FAA (Figure 6), equation 3 can be used as a predictive model of FAA incorporation in HEK293T cells.
To evaluate the impact of FAA incorporation on protein structure, we determined the structure of CA2-FAA(ST24h) by x-ray crystallography. The structures of 5FW-CA2 (ST24h), 4FF-CA2 (ST24h) and 3FY-CA2 (ST0h) were determined by x-ray crystallography through molecular replacement, obtaining structures with a resolution of 1.3 Å each (Figure 7 and S12). The structures of FAA-CA2 were perfectly superimposable with the structure of CA2 previously deposited in the PDB and share the same space group and cell parameters (backbone RMSD 0.21 Å) as well as with that of 6FW-CA2 already reported by us (Pham et al., 2023). Fluorine occupancy was then evaluated by letting it free to refine along with the B-factors during structure refinement. In 6FW-CA2, fluorine atoms were present in all seven tryptophan residues with occupancy values ranging from 0.4 to 0.6 (Pham et al., 2023), while in 5FW-CA2 (ST24h) the fluorine occupancy values ranged from 0.12 to 0.47. In 4FF-CA2 (ST24h) fluorine atoms were present in all phenylalanine residues with an occupancy factor ranging from 0.32 to 0.60. In contrast, 3FY-CA2 (ST0h) exhibited greater variability, with position Y114 lacking fluorine atom and residues 3FY128, 3FY191, and 3FY194 presenting two different rotamers due to the ring flip of tyrosine. Notably, the different occupancy values obtained by x-ray crystallography seem at odds with the stochastic fluorine incorporation inferred by MS data.
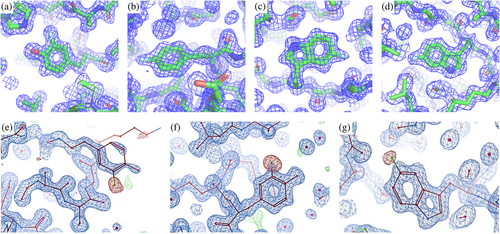
However, unlike the B-factors, which are rigorously treated during crystallographic structure refinement, occupancies are notoriously unreliable parameters (Bhat, 1989; Deller & Rupp, 2015; Pearce, Bradley, et al., 2017; Pearce, Krojer, & von Delft, 2017; Tronrud, 2004). Therefore, to assess the reliability of the above discrepancies, the FAA-CA2 structures were refined again by fixing the occupancy of the fluorine atoms to the average fluorine content obtained from MS. The weighted difference density (mFo-DFc) maps of the structures refined with fixed occupancy were then used to highlight any discrepancy between the expected (from MS) and the observed occupancy of each fluorine atom. This analysis highlighted three residues with significant negative fluorine density (<−3.5 σ) in the mFo-DFc map: Tyr 40 and Tyr 114 in 3FY-CA2, and Trp 16 in 5FW-CA2 (Figure 7e–g), whereas the remaining residues of 3FY-CA2 and 5FW-CA2, as well as those of 4FF-CA2 and 6FW-CA2, did not display significant difference in density in the mFo-DFc maps, indicating that for these residues the occupancy values were compatible with the average fluorine content obtained from MS data.
Based on these observations, we hypothesize that while fluorination preserves the overall folding of CA2, the introduction of fluorine atoms at certain positions induces some conformational changes. A selection process then occurs during crystallization, where the crystal lattice imposed by the non-perturbed CA2 leads to the selective exclusion of perturbed CA2 molecules, resulting in crystallographic structures in which fluorine is absent in the positions where it causes conformational changes. For 5FW-CA2, this hypothesis is corroborated by the observation that the fluorine atom of Trp 16 (Figure 7g), if present, would be sterically hindered due to the proximity of the backbone oxygen of Thr 199 (2.3 Å). For 3FY-CA2, the tyrosine ring flip further complicates the analysis. However, the fluorine atom of Tyr 114 (Figure 7f) would be relatively close to a methyl carbon of Val 109 (3.0 Å), also suggesting a steric effect.
3 CONCLUSIONS
In this work, we combined NMR spectroscopy, direct MS, and x-ray crystallography to thoroughly investigate the incorporation of fluorinated aromatic amino acids into proteins expressed in HEK293T cells under different expression conditions that aimed at either maximizing fluorine incorporation or minimizing structural perturbation. We showed that, for all tested proteins, FAA incorporation follows a predictable pattern which is dependent on the FAA concentration in the expression medium, demonstrating the robustness of the method. Fluorine incorporation occurs stochastically, that is, independent on the amino acid position along the protein sequence, and its efficiency is inherently limited by the cellular system, reaching ~60%–70% at most, regardless of the medium switch time, as observed in the 3FY-CA2(ST0h) sample. Moreover, the good agreement between pF values derived from NMR and those from MS show that it is possible to estimate the incorporation of FAAs by NMR spectroscopy by resorting to 15N-histidine and, in principle, other amino acid-type selective labeling schemes. Finally, the lack of fluorine in distinct positions in the x-ray structure of CA2 suggests that fluorine incorporation at those positions induces subtle conformational changes, which result in the selective exclusion of those protein forms during crystallization. Thus, x-ray crystallography combined with MS and/or NMR may unveil hidden consequences of fluorine incorporation on apparently unperturbed protein structures. In summary, this work provides a predictive model of FAAs incorporation in proteins expressed in human cells, and contributes to understand and control protein fluorination and its structural consequences, further advancing the frontiers of protein study through 19F NMR spectroscopy.
4 MATERIALS AND METHODS
4.1 Gene constructs
Plasmids encoding carbonic anhydrase 2 (CA2, NP_000058.1), DJ-1 (NP_009193.2) and the second domain of the copper chaperone for SOD (CCS-D2; CCS 84-234, NP_005116.1) were obtained from the pHLsec mammalian expression vector (Aricescu et al., 2006) after removing the secretion sequence, as described in previous works (Barbieri et al., 2018; Luchinat et al., 2017; Luchinat et al., 2020).
4.2 Protein expression in human cells
The HEK293T (ATCC CRL-3216) cell line was used for transient transfection of the vector, following a protocol described previously (Barbieri et al., 2016). Cells were cultured in T75 flask in high-glucose Dulbecco's Modified Eagle Medium (DMEM, Gibco), supplemented with 1% penicillin–streptomycin (Gibco) and 10% fetal bovine serum (Gibco) and were maintained in a humidified incubator at 37°C with 5% CO2. The expression of fluorinated protein was achieved by using a custom-formulated DMEM, prepared in-house following the reported composition of high-glucose DMEM, in which a desired amino acid was replaced with its fluorinated homolog(s). The following fluorinated amino acids were employed (the concentration in DMEM is reported for each): 6-fluoro-L-tryptophan (6FW, 80 μM, Sigma-Aldrich), 5-fluoro-L-tryptophan (5FW, 80 μM, Fluorochem), 4-fluoro-L-phenylalanine (4FF, 400 μM, Thermo Fisher Scientific), 3-fluoro-L-tyrosine (3FY, 600 μM, Fluorochem). The in-house DMEM was supplemented with 100 μg/mL of penicillin–streptomycin (Life Technologies) and 2% (v/v) of fetal bovine serum (FBS, Life Technologies), as previous described (Pham et al., 2023). The medium was additionally supplemented with 10 μM ZnSO4 for the expression of CA2 and CCS-D2. The cells were transiently transfected with vector using polyethylenimine (PEI, Sigma-Aldrich) at a ratio of 1:2 (25 ug DNA:50 ug PEI) (Barbieri et al., 2016). Subsequently, two sets of experimental conditions were employed to investigate the incorporation of fluorinated amino acids on protein expression. In the first set of experiments, cells were initially incubated in in-house DMEM containing non-fluorinated amino acids. After an interval of time ranging from 8 to 24 h, the medium was replaced with in-house DMEM, in which one nonfluorinated amino acid was replaced with the corresponding fluorinated amino acid. The cells were then incubated in the fluorinated medium for an additional period of time, reaching a total expression time of 48 h. For the 2D 1H-15N NMR experiments, 13C, 15N-Histidine (13C,15N-His) was supplemented to the in-home DMEM and two different conditions were employed, in which the labeled histidine was added to the medium either during the medium switch or immediately after transfection for the entire duration of protein expression. In the second set of experiments, cells were immediately incubated after transfection in in-house DMEM containing a mixture of corresponding non-fluorinated and fluorinated amino acid in different ratios (see Results). Cells were incubated in this medium for a total of 48 h. For the 2D 1H-15N experiments, 13C,15N-His was added to the medium at the same time as the mixture of amino acids, and it was present for the entire duration of protein expression. An additional expression condition was conducted in which cells were incubated in-house DMEM containing 3FY instead of natural tyrosine immediately after transfection for a period of 48 h.
4.3 Preparation for cell lysate NMR spectroscopy
Proteins were expressed in HEK293T cells for a period of 48 h. Following expression, cells were harvested, and the pellet was lysed in 150 μL PBS using the freeze–thaw lysis method. Subsequently the soluble lysate was transferred into a 3 mm NMR tube and then analyzed by NMR spectroscopy in presence of 10% of D2O.
4.4 CA2 purification
Fluorinated CA2 was expressed from HEK293T and purified by affinity chromatography, by adapting a previously reported protocol (Banerjee et al., 2004). Briefly, transfected cells from three identical T75 flasks were lysed in 150 μL each by the freeze–thaw method, and the resulting lysates were pooled together and diluted with binding buffer (20 mM Tris, pH 8) to a final volume of 3 mL. The protein was purified using a Ni-NTA column; the elution was performed in steps, each consisting of 3 mL of binding buffer solution containing an increasing concentration of imidazole. CA2 was eluted at 20 mM of imidazole. The protein was buffer-exchanged into 10 mM HEPES at pH 6.8 and concentrated to a final volume of 500 μL.
4.5 19F NMR spectroscopy on purified protein
Each purified protein was transferred into a 5 mm NMR tube with 10% of D2O for a total volume of 550 μL for 19F NMR analysis. 19F NMR experiments were recorded at 310 K on a 14.1 T (600 MHz 1H) Bruker Avance III spectrometer equipped with a room-temperature SEL-HP probe tuned at 564.6 MHz for 19F detection. The zg Bruker pulse program was used consisting of a single 90° pulse followed by FID acquisition. Each sample was analyzed with a series of 28-min spectra with 1280 scans each, and an interscan delay of 1 s. TopSpin 4.2.0 (Bruker) was employed to process the spectra. The 1D spectra were processed using 10 Hz exponential line broadening and phase correction, and were summed together, followed by polynomial baseline correction to remove strong baseline distortion arising from polytetrafluoroethylene (PTFE) components inside the probe. The 19F chemical shift scale was referenced to trichlorofluoromethane (CFCl3) by setting the signal of trifluoroacetic acid (TFA) in an external reference sample to −76.55 ppm.
4.6 1H-15N cell lysate NMR spectroscopy
NMR spectra of cell lysates containing CA2 labeled with 13C,15N-His were collected at 310 K on a 900 MHz Bruker Avance HD spectrometer or a 950 MHz Bruker Avance III spectrometer, both equipped with a 5-mm TCI CryoProbe. Each sample was analyzed with three 1H-15N BEST-TROSY spectra with 256 scan and an interscan delay of 0.25 s each, resulting in a total acquisition time of 9 h. The 2D BEST-TROSY spectra were processed and summed together in Topspin 4.2.0.
4.7 Integration of histidine cross peaks in 2D BEST-TROSY spectra
The integration of cross peaks in the 2D spectra was performed using TopSpin 4.2.0 software (Bruker). The integration region for both cross peaks of each histidine was kept consistent. The sets of cross peaks with higher intensity and better separation were chosen for integration. As a result, for samples 4FF-CA2, 5FW-CA2, and 6FW-CA2, the cross peaks arising from histidine 107 were integrated, whereas for sample CA2-3FF, the cross peaks arising from histidine 96 were integrated. For error calculation, the background noise of the spectra was sampled with the integration region the same size as above, and the standard deviation of the noise was computed using Excel (Microsoft).
4.8 Sample preparation for MS analysis
The levels of non-fluorinated and different fluorinated proteoforms of CA2, DJ1, and CCS-D2 were assessed by direct MS on soluble cell lysates under denaturing conditions (Vimer et al., 2020). CA2, DJ1, and CCS-D2 were expressed in HEK293T using a T25 flask (Greiner Bio-One). For all incorporation conditions, the used materials and reagents were scaled down three times with respect to the expression in T75 flask. Cells were harvested 48 h after transfection. Cell pellets were collected, washed once in PBS and then in 500 mM ammonium acetate. Prior to MS analysis, each cell pellet was lysed in 290 μL of 500 mM ammonium acetate by freeze–thaw lysis. The soluble lysates were subsequently separated by centrifugation at 14,000 g at 4°C for 15 min.
4.9 Direct MS and LC–MS
For CA2 and DJ1 analysis, the collected lysates were diluted 10- to 50-fold in 20% acetic acid and directly sprayed into a modified Q-Exactive Plus Orbitrap EMR mass spectrometer (ThermoFisher Scientific) (Ben-Nissan et al., 2017), using gold-coated nano-ESI capillaries prepared in-house, as previously described (Kirshenbaum et al., 2010). The spectra were recorded using the following instrumental parameters: capillary voltage 1.7 kV, the source was operated at a constant energy of 2 V in the flatapole bias and interflatapole lens, resolution of 10,000 m/Δm, interflatapole lens 2.0 V, bent flatapole DC bias 1.8 V with gradient of 11.8 V, high collision dissociation (HCD) energy up to −15 V, and trapping gas pressure of 1.0, corresponding to fore vacuum (FV) of 1.56 mbar, high vacuum (HV) of 3.12e-05 mbar, and ultra-high vacuum (UHV) of 1.46e-10 mbar.
For CCS-D2 measurements, the cell lysates were analyzed by liquid chromatography, using a nanoAcquity UPLC (Waters) coupled to the mass spectrometer, using the HESI source. Proteins from 5 μL of each lysate were separated over a linear gradient of 20%–50% acetonitrile (0.05% formic acid), using a reversed-phase monolithic column (Rozen et al., 2013), at 60°C and at a flow rate of 15 μL/min, over 15 min. MS spectra were recorded using the following settings: capillary voltage 2.9 kV, the source was operated at a constant energy of 2 V in the flatapole bias and interflatapole lens, resolution of 10,000 m/Δm, interflatapole lens 1.9 V, bent flatapole DC bias 1.7 V with gradient of 10 V, HCD energy −15 V, and trapping gas pressure of 0.8 corresponding to FV of 1.64 mbar, HV of 2.67e-05 mbar, and UHV of 1.24e-10 mbar.
4.10 MS data analysis
Mass deconvolution of recorded spectra were carried out using Unidec (v.5.2.1) (Marty et al., 2015). Data were processed with normalization and bin 2.0, and with following Unidec parameters: sample mass every 1 Da, smoothing nearby points—some, suppressing artifacts—some, Gaussian peak shape function, charge smooth width of 1.0, point smooth width of 1.0, maximum 50 iterations, m/z to mass transformation—smart, adduct mass of 1.0 Da, average mass output and native charge offset of ±1000. Deconvoluted masses of CA2, DJ1, and CCS-D2 proteoforms were obtained from the m/z ranges of 850–1200, 750–1400 and 700–3000, and searched in the mass ranges of 29,130–29,400 Da, 19,770–19,990 Da, and 15,900–16,400 Da, respectively. For each expression condition, the intensities of deconvoluted masses of interest were averaged from three technical repetitions. Deconvoluted masses with D-score <60 were inspected manually. The sum of intensities of non-incorporated and incorporated proteoforms in each data set were normalized to the total intensity of all detected proteoforms and expressed as percentage.
4.11 Calculation of fluorine incorporation probability
4.12 FAA-CA2 crystallization, data collection, and structure calculation
3FY-CA2 (ST0h), 4FF-CA2 (ST24h) and 5FW-CA2 (ST24h) were crystallized using the sitting drop vapor diffusion technique. A crystallization plate containing 24 pedestals and 24 wells was used. An aliquot of 1 mL of reservoir buffer (100 mM of HEPES, 1.4 M sodium citrate and 1 mM 4-(hydroxymercuri)benzoic acid, pH 7.5) was introduced into each well, providing an optimized environment for crystal growth. Subsequently, 2 μL of a purified protein solution (15 mg/mL in 10 mM HEPES, pH 6.8) was added to the corresponding pedestal, along with 2 μL of the reservoir buffer. The crystallization plate was stored at 20°C and after 3 days crystals had successfully formed.
The dataset was collected in-house, using a BRUKER D8 Venture diffractometer equipped with a PHOTON III detector, at 100 K; the crystal used for data collection was cryo-cooled using 30% ethylene glycol in the mother liquor. The crystal diffracted up to 1.1 Å resolution, but all the structures have been refined at 1.3 Å: they all belong to space group P21 with one molecule in the asymmetric unit (consistent with the vast majority of CA2 entries deposited on the PDB), a solvent content of about 50%, and a mosaicity of 0.3°.
The data were processed using the program XDS (Kabsch, 2010), reduced and scaled using XSCALE and amplitudes were calculated using XDSCONV (Kabsch, 2010). The structures were solved by molecular replacement using a published crystal structure of 6FW-CA2 (ST24h) (PDB 8B29). The successful orientation hand translation of the molecule within the crystallographic unit cell was determined with MOLREP (Vagin & Teplyakov, 2010). The refinement and water molecule fitting were carried out using PHENIX taking full anisotropic displacement parameters into account (Adams et al., 2010). Fluorine occupancies were set to 0.50 and left free to refine along with the B-factors. In between the refinement cycles, the model was subjected to manual rebuilding using COOT (Emsley et al., 2010). The quality of the refined structure was assessed using the program MOLPROBITY (Chen et al., 2010). Data processing and refinement statistics are shown in Table S1. Coordinates and structure factors have been deposited in the PDB under the accession codes 8P6U (5FW-CA2), 8PHL (4FF-CA2), 8Q0C (3FY-CA2). To assess the reliability of the fluorine occupancy, all the structures, including 6FW-CA2, were refined again by fixing the occupancy values to the average fluorine content (3FY-CA2: 0.62; 4FF-CA2: 0.33; 5FW-CA2: 0.28; 6FW-CA2: 0.48), which was determined for each expression condition with Equation (1) using all frequencies of the distribution from MS, including the one with zero fluorine atoms.
AUTHOR CONTRIBUTIONS
Enrico Luchinat: Writing – original draft; writing – review and editing; supervision; conceptualization; methodology; project administration. Azzurra Costantino: Formal analysis; investigation; writing – original draft; writing – review and editing; methodology; visualization. Lan B. T. Pham: Writing – review and editing; formal analysis; investigation; methodology. Letizia Barbieri: Writing – review and editing; investigation; methodology. Vito Calderone: Writing – review and editing; formal analysis; investigation. Gili Ben-Nissan: Writing – review and editing; investigation; supervision; methodology. Michal Sharon: Writing – review and editing; funding acquisition; supervision; methodology; resources. Lucia Banci: Writing – original draft; writing – review and editing; funding acquisition; supervision; conceptualization; resources.
ACKNOWLEDGMENTS
This work was supported by Instruct-ERIC, a Landmark ESFRI project, and specifically by the CERM/CIRMMP Italian Instruct Centre, by iNEXT-Discovery, grant agreement No. 871037, funded by the Horizon 2020 research and innovation program of the European Commission, by Fragment-Screen, grant agreement No. 101094131, funded by the Horizon Europe program of the European Commission, and by the Ministero dell'Università e della Ricerca (MUR) PRIN grant No. 20177XJCHX. We acknowledge the project “Potentiating the Italian Capacity for Structural Biology Services in Instruct-ERIC,” Acronym “ITACA.SB” (Project no. IR0000009) within the call MUR 3264/2021 PNRR M4/C2/L3.1.1, funded by the European Union – NextGenerationEU. Michal Sharon is grateful for the support of an Advanced Grant European Research Council (ERC) (Horizon 2020)/ERC Grant Agreement no. 101092725. Michal Sharon is the incumbent of the Aharon and Ephraim Katzir Memorial Professorial Chair. Open access publishing facilitated by Universita degli Studi di Firenze, as part of the Wiley - CRUI-CARE agreement.


