KEGG tools for classification and analysis of viral proteins
Review Editor: Nir Ben-Tal
Abstract
The KEGG database and analysis tools (https://www.kegg.jp) have been developed mostly for understanding genes and genomes of cellular organisms. The KO (KEGG Orthology) dataset, which is a collection of functional orthologs, plays the role of linking genes in the genome to pathways and other molecular networks, enabling KEGG mapping to uncover hidden features in the genome. Although viruses were part of KEGG for some time, they were not fully integrated in the KEGG analysis tools, because the KO assignment rate is very low for virus genes. To supplement KOs a new dataset named virus ortholog clusters (VOCs) is computationally generated, covering 90% of viral proteins in KEGG. VOCs can be used, in place of KOs, for taxonomy mapping to uncover relationships of sequence similarity groups and taxonomic groups and for identifying conserved gene orders in virus genomes. Furthermore, selected VOCs are used to define tentative KOs for characterizing protein functions. Here an overview of KEGG tools is presented focusing on these extensions for viral protein analysis.
1 INTRODUCTION
The KEGG (Kyoto Encyclopedia of Genes and Genomes) database (Kanehisa et al., 2023) has been developed as a computer representation of biological information systems in the cell and the organism, which is manually created from published experimental data and represented in terms of molecular networks and molecular building blocks. The KEGG database has been used with KEGG mapping tools for uncovering hidden features in biological data (Kanehisa et al., 2022; Kanehisa and Sato, 2020), such as for reconstructing metabolic pathways from genome sequence data. The KEGG database is a generic database that can be applied to any cellular organism, for it is based on functional orthologs called KO (KEGG Orthology) groups, each of which represents manually defined gene/protein function by generalizing experimental knowledge in specific organisms to other organisms.
The KEGG database has also been used for understanding human diseases and drugs with the concept of perturbations. For example, diseases are associated with perturbed molecular networks caused by human gene variants, viruses, other pathogens, and environmental factors. Drugs are treated as different types of perturbants affecting perturbed molecular networks. In view of the increasing importance of viruses, efforts have been initiated to make KEGG a more useful resource for exploring viral proteins and viral perturbations. Unfortunately, due to the lack of experimental evidence less than 5% of viral proteins are currently associated with KOs in comparison to over 50% of proteins in cellular organisms. We have thus developed a new dataset named virus ortholog cluster (VOC) for the purpose of supplementing KOs.
Various methods for inferring orthologs have been reported and resulting ortholog databases are made available (Nevers et al., 2022). However, there are only a small number of databases that contain viral proteins, most of which are not frequently updated (Andrade-Martínez et al., 2022). The KEGG GENES database currently contains 50 million genes including 700 thousand viral genes, from which the SSDB database is generated by SSEACH computation (Pearson, 1998) of sequence similarity scores and best hit relations for all genome pairs. KOs are defined manually and expanded computationally using SSDB, which may be viewed as a huge graph of sequence similarity relations, while VOCs are computationally generated from a subgraph consisting of only viral proteins.
We report here extensions of the KEGG mapping tools published in the Tools 2022 Issue of Protein Science (Kanehisa et al., 2022) and the KEGG genome browser (Kanehisa et al., 2023) released in January 2022, focusing on the analysis of viral proteins. VOCs are used in two ways. One is to expand the repertoire of viral KOs with known functions, but the increase of such KOs will be limited. The other is to enable ortholog-based virus comparison and analysis by integrating VOCs in the KEGG tools.
2 OVERVIEW OF KEGG
KEGG (https://www.kegg.jp) is a collection of manually curated databases for various biological objects summarized in Table 1. Each object (database entry) has a unique identifier called KEGG identifier (kid) and can be retrieved by appending /entry/kid in the URL (Kanehisa et al., 2023). KEGG is a computer representation of biological information systems, consisting of molecular networks in the systems information category, molecular building blocks in the genomic and chemical information categories, and perturbed molecular networks in the health information category (Table 1). The basic architecture of the KEGG database is illustrated in Figure 1 together with the concept of KEGG mapping. The KO database plays the central role of linking genes and molecules to molecular networks. The molecular network objects of KEGG pathway maps and BRITE hierarchies, as well as KEGG modules, are created with KO identifiers (K numbers) as network nodes. Once genes in the genome are assigned K numbers by the KEGG annotation procedure, they can be mapped to KEGG molecular networks to generate organism-specific versions, uncovering metabolic and other features hidden in the genome.
| Category | Biological objects | Database | KEGG identifier |
|---|---|---|---|
| Systems information | KEGG pathway maps | PATHWAY | map number |
| BRITE hierarchies and tables | BRITE | br/ko number | |
| KEGG modules | MODULE | M number | |
| Reaction modules | RM number | ||
| Genomic information | KO functional orthologs | KO | K number |
| Genes and proteins | GENES | <org>:<entry>, [ag|vg|vp]:<entry> | |
| Cellular organisms and viruses | GENOME | T number, gn:<org>, gn:<vtax> | |
| Chemical information | Small molecules | COMPOUND | C number |
| Glycans | GLYCAN | G number | |
| Biochemical reactions | REACTION | R number | |
| Reaction class | RC number | ||
| Enzyme nomenclature | ENZYME | ec:<entry> | |
| Health information | Network variation maps | NETWORK | nt number |
| Network elements | N number | ||
| Human gene variants | VARIANT | hsa_var:<entry> | |
| Human diseases | DISEASE | H number | |
| Drugs | DRUG | D number | |
| Drug groups | DG number |
- Note: <entry>, entry identifier; <org>, KEGG organism code; <vtax>, virus taxonomy ID.
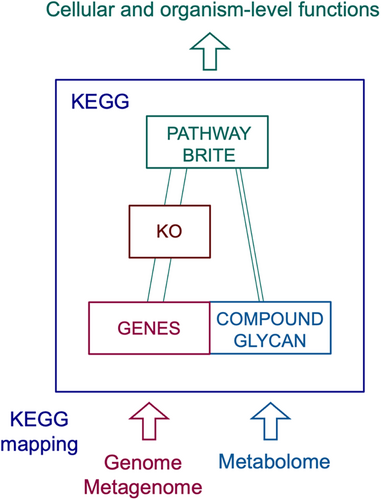
There are other types of KEGG mapping. For metabolome data, chemical substances identified by mass spectroscopy, for example, may be given C number identifiers of the COMPOUND database to map to KEGG metabolic pathways. For metagenome data, taxonomy mapping may be applied to uncover organism groups and virus groups involved. Table 2 summarizes protein analysis tools in KEGG, including KEGG mapping tools (Kanehisa et al., 2022; Kanehisa and Sato, 2020), automatic KO assignment servers (Kanehisa et al., 2016), and KEGG Genome Browser for synteny analysis (Kanehisa et al., 2023).
| Page | URL | Tool |
|---|---|---|
| KEGG Virus | www.kegg.jp/kegg/genome/virus.html | Interface to virus data in KEGG including VOC search tool |
| KEGG Annotation | www.kegg.jp/kegg/annotation/ | Introduction to KO annotation and ortholog table and module table tools |
| KEGG Taxonomy | www.kegg.jp/kegg/genome/taxonomy.html | Taxonomy mapping using Brite hierarchy viewer |
| KEGG Synteny | www.kegg.jp/kegg/genome/synteny.html | Conserved gene order (synteny) analysis using KEGG genome browser |
| KEGG Mapper | www.kegg.jp/kegg/mapper/ | A suite of KEGG mapping tools |
| BlastKOALA | www.kegg.jp/blastkoala/ | Automatic KO assignment by BLAST search |
| GhostKOALA | www.kegg.jp/ghostkoala/ | Automatic KO assignment by GHOSTX search |
3 VIRUS DATA IN KEGG
Virus data are part of many databases in KEGG. Viral genomes and gene sets are taken from the NCBI RefSeq database (O'Leary et al., 2016) together with virus taxonomy data from the NCBI Taxonomy database (Schoch et al., 2020), which is based on the ICTV (International Committee on Taxonomy of Viruses) classification system (Lefkowitz et al., 2018). All viral genes are stored in the vg category of the GENES database without distinguishing viral genomes and each identified by the NCBI gene ID, such as vg:43740568 for SARS-CoV-2 spike protein. Certain mature peptides processed from gene products are defined for use in KEGG pathway maps and stored in the vp category of the GENES database, such as vp:43740568-1 for SARS-CoV-2 spike protein S1 peptide. In addition, individual viral genomes can now be distinguished by the NCBI taxonomy ID called the vtax identifier of the GENOME database, such as gn:2697049 for SARS-CoV-2. Virus taxonomy in KEGG uses the NCBI (ICTV) taxonomy supplemented with the Baltimore classes (Baltimore, 1971; Koonin et al., 2021) for the distinction of virus genome types and stored as BRITE hierarchy files, such as br08621 for virus taxonomy with fixed levels of taxonomic ranks.
Other virus related data include functional orthologs of viral proteins in the KO database, viral KO classifications in the BRITE database, KEGG pathway maps for virus infections in the PATHWAY database, virus perturbations of human signaling networks in the NETWORK database, viral infectious diseases in the DISEASE database, and antiviral drugs in the DRUG database. The KEGG Virus page (Table 2) is an interface to these different types of virus data in KEGG.
4 VIRUS ORTHOLOG CLUSTER
- The measure of similarity between two sequences is defined by a modified identity score, min(1, overlap × 2/(aalen1 + aalen2)), where the identity score of the aligned (overlap) region given by SSEARCH is reduced by considering the non-aligned regions.
- For a given protein the GFIT table is used to collect similar proteins above a modified identity threshold.
- For each of the similar proteins the GFIT table is used to collect additional similar proteins. This process is repeated until no addition is made.
In practice, the GFIT tables are processed in the order of the decreasing table size to merge similar tables, effectively performing single-linkage clustering.
Table 3a shows the result of clustering with the modified identity threshold of 30%, 50% and 70% for the vg dataset generated from RefSeq release 218 of May 2023. Each VOC is given an identifier of six-digit number starting with 3, 5, and 7 for the threshold of 30%, 50%, and 70%, respectively. This number is not a stable identifier and will change every time a new RefSeq release is processed. Table 3a also shows the fraction of viral proteins that share similarity with proteins in cellular organisms. When the similarity threshold is 30%, roughly one third of viral protein clusters are shared by cellular organisms. By splitting into seven Baltimore classes in Table 3b the highest and lowest fractions of organism shared clusters are found, respectively, in ssDNA and dsRNA viruses.
| (a) | |||
|---|---|---|---|
| Threshold | 30% | 50% | 70% |
| Number of clusters | 48,127 | 71,444 | 81,428 |
| Number of proteins in clusters | 581,692 | 529,394 | 476,275 |
| Percentage of proteins in clusters | 90% | 82% | 73% |
| Number of proteins in the largest cluster | 40,870 | 1716 | 495 |
| Largest number of GFIT table merges | 41 | 17 | 10 |
| Number of clusters shared with organisms | 15,385 | 7536 | 4750 |
| Percentage of clusters shared with organisms | 32% | 11% | 6% |
| (b) | |||||
|---|---|---|---|---|---|
| Baltimore class | Proteins | 30% clusters | Shared 30% clusters | ||
| I | dsDNA | 632,739 | 46,007 | 15,031 | (32%) |
| II | ssDNA | 6957 | 409 | 187 | (45%) |
| III | dsRNA | 40,870 | 294 | 11 | (3%) |
| IV | +ssRNA | 8926 | 554 | 34 | (6%) |
| V | −ssRNA | 3990 | 398 | 30 | (7%) |
| VI | ssRNA-RT | 338 | 41 | 15 | (36%) |
| VII | dsDNA-RT | 515 | 42 | 11 | (26%) |
| – | Other | 5573 | 742 | 216 | (29%) |
| Total | 660,913 | 48,487 | 15,535 | (32%) | |
The VOC dataset can be searched by keywords including protein name given by RefSeq, virus name, virus family name, Baltimore class, and K number in the KEGG Virus page (Table 2). The result is a list of cluster numbers each associated with the ratio of the number of hits divided by the total number of proteins in the cluster. The list of proteins in each cluster can be viewed by selecting a cluster number. It is still rare that clusters can be associated with KOs, but the need for linking clusters to any functional feature is apparent. Thus, attempts have been initiated to define tentative KOs from selected VOCs using annotations given by RefSeq and original authors who submitted genome sequences. These KOs are not based on published experimental evidence, and placed in the Unclassified category of the KO system.
5 TAXONOMY MAPPING
The KEGG database uses the NCBI taxonomy for classification of cellular organisms and viruses. There are different version of taxonomy files (see KEGG Taxonomy shown in Table 2), which are all represented by BRITE hierarchy files and can be handled with the BRITE hierarchy viewer. Default taxonomy files are br08611 for cellular organisms and br08621 for viruses. Both consist of fixed levels of taxonomic ranks, phylum, class, order, family, genus, and species, as well as realm and kingdom for higher levels in viruses. In addition, the Baltimore classes are associated with the virus taxonomy for viewing genome type differences and corresponding taxonomic branches.
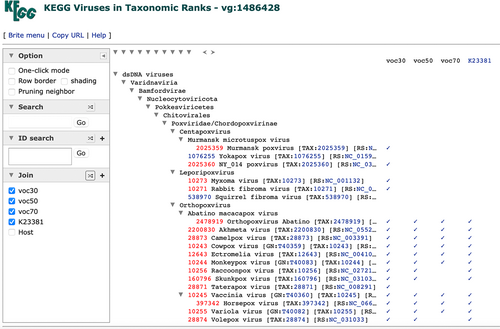
Taxonomy mapping is a procedure to map KEGG organism codes or NCBI taxonomy IDs to a BRITE taxonomy file using the Join capability of the BRITE hierarchy viewer (Kanehisa et al., 2022). In practice, it has been used to examine taxonomic distributions of KOs and modules as can be seen from the Taxonomy button of the KO and module entry pages or from the query interfaces of KEGG Annotation and KEGG Taxonomy (Table 2). Viral proteins are now classified into VOCs, and taxonomy mapping has been extended accordingly. Each virus gene (vg) entry page is linked through the Voc button to a VOC summary page, which displays all members of the three threshold levels of clusters and also allows taxonomy mapping. An example is shown in Figure 2 for vg:1486428, where taxonomic distributions of VOCs and the assigned KO (K23381) may be compared. The same result can be obtained by entering “vg:1486428 K23381” in the query interface of KEGG Taxonomy (Table 2). Note that VOCs can only be specified indirectly by the vg identifier, because the VOC number identifiers are not stable.
6 KEGG GENOME BROWSER
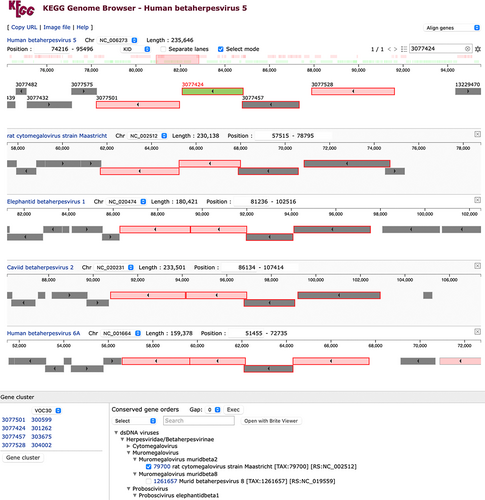
The KEGG genome browser (Kanehisa et al., 2023) is a new tool for viewing and analyzing chromosomal positions of genes in cellular organisms, especially for identifying conserved gene orders, or conserved synteny, among organisms and organism groups under the taxonomic tree (see KEGG Synteny shown in Table 2). Here the genome is viewed as a sequence of genes identified by KOs, or a sequence of K numbers, and conserved gene orders can be found by aligning sequences of matching K numbers. For a given genome and a given location, multiple genomes can thus be aligned according to the conserved gene orders found.
Now the KEGG genome browser allows viral genomes to be treated in the same way, together with the extension to perform the gene order alignment using VOCs in addition to KOs. Figure 3 is an example, where the genome of human cytomegalovirus (human betaherpesvirus 5) is examined around envelope glycoprotein B gene using VOCs at 30% similarity threshold. It is apparent that VOC sequences can capture conserved gene orders in a far more comprehensive way than KO sequences, simply because the KO assignment rate is very low in viruses. Like bacterial genomes viral genomes are known to contain operon structures. Positional links of genes may suggest functional links of proteins.
7 METAGENOME ANNOTATION
There are two servers at the KEGG website available for automatic KO assignment: BlastKOALA suitable for annotation of high-quality genomes and GhostKOALA suitable for analyzing metagenomes (Kanehisa et al., 2016). Since metagenomes of environmental samples usually contain virus data, the GhostKOALA server is briefly described here. GhostKOALA uses the dataset named non-redundant set of pangenome sequences, which is generated from the GENES database by removing redundant (highly similar) sequences for each KO within a family for eukaryotes or within a genus for prokaryotes (Kanehisa et al., 2016). Furthermore, sequences without assigned KOs are selected using CD-hit clusters (Li and Godzik, 2006) and added to the pangenome sequence dataset. For viruses, all RefSeq sequences are used without making a non-redundant set or CD-hit clusters.
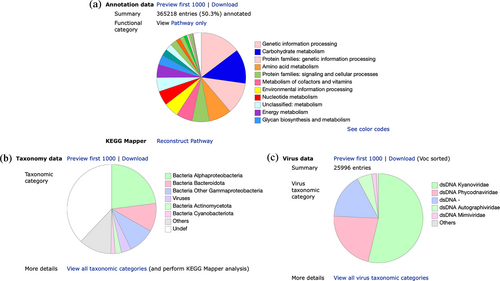
Figure 4 shows the result of GhostKOALA annotation for an environmental sample (T30798) from the Tara Oceans project (Sunagawa et al., 2015). The first pie chart (Figure 4a) is a summary of KO assignment shown in KEGG functional categories. The KO assignment data are linked to KEGG Mapper (Kanehisa et al., 2022) for more detailed analysis. The other pie charts show taxonomic distributions of proteins in the sample for cellular organisms (Figure 4b) and viruses (Figure 4c). The virus pie chart is a new addition and is classified according to the Baltimore class and the virus family. Using the BRITE hierarchy viewer for KEGG virus taxonomy, these families can be associated with host data taken from the virus–host database (Mihara et al., 2016). In this case, hosts of two dominant virus families are photosynthetic organisms; Kyanoviridae associated with cyanobacteria and Phycodnaviridae associated with green algae and protist groups of Haptophyta and Stramenopiles.
8 CONCLUDING REMARK
The procedure to define KOs generally involves three steps. First, experimentally characterized proteins are identified. Second, they are used as seed sequences to manually define KO groups with appropriate, thus different, threshold levels of sequence similarity. Third, the groups are computationally expanded to cover the entire set of KEGG organisms. In order to link VOCs to functional features, temporary KOs are being defined for viral proteins by relaxing the condition of the first step. Instead of relying on published experimental evidence, annotations given by RefSeq and the original authors are used as functional information. The second and third steps remain the same. Appropriate threshold levels in the second step are usually determined by the specificity of functions depicted in the pathway maps, but for the temporary KOs taxonomic grouping of viruses is used. The daily updated statistics of virus KO assignments are shown in the KEGG Virus page.
AUTHOR CONTRIBUTIONS
Zhao Jin: Data curation (lead); resources (supporting). Yoko Sato: Software (equal); resources (supporting). Masayuki Kawashima: Software (equal); resources (supporting). Minoru Kanehisa: Conceptualization (lead); project administration (lead); resources (lead); writing - original draft preparation (lead).
ACKNOWLEDGMENTS
The KEGG project is partially supported by the NBDC Database Integration Coordination Program JPMJND2203 of the Japan Science and Technology Agency. Computational resources were provided by the Bioinformatics Center, Institute for Chemical Research, Kyoto University.
CONFLICT OF INTEREST STATEMENT
None.


