Comparison of intrinsic dynamics of cytochrome p450 proteins using normal mode analysis
This article was published online on 30 June 2015. An error was subsequently identified and corrected on 19 November 2015.
Abstract
Cytochrome P450 enzymes are hemeproteins that catalyze the monooxygenation of a wide-range of structurally diverse substrates of endogenous and exogenous origin. These heme monooxygenases receive electrons from NADH/NADPH via electron transfer proteins. The cytochrome P450 enzymes, which constitute a diverse superfamily of more than 8,700 proteins, share a common tertiary fold but < 25% sequence identity. Based on their electron transfer protein partner, cytochrome P450 proteins are classified into six broad classes. Traditional methods of protein classification are based on the canonical paradigm that attributes proteins’ function to their three-dimensional structure, which is determined by their primary structure that is the amino acid sequence. It is increasingly recognized that protein dynamics play an important role in molecular recognition and catalytic activity. As the mobility of a protein is an intrinsic property that is encrypted in its primary structure, we examined if different classes of cytochrome P450 enzymes display any unique patterns of intrinsic mobility. Normal mode analysis was performed to characterize the intrinsic dynamics of five classes of cytochrome P450 proteins. The present study revealed that cytochrome P450 enzymes share a strong dynamic similarity (root mean squared inner product > 55% and Bhattacharyya coefficient > 80%), despite the low sequence identity (< 25%) and sequence similarity (< 50%) across the cytochrome P450 superfamily. Noticeable differences in Cα atom fluctuations of structural elements responsible for substrate binding were noticed. These differences in residue fluctuations might be crucial for substrate selectivity in these enzymes.
Abbreviations
-
- BC
-
- Bhattacharyya coefficient
-
- CYP
-
- cytochrome P450
-
- DCCM
-
- dynamic cross-correlation matrix
-
- NMA
-
- normal mode analysis
-
- PDB
-
- protein databank
-
- RMSIP
-
- root mean squared inner product.
Introduction
Cytochrome P450 (CYP) enzymes are thiolate-coordinated hemeproteins. The CYP superfamily, which is one of the most functionally diverse superfamilies, is distributed across all three kingdoms of life.1 These enzymes are most commonly monooxygenases and catalyze the reaction of a wide-range of structurally diverse substrates of endogenous and exogenous origin. The CYP enzymes are involved in bioactivation, detoxification, drug metabolism, and biosynthesis of cellular compounds like hormones and cholesterol.2 The majority of CYP enzymes require an electron transfer protein partner to deliver electrons to the heme iron from NADH or NADPH for catalysis. CYPs can be classified into six broad classes based on the nature of electron transfer systems: bacterial, CYB5R/cyb5, FMN/Fd, microsomal, mitochondrial, and P450 only.3 In microsomal CYP systems, a cytochrome P450 reductase (CPR, POR, or CYPOR) is responsible for the transfer of electrons from NADPH to the CYP. Microsomal systems may also employ one of the two electrons from cytochrome b5 following its reduction by a cytochrome b5 reductase (CYB5R). However, in cases where both electrons are supplied to the CYP from the cytochrome b5, the CYP is considered a member of the CYB5R/cyb5/P450 system. Mitochondrial CYPs utilize adrenodoxin and adrenodoxin reductase to transfer electrons from NADPH, and bacterial CYPs likewise utilize ferredoxin and ferredoxin reductase. The unique FMN/Fd CYPs are multifunctional enzymes with a FMN-binding reductase domain fused to the common heme-binding domain. The last group of enzymes, P450-only systems, is unique in that they do not require external reducing power from an electron transport partner protein and they do not require molecular oxygen for catalysis.3 P450-only proteins are considered part of the CYP superfamily based on sequence and structural similarities.
Proteins in the CYP superfamily share a conserved tertiary fold consisting of 12–13 main helices along with four β sheets designated as A–L and β1–β4, respectively (Fig. 1).4, 5 The protoporphyrin IX heme is located between the I and L helices, which, along with helices J and K, belong to the helix bundle that constitutes the conserved CYP structural core. Within this structural core, three residues were originally thought to be absolutely conserved among CYP proteins.6 Two of these conserved residues, a glutamic acid (E) and an arginine (R) of the EXXR motif, are located in the K helix and are involved in salt bridge interactions that influence the final CYP tertiary structure and incorporation of the heme cofactor.7, 8 However, it was recently discovered that the CYP 157 gene family does not retain the EXXR motif. This finding reduced the number of universally conserved residues in the CYP superfamily to one cysteine residue.6 The invariant cysteine (C) residue constitutes the fifth ligand to the protoporphyrin IX heme and belongs to a stretch of ten amino acids known as the P450 signature sequence (FXXGX(H/R)XCXG) residing near the amino terminus of the L helix (Fig. 2). The phenylalanine (F), glycines (G), and histidine (H)/arginine (R) residues are generally, but not absolutely conserved in this motif.9 All CYP proteins also contain a highly conserved coil motif known as the meander, which is located on the proximal face of the protein (Fig. 1). More variable regions of CYPs are responsible for substrate specificity and redox partner binding. Known variable regions include helices B, C, F, and G and their adjacent loops (Fig. 1). The center of the I helix is known to be important for substrate binding as well, but is still a generally conserved region among CYPs.5
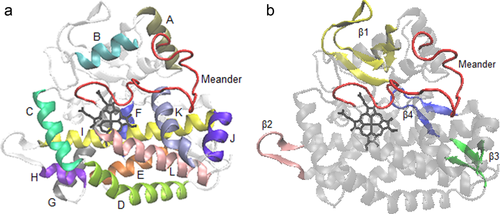
Conserved structural elements of CYP proteins shown in the structure of the bacterial protein CYP eryF (1Z8O). (a) Alpha helices A through L and the meander motif are labeled; (b) Beta sheets β1 through β4 and the meander region are labeled.
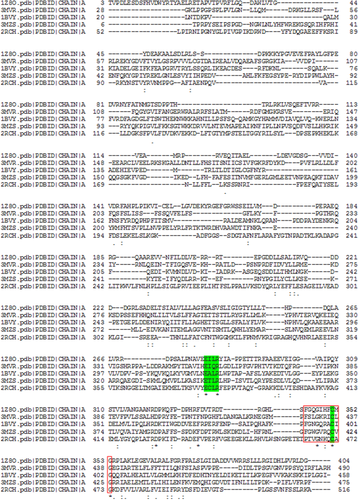
The multiple sequence alignment (MSA) of five representative CYP proteins, one from each class of CYP proteins. The MSA was obtained from the Clustal Omega program. The highly conserved heme-ligating cysteine residue and EXXR motif are highlighted in green and the P450 signature motif FXXGX(H/R)XCXG is boxed.
Although these enzymes share common structural properties (Fig. 1), they often share < 25% sequence identity [Eq. 1] and < 50% sequence similarity [Eq. 2].10, 11 Even though the overall folding is highly conserved among CYP proteins, there exist variability in CYP substrates and catalytic functions. It has been known that protein dynamics play a key role in molecular recognition and catalysis.12-16 Specifically, collective intrinsic dynamics is suggested to be significant in promoting a preorganized active site conformation that is conducive to molecular recognition and effective catalysis.17, 18 Thus, it seems quite relevant to explore the intrinsic dynamics of CYP proteins and examine if there exists any differences in dynamic properties between different classes of P450 systems, which share a conserved tertiary fold but display a unique mechanism of substrate recognition. In the present study, we have utilized normal mode analysis (NMA) to characterize the intrinsic mobility patterns of various CYP proteins in relation to their conserved and variable sequence and structural elements.
Results
Three representative proteins from each CYP class were chosen for analysis in this study, with the exception of the FMN/Fd system. Although FMN/Fd system and similar systems have been identified in several bacterial species,19 crystallographic structural data is currently unavailable for these proteins. Thus, the PDB structural files and FASTA formatted sequence files, obtained from the Protein Data Bank,20 for fifteen total CYP enzymes were used in the present study. The PDB codes of proteins used are provided in Table 1 and proteins are referred to by their PDB codes hereafter.
| CYP system | Protein | Species | PDB code |
|---|---|---|---|
| Bacterial | Heme-thiolate protein (CYP125A3) | Mycobacterium smegmatis | 4APY |
| Cytochrome P450 eryF (CYP107A1) | Saccharopolyspora erythraea | 1Z8O | |
| Monooxygenase (CYP107L1) | Streptomcyes venezuelae | 2BVJ | |
| CYB5R/cyb | Sterol 14-α-demethylase (CYP51) | Trypanosoma brucei | 3G1Q |
| Cytochrome P450 2D6 (CYP2D6) | Homo sapiens | 2F9Q | |
| Cytochrome P450 2B4 (CYP2B4) | Oryctolagus cuniculus (European rabbit) | 3MVR | |
| Microsomal | Cytochrome P450 2C5 (CYP2C5) | Homo sapiens | 1PQ2 |
| Cytochrome P450 BM-3 (CYP102A1) | Bacillus megaterium | 1BVY | |
| Cytochrome P450 3A4 (CYP3A4) | Homo sapiens | 1W0E | |
| Mitochondrial | 1,25-dihydroxyvitamin D(3) 24-hydroxylase (CYP24A1) | Rattus norvegicus | 3K9Y |
| Cytochrome P450 2E1 (CYP2E1) | Homo sapiens | 3E4E | |
| Cytochrome P450 11A1 (CYP11A1) | Homo sapiens | 3MZS | |
| P450 only | Prostacyclin synthase (CYP8A1) | Homo sapiens | 2IAG |
| Allene oxide synthase (CYP74A) | Arabidopsis thaliana | 2RCH | |
| Nitric oxide reductase (CYP55) | Fusarium oxysporum | 1CL6 |
The conservation of the overall tertiary structure of CYP proteins can be observed in Figure 3, where proteins from different CYP classes were visualized using Visual Molecular Dynamics (VMD) software. Structural similarity was also found from the pairwise structural comparison for the same set of proteins; the root-mean-square-deviation (RMSD) varies from 2.8–3.6 Å (Tables 2 and 3). The coarse-grained elastic network model (ENM)-based NMA revealed some important dynamic features of these proteins. The dynamic cross-correlation matrix (DCCM) [Eq. 6] obtained from the single NMA analysis of individual proteins revealed strikingly similar patterns of correlated/anticorrelated motions among all of the CYPs studied (Fig. 4). The submatrices obtained by considering residues that are within 5 Å of the cofactor heme for these proteins revealed the existence of highly correlated motions between the critical cysteine residues within the FXXGX(H/R)XCXG catalytic motif and residues within the heme binding pocket (Fig. 5, Supporting Information Table S1). Patterns of the correlated motions between residues surrounding the heme cofactor are very similar across CYP family as shown in Figure 5. However, close scrutiny of these DCCMs revealed some noticeable differences in correlated motions between residues in the heme binding pocket.
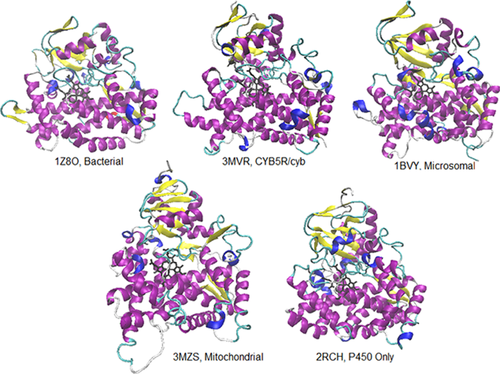
Five CYP proteins, each from a different class of CYP electron transport system. Proteins are designated as their PDB codes.
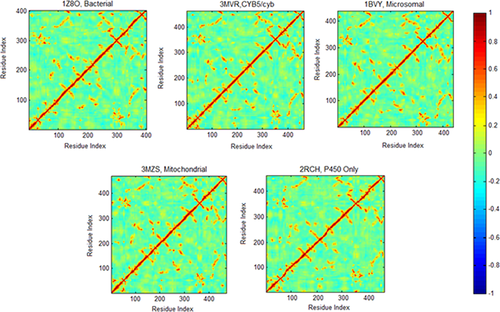
DCCM plots obtained from the combined 200 modes showing correlations between the motions of Cα atoms in each representative protein from different P450 systems. Both axes of a matrix are the amino acid residue index. Each cell in a matrix shows the correlation between the motions of two amino acid residues (Cα atoms) in the protein on a range from −1 (anticorrelated, blue) to 1 (correlated, red), with 0 conferring no correlation. The residue number 1 in the DCCM of 1Z8O, 3MVR, 1BVY, 3MZS, and 2RCH corresponds to residue number 3, 28, 20, 6, and 52, respectively.
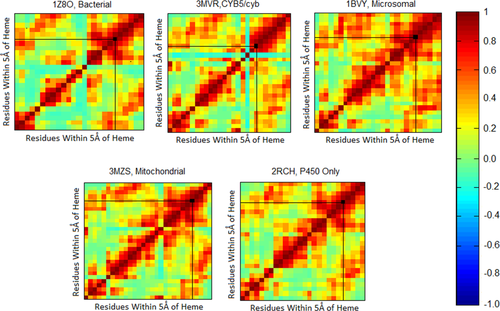
DCCM plots showing correlated motions between the Cα atoms of residues within 5 Å of the heme cofactor of the five CYP proteins. Each protein belongs to a different class of CYP proteins. The location of the invariable cysteine residue in each matrix is shown as a black square along the diagonal.
| CYP classes compared | Structural similarity (RMSD, Å) | % Sequence identity | % Sequence similarity | % Dynamic similarity | ||
|---|---|---|---|---|---|---|
| RMSIP | BC | |||||
| Bacterial | CYB5R/cyb | 3.5 ± 0.3 | 16 ± 1 | 42 ± 2 | 64 ± 6 | 84 ± 1 |
| Bacterial | Microsomal | 3.3 ± 0.2 | 17 ± 1 | 43 ± 4 | 58 ± 6 | 81 ± 3 |
| Bacterial | Mitochondrial | 3.6 ± 0.2 | 16 ± 2 | 40 ± 5 | 62 ± 3 | 83 ± 2 |
| Bacterial | P450 Only | 3.3 ± 0.5 | 19 ± 6 | 43 ± 10 | 63 ±14 | 83 ± 3 |
| CYB5R/cyb | Microsomal | 2.8 ± 0.6 | 26 ± 14 | 56 ± 12 | 61 ± 12 | 85 ± 4 |
| CYB5R/cyb | Mitochondrial | 2.9 ± 0.7 | 24 ± 12 | 55 ± 12 | 69 ± 8 | 87 ± 2 |
| CYB5R/cyb | P450 Only | 3.2 ± 0.3 | 16 ± 2 | 43 ± 4 | 62 ± 6 | 83 ± 1 |
| Microsomal | Mitochondrial | 2.8 ± 0.5 | 25 ± 13 | 52 ± 16 | 63 ± 11 | 85 ± 4 |
| Microsomal | P450 Only | 3.2 ± 0.2 | 16 ± 1 | 43 ± 3 | 55 ± 8 | 81 ± 2 |
| Mitochondrial | P450 Only | 3.4 ± 0.3 | 17 ± 1 | 44 ± 3 | 59 ± 5 | 82 ± 1 |
- Each value represents the average value from all pairwise comparisons between two CYP classes, with three proteins in each class. Thus, each value represents nine individual pairwise comparisons. Dynamic similarity values in terms of RMSIP and BC are given in percentages (RMSIP or BC × 100)
| CYP class | Structural similarity (RMSD, Å) | % Sequence identity | % Sequence similarity | % Dynamic similarity | |
|---|---|---|---|---|---|
| RMSIP | BC | ||||
| Bacterial | 2.3 ± 0.4 | 31 ± 8 | 58 ± 7 | 70 ± 5 | 83 ± 2 |
| CYB5R/cyb | 3.1 ± 0.8 | 28 ± 13 | 57 ± 12 | 65 ± 5 | 82 ± 2 |
| Microsomal | 2.9 ± 0.2 | 22 ± 4 | 53 ± 5 | 49 ± 16 | 80 ± 3 |
| Mitochondrial | 3.4 ± 0.4 | 22 ± 6 | 54 ± 5 | 63 ±12 | 82 ± 3 |
| P450 Only | 3.5 ± 0.5 | 15 ± 2 | 38 ± 5 | 53 ±5 | 79 ± 2 |
- Each value represents the average value from the pairwise comparisons of three proteins within each CYP class. Dynamic similarity values in terms of RMSIP and BC are given in percentages (RMSIP or BC × 100). Sequence identity, sequence similarity, structural similarity, and dynamic similarity values for individual pairwise comparisons of proteins within CYP classes are listed in Supporting Information Table S3
Analysis of atomic fluctuation profile of the five representative CYP proteins revealed some variability in their overall flexibility pattern (Fig. 6). The invariable heme-ligating cysteine residue along with the P450 signature motif FXXGX(H/R)XCXG was observed to be located in an area of low flexibility in the atomic fluctuation profile of each protein (Fig. 6). These active site residues were found to exist in close proximity to the less flexible L helix located at the C-terminal end. Helices located closer to the amino-termini exhibited much greater variability in their relation to global fluctuation patterns. The EXXR motif, which was conserved in all observed CYPs (Fig. 2), was likewise found to occupy a local minimum in the fluctuation profile within the K helix. A great variability was found in the fluctuation profiles of individual structural motifs; however, the center of the I helix is consistently located at another area of low backbone flexibility, as is the entire K helix. On the contrary, the J helix contains a small local maximum, followed by a minimum in most CYPs. Structural motifs near the variable region of the CYPs (helices A–G) were more difficult to generalize, especially in relation to the variant locations of global fluctuation maxima. As the collective modes of motion predicted by coarse-grained ENM-based NMA depend on the topology of inter-residue contacts, the observed variation in the atomic fluctuation profiles is related to the number of inter-residue contacts in these proteins (Supporting Information Table S2).
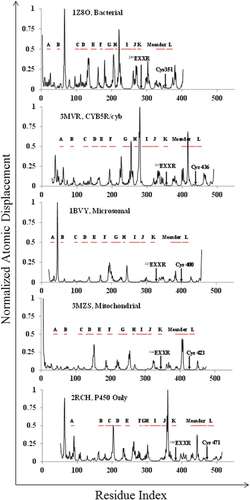
Atomic displacement fluctuations of five CYP proteins, each belongs to a different class of CYP proteins. The x-axis is the residue index according to the aligned protein sequences. The y-axis represents the normalized fluctuation score. Locations of helices A through L and the meander region of each protein are indicated by horizontal red lines in each plot. The critical cysteine residue and EXXR sequence motif are also located along the residue index for each protein.
The quantitative analysis of dynamical similarities between different classes of CYP proteins was accomplished by computing the root mean squared inner product [RMSIP, Eq. 7] and Bhattacharyya coefficient [BC, Eq. 8]. RMSIP measures the similarity of atomic fluctuations between proteins by comparing their 10 lowest normal modes, whereas BC compares the covariance matrices obtained from the normal modes.21-23 Sequence, structure, and dynamic similarity data from comparisons across CYP classes is given in Table 2. The sequence identity values from pairwise comparisons between proteins from different CYP systems ranged from 16% to 26% and the sequence similarity values from the same pairwise comparisons ranged from 40% to 56%. Interestingly, the dynamic similarity, in terms of BC, was found to be significantly higher between different CYP protein families and ranged from 81% between microsomal and bacterial/P450-only proteins to 87% between CYB5R/Cyb5 and mitochondrial proteins. For the same pairs, the RMSIP value varied from 55% to 69%. Pairwise comparisons for sequence and dynamic similarity were likewise completed between CYP enzymes within the same CYP classes (Table 3 and Supporting Information Tables S3 and S4). The sequence identity values ranged from 15% in the P450-only class to 31% in the bacterial CYP class, and for the same classes of CYP proteins, the BC ranged from 79% (P450-only CYP class) to 83% (bacterial CYP class), and RMSIP values ranged from 49% (microsomal CYP class) to 70% (bacterial CYP class).
Discussion
Although the sequence identity between CYP proteins from different P450 systems is low (< 25%), the dynamic similarity between these proteins is much more compelling. With dynamic similarity values of 81% to 87% (BC) and 55% to 69% (RMSIP) (Table 2), the conserved dynamic properties of CYPs are far more suggestive than their conserved sequence properties. While the patterns of correlated motions (DCCM) in CYPs from different classes show strikingly similar dynamic patterns for full-length CYP proteins (Fig. 4), the atomic fluctuation profiles suggest specific areas of dynamic conservation among CYPs (Fig. 6). Helix structures that participate in heme incorporation (I–L) show a greater degree of consistency in their fluctuation profiles than those helices known for their contribution to substrate specificity and redox partner interactions (A–G). These results are not too surprising, in the sense that such a wide variety of CYP substrates (Table 4) and catalytic functions should necessitate a variation in dynamic properties within the CYP superfamily.24-27 Conserved dynamic properties are important in areas near the protoporphyrin IX heme in these proteins to maintain its catalytic function. Specifically, CYPs have been found to retain a highly conserved spatial structural organization in their heme binding domains (Fig. 3), despite a lower extent of sequence conservation (Table 2).10 The pairwise structural comparison between microsomal protein (1BVY) with the proteins from four other classes showed remarkably similar structures within 10 Å of the heme cofactor; the RMSD varies from 1.5 to 2.3 Å only (Table 4). Likewise, the intrinsic dynamic properties within CYP heme binding domains are conserved across classes in the CYP superfamily, where the FXXGX(H/R)XCXG motif resides in an area of low backbone flexibility flanked by one or more flexible sites. The EXXR sequence motif also occupies an area of low flexibility in all CYPs studied. This supports the findings of Yang and Bahar that critical active residues within proteins tend to exist in regions of low flexibility near key mechanical sites.28
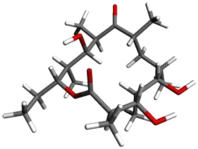
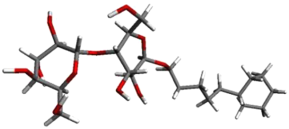
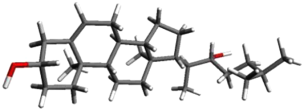
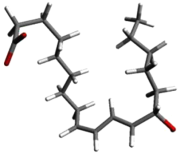
| Proteins | Molecular structure of substrates | RMSD (Å) (full-length protein) | RMSD (Å) within 10 Å of Heme |
|---|---|---|---|
| 1Z8O (Bacterial) | 6-Deoxyerythronolide B
|
3.2 | 1.8 |
| 3MVR (CYB5/cyb) | 5-Cyclohexyl-1-pentyl-beta-d-maltoside
|
3.3 | 1.8 |
| 1BVY (Microsomal) | 1,2-Ethanediol
|
— | — |
| 3MZS (Mitochondrial) | (3α,8α,22R)-cholest-5-ene-3,22-diol
|
2.9 | 1.5 |
| 2RCH (P450 only) | (9Z,11E,13S)−13-hydroxyoctadeca-9,11-dienoic acid
|
2.9 | 2.3 |
- The RMSD of the full-length protein and the heme binding pocket were calculated with respect to the microsomal CYP protein (1BVY.pdb)
Although the patterns of correlated motions found in DCCM plots (Fig. 4) reveal a highly similar dynamic profile for all CYPs, it is interesting to note that the atomic fluctuation profiles for these proteins reveal some striking differences (Fig. 6). For instance, the location of global maxima in atomic fluctuation profiles of the CYPs varies greatly. A fluctuation maximum occurs between the G and I helices in the bacterial protein CYP eryF (1Z8O) and the CYB5R/cyb protein CYP2B4 (3MVR), but not in the mitochondrial protein CYP11A1 (3MZS), the microsomal protein CYP BM-3 (1BVY), or the P450-only protein AOS (2RCH). However, CYP BM-3 exhibits a fluctuation maximum between F and G helices, the P450-only protein has maxima between helices C and D, and the meander region is highly mobile for the mitochondrial protein. Regardless of such differences, the correlated motions of the proteins remain homologous, indicating that the collective differences in atomic fluctuations may compensate for each other to mutually conserve the important functional dynamic properties of the protein. Even where the dynamic properties of certain CYPs might be expected to be unique, certain intrinsic mobility patterns prevail. Such is the case with the P450-only class of CYPs, which do not require external reducing power from a redox partner. These proteins often perform isomerization reactions on fatty acid derivatives containing reduced oxygen. When compared to other CYP proteins, the sequence homology values remain comparable to the rest of the CYPs, but when sequence homology is calculated within the P450-only group itself, the value is much lower than all other classes of CYPs. The averaged sequence identity within this P450 class was only 15%, and the averaged sequence identities of other CYP classes ranged 22% to 31%. The BC and RMSIP values for CYP proteins within the P450-only class was also the lowest among the various CYP classes, except for microsomal CYP class, which has the lowest RMSIP value.
In the present study, the normal mode analysis was conducted using the coarse-grained elastic network model (ENM).29, 30 In ENM-based NMA, a protein is considered as a network of nodes, where each node represents a Cα atom and is connected to another node by a harmonic bond. The spatial arrangement of Cα atoms depends upon the primary sequence of a protein. In other words, the primary sequence of a protein determines its overall folding and dictates its intrinsic dynamics. Therefore, a lower sequence identity between proteins is expected to produce a lower structural/dynamic similarity. As P450-only proteins bear low sequence identities with members of their own class compared with proteins in other CYP classes, it is expected that they will also exhibit lower dynamic similarity when compared within the P450-only class. Although the present study revealed that the dynamic similarities between P450-only and other CYP proteins are slightly higher (interclass, Table 2) than the extent of dynamic similarities among P450-only proteins (intraclass, Table 3), it is observed that the overall dynamic patterns are very similar among all the five classes of CYP proteins (Figs. 4 and 5) and they exhibit distinctly different patterns of motions compared to proteins from different classes, e.g. aminoacyl-tRNA synthetases.31 It can also be noted that the CYP proteins classification is based on their redox partner, and therefore the observed dynamic differences are not entirely unexpected. Because the P450-only proteins do not rely on common interactions with auxiliary electron transport proteins to perform their catalytic function, their sequence, structural, and dynamic motifs are likely more reliant on individual substrate specificity and catalytic mechanism, whereas proteins in other CYP classes maintain conserved properties for interactions with their redox partners. Thus, a greater variability of dynamic properties in the P450-only class of CYPs may be a result of the minimal evolutionary pressure to maintain certain global dynamic properties related to redox partner interactions.
As it has been recently reported that the alignment file obtained from a structural alignment algorithm is more reliable for comparing structure and intrinsic dynamics of proteins,22 multiple sequence alignments in FASTA format were generated using the Mustang program32 and used for the comparative analysis in this study. A comparison was also performed using an alignment file generated from a sequence-based algorithm. In general, lower values of BC and RMSIP were obtained for a specific group of CYP proteins when sequence-based alignment files were used rather than structure-based alignment33 (Supporting Information Tables S3, S4, and S5). However, the overall trend of BC and RMSIP values for CYP proteins remains the same for both Mustang and Clustal Omega generated alignment files.
In conclusion, the present study demonstrated that CYP superfamily proteins display strong dynamic similarities, even though they possess very low sequence identity. Although, overall dynamic patterns are remarkably similar, noticeable differences in the Cα fluctuations of secondary elements of these proteins were observed. Especially, the close scrutiny of DCCMs (Fig. 5) and atomic displacement fluctuation profiles (Fig. 6) of different class of CYP proteins revealed perceptible difference in the patterns of correlated motions between residue fluctuations and the flexibility of Cα atoms of structural elements surrounding the heme cofactor and substrate binding pocket. The CYP enzymes, which are mainly monooxygenases, catalyze reactions involving wide-varieties of substrates, and the local dynamical differences between different classes of CYP proteins are expected to modulate the substrate specificities of these enzymes. All-atom molecular dynamic simulations and spectroscopic studies along with structural characterization of bound and unbound CYP systems have provided some mechanistic details of substrate selection employed by this very important superfamily of enzymes. Crystal structures34, 35 and all-atom molecular dynamic simulations of CYP proteins26, 36, 37 have demonstrated that conformational flexibility of the active site facilitates substrate selection and binding, as well as product release. In particular, it has been observed that the movement of F and G helices and the loop connecting these helices are essential for changing the active site conformation to accommodate wide varieties of substrates. The high flexibility of structural elements surrounding F and G helices has been also noticed in the present work. The combined two-dimensional NMR and MD simulation study also have provided an in-depth description of functional dynamical changes in the context of substrate promiscuity of CYP proteins and have indicated that conformational selection may play an important role in ligand binding.38, 39 Additionally, a very recent 2D-IR spectroscopic study of cytochrome P450 revealed that the fast motions in picosecond timescale facilitate substrate selectivity in CYP proteins.40 These spectroscopic and simulations studies, along with the results of our present study reinforced the role of proteins dynamics in molecular recognition and catalysis. Taken together, the comparative study of the intrinsic dynamics of the five classes of CYP proteins were performed for the first time. The strong dynamic similarities among CYP proteins support the notion that the functional classification of proteins could be accomplished based on their dynamic patterns.
Materials and methods
Proteins sequences and structures
Three representative proteins from each CYP class were chosen for analysis in this study, with the exception of the FMN/Fad system. Although FMN/Fd systems and similar systems have been identified in several bacterial species,19 crystallographic structural data is currently unavailable for these proteins. Thus, the PDB structural files and FASTA formatted sequence files, obtained from the Protein Data Bank,20 for fifteen total CYP enzymes were used in the present study. The PDB codes of proteins used are provided in Table 1 and proteins are being referred to by their PDB codes hereafter. Proteins representing bacterial CYP systems include 4APY, 1Z8O, and 2BVJ; CYB5R/cyb CYP systems include 3G1Q, 2F9Q, and 3MVR; microsomal CYP systems include 1PQ2, 1BVY, and 1W0E; mitochondrial CYP systems include 3K9Y, 3E4E, and 3MZS; and P450-only CYP systems include 2IAG, 2RCH and 1CL6.1, 4, 41-53
VMD software was used for structural visualization.54 Pairwise sequence alignments of representative CYP proteins (chain A sequences) were done using Clustal Omega33 to obtain the sequence identity and sequence similarity between CYP proteins. Multiple sequence alignments of the five representative CYP proteins were also obtained using Clustal Omega.33
Sequence comparison
 (1)
(1) (2)
(2)Structure comparison
Pairwise comparison of CYP protein structures was accomplished using the Dali Server (http://ekhidna.biocenter.helsinki.fi/dali_lite/start).55 Pairwise structural alignment was performed between proteins of a given CYP class, as well as between proteins of different classes. Results of the structural comparison are reported in terms of root-mean-square-deviation (RMSD).
Normal mode analysis
Studies of protein dynamics have been receiving special attention lately for their ability to link protein structure with function.56 The characterization of whole-protein collective motions and domain-specific motions were accomplished using normal mode calculations.57, 58 In recent years, coarse-grained normal mode analysis (NMA) has become a valuable tool for capturing the biologically relevant conformational motions of large proteins. Even though coarse-grained NMA is unable to provide a detailed description of local dynamics that are obtained from all-atom molecular dynamic simulations, coarse-grained NMA has been shown to be equally capable of illustrating the functional global motions of proteins that are defined by the overall architecture.59, 60 NMA-based methods have thus become widely used in the exploration of whole-protein and domain-specific motions of individual proteins, and they have also been used to probe the related dynamic motifs existing within protein superfamilies.31, 61, 62
 (3)
(3) and
and
 are the positions of residues i and j in the current conformation of the protein and the superscript 0 denotes the equilibrium conformation; kij is the force constant for the spring connecting residues i and j. The force constant kij is distance dependent23, 29 and expressed as
 (4)
(4) (5)
(5) (6)
(6)In Eq. (6),
 and
and
 are eigenvectors and eigenvalues of the mth normal mode, respectively. In a correlation matrix,
 value ranges from −1 to +1 and a negative correlation value indicates anticorrelated motion, whereas a positive value identifies correlated patterns of dynamics between two Cα atoms.
Single and comparative normal mode analysis
PDB files were submitted to the online WEBnm@ server63 for single NMA calculations. The dynamic cross-correlation matrices (DCCMs) were analyzed and sub-matrices containing the heme-binding residues of CYPs were created using MATLAB R2006b (The MathWorks Inc., Natick, MA).
The comparative normal mode analyses were performed using CYP proteins from different classes, as well as proteins from the same CYP class65 Aligned FASTA sequence files and corresponding PDB coordinate files were used for comparative NMA. It has been recently reported that the alignment file obtained from a structural alignment algorithm is more reliable for comparing structure and intrinsic dynamics of proteins.22 Thus, the Mustang program,32 which employs the structure-based sequence alignment algorithm was used to generate multiple sequence alignments of CYP proteins. In parallel, the sequence-based alignment files in FASTA format were also generated using Clustal Omega.33 Comparative analyses of the dynamic features were carried out using alignment files obtained from both Mustang and Clustal Omega programs. From these comparative analyses, normalized squared atomic fluctuation profiles and the dynamic similarity [measured as root mean squared inner product (RMSIP) and Bhattacharyya coefficient (BC)]66 were extracted. It has to be noted that for comparing the dynamics of CYP proteins within a given class, multiple sequence alignment files were generated using three representative proteins that were subsequently used for RMSIP/BCcalculations. On the other hand, for calculating the dynamic similarities between different classes of CYP proteins, the multiple sequence alignment was generated using all the 15 proteins and the resultant alignment file and corresponding Coordinate files were used for dynamic analyses.
Atomic fluctuations
The normalized squared atomic fluctuations for each Cα atom in a protein was calculated as the sum of the displacement of each Cα atom along the first 200 modes, weighted by the reciprocal of the eigenvalues.23 The x-axis of an atomic fluctuation profile represents amino acid numbers of the sequence in the structure file (PDB) submitted, while the y-axis represents the normalized displacement corresponding to each amino acid. Peaks in an atomic fluctuation profile correspond to flexible regions of proteins.
Root mean squared inner product
 (7)
(7) represent the eigenvectors of a pair of proteins being compared and i and j represent the mode numbers. The RMSIP values fall between 0 and 1; RMSIP of 1 represents maximum similarity in atomic fluctuations between proteins. In the present work, RMSIPs are represented as percentages to provide us with dynamic similarity values that can be compared with the corresponding sequence homology information.
Bhattacharyya coefficient
 (8)
(8)The dynamic similarity between proteins was obtained by computing the BC [Eq. 8] using the comparative analysis module of webnm@. The BC, which falls between 0 and 1, represents the amount of overlap between the collective dynamics of the aligned proteins; BC of 1 represents maximum overlap. In the present work, BCs are represented as percentages to provide us with dynamic similarity values that can be compared with the corresponding sequence homology information.
Acknowledgment
The authors would like to thank the two anonymous reviewers for providing constructive suggestions on this manuscript.


