Native mass spectrometry and ion mobility characterization of trastuzumab emtansine, a lysine-linked antibody drug conjugate
Abstract
Antibody–drug conjugates (ADCs) are biochemotherapeutics consisting of a cytotoxic chemical drug linked covalently to a monoclonal antibody. Two main classes of ADCs, namely cysteine and lysine conjugates, are currently available on the market or involved in clinical trials. The complex structure and heterogeneity of ADCs makes their biophysical characterization challenging. For cysteine conjugates, hydrophobic interaction chromatography is the gold standard technique for studying drug distribution, the naked antibody content, and the average drug to antibody ratio (DAR). For lysine ADC conjugates on the other hand, which are not amenable to hydrophobic interaction chromatography because of their higher heterogeneity, denaturing mass spectrometry (MS) and UV/Vis spectroscopy are the most powerful approaches. We report here the use of native MS and ion mobility (IM-MS) for the characterization of trastuzumab emtansine (T-DM1, Kadcyla®). This lysine conjugate is currently being considered for the treatment of human epidermal growth factor receptor 2 (HER2)-positive breast cancer, and combines the anti-HER2 antibody trastuzumab (Herceptin®), with the cytotoxic microtubule-inhibiting maytansine derivative, DM1. We show that native MS combined with high-resolution measurements and/or charge reduction is beneficial in terms of the accurate values it provides of the average DAR and the drug load profiles. The use of spectral deconvolution is discussed in detail. We report furthermore the use of native IM-MS to directly determine DAR distribution profiles and average DAR values, as well as a molecular modeling investigation of positional isomers in T-DM1.
Abbreviations
-
- ADC
-
- antibody–drug conjugate
-
- DAR
-
- drug to antibody ratio
-
- HER2
-
- human epidermal growth factor receptor 2
-
- BV
-
- brentuximab vedotin
-
- T-DM1
-
- trastuzumab emtansine
-
- MS
-
- mass spectrometry
-
- IM-MS
-
- ion mobility-mass spectrometry
-
- Q-TOF
-
- quadrupole-time-of-flight
-
- ESI
-
- electrospray ionization
-
- FWHM
-
- full width at half maximum
-
- ATD
-
- arrival time distribution
-
- CCS
-
- collision cross-section.
Introduction
Antibody–drug conjugates (ADCs, also called immunoconjugates) consist of a recombinant antibody covalently bound by a synthetic linker to a highly cytotoxic agent.1 They are being developed as potential cancer treatments, combining the proven antigen-specific selectivity and antitumor activity of mAbs with the potency of highly cytotoxic molecules.2 Antibody–drug conjugates may thus reduce the systemic toxicity associated with traditional chemotherapy through an increased tolerability and reduced systemic exposure. More than 40 ADCs are at the clinical trial stage3 and two are already on the market; brentuximab vedotin (BV, marketed as Adcetris® by Seattle Genetics) is indicated for the treatment of hematological malignancies (Hodgkin lymphoma, systemic anaplastic large cell lymphoma) while trastuzumab emtansine (T-DM1, marketed as Kadcyla® by Genentech/Roche) has been approved for the treatment of human epidermal growth factor receptor 2 (HER2) resistant breast cancer patients.4
Drug conjugation can be achieved via reactions with different amino acid residues or glycans,5 namely, lysine side chain amines, cysteine thiol groups after reduction of the interchain disulfide bonds, or engineered cysteine residues at specific sites in mAbs without disruption of interchain disulfide bonds (ThiomAbs).6 The conjugated drugs already on the market—BV, a cysteine-linked ADC, and T-DM1, a lysine conjugate—are illustrative of the diverse chemical compounds that can be prepared in this way. Cysteine-linked ADCs are typically generated by partial reduction of the interchain disulfides of the antibody before alkylation with the cytotoxic agent, usually via maleimide chemistry.7, 8 This class of ADCs form controlled mixtures of species with a variable number of drug molecules per antibody (or drug-to-antibody ratio, DAR), a different location of the cytotoxic drug for a particular DAR, and a mixture of covalently and noncovalently associated light chain and heavy chain subdomains. Lysine conjugates are most commonly assembled via the formation of amide bonds between the epsilon amino group of endogenous lysine residues and activated esters.9, 10 Monoclonal antibodies have more than 60 surface exposed lysine residues available for reactions but only 32 cysteines, among which 8 only are involved in the interchain disulfide bridges of chimeric, humanized, and human IgG1. Therefore, although the number of drug molecules incorporated on average per antibody is similar,11 lysine conjugation yields a more heterogeneous population than cysteine conjugation does.
Trastuzumab emtansine combines the anti-HER2 antibody, trastuzumab (Herceptin®) with the cytotoxic microtubule-inhibiting maytansine derivative DM1, and is currently being developed for the treatment of HER2-positive breast cancer.9, 12 Out of the 88 lysine residues in trastuzumab, 40 are solvent-exposed. Lysine conjugation of T-DM1 proceeds via the reaction of the antibody with the succinimidyl-4-(N-maleimidomethyl)cyclohexane-1-carboxylate (SMCC) heterobifunctional linker, producing the linker-modified intermediate. DM1, which contains a free thiol group is added in a second step and reacts with the maleimide to produce the thioether-linked drug conjugate. To achieve less heterogeneous ADCs, new conjugates have been developed involving engineered cysteine residues at specific sites, without disruption of the interchain disulfide bonds.13-19 Other site-specific conjugation approaches involve either the use of microbial transglutaminases to specifically transamidate amine-containing drug linkers to glutamine residues,20 or the engineering of unnatural amino acids into the primary sequence of mAbs to provide a chemical handle for conjugation.21, 22
Due to their complex structure and heterogeneity, the biophysical characterization of ADCs presents a significant challenge. To gain an indepth understanding of their structure, as has been described for mAbs,23 top-down, middle-down, and bottom-up approaches are all valuable to study ADCs, respectively at the intact protein level,24 the subdomain level,25 and in terms of peptide maps.26 In addition, a number of orthogonal analytical techniques are also required to determine the three main quality attributes of ADCs, namely the drug load profile and distribution, the average DAR, and the amount of unconjugated mAb. In particular, the average DAR determines the payload that can be delivered to the tumor cell and therefore directly affects both the safety and the efficacy of the treatment. The resulting drug load distribution is also an important characteristic of ADCs because different DARs may result in different pharmacokinetic and/or toxicological properties. In contrast with cysteine conjugates, for which hydrophobic interaction chromatography is the gold standard analytical technique,27 several of these are typically used for the characterization of lysine-ADCs.28, 29 Indeed, lysine-conjugated species separate poorly in chromatographic columns due to their high degree of heterogeneity. Imaged capillary isoelectric focusing can resolve the different drug load species of lysine-linked conjugates, but quantification is confounded by charge associated variants of the antibody intermediate, cross-linking (if present), and potential differences in UV response of the differentially drug-loaded forms.30 Mass spectrometry based techniques are therefore pivotal in the domain, with numerous reports in the literature of MS characterizations of the distribution of lysine-linked conjugates and ADCs.11, 29, 31-33
Following on from our previous work on the reference cysteinyl-linked ADC, BV,24 we show here how native MS and ion mobility spectroscopy can be used to characterize T-DM1.
Results and Discussion
Native versus denaturing MS analysis of intact trastuzumab emtansine
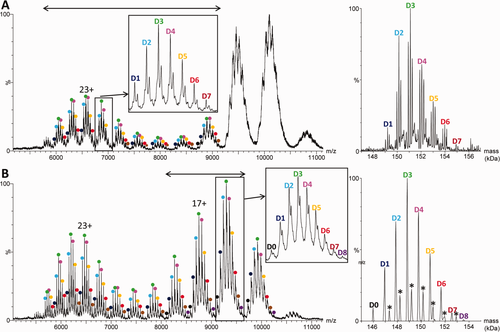
As T-DM1 is a lysine-linked ADC, only covalent species are expected and subsequent LC-MS34 or size-exclusion-chromatography–MS35 analysis in classical denaturing conditions can be used to determine both the average drug load and the drug load profile. To reduce sample heterogeneity, ADCs are usually deglycosylated prior to denaturing MS analysis, leading to the detection of a distribution of both odd and even drug loads. However, since pretreatments should be kept to a minimum in studies of ADCs or mAbs, we first directly analyzed untreated (glycosylated) T-DM1 by denaturing MS. As expected, the resulting raw electrospray ionization (ESI) mass spectrum reveals many overlapping charge states distributions [Fig. 1(A)], reflecting the combination of both glycosylation and drug loading heterogeneities. Further deconvolution is not straightforward, the inability of the algorithms to cope with such heterogeneity leaving many low-abundance drug-load species (e.g., D0, D7, and D8) undetected, while only the major glycoforms of the most abundant conjugates (i.e., G0F/G0F, G0F/G1F, G1F/G1F, and G1F/G2F of D1–D6) are observed. After deglycosylation (see the “Materials and Methods”), the raw mass spectrum is easier to interpret [Fig. 1(B)]. Better deconvoluted spectra are obtained, comprising D0–D7, leading to an average DAR of 3.5 in agreement with Lazar et al.35 However the D8 species are still missing from these spectra, mostly because of overlapping charge state distributions. As described previously,34 the adducts at ∼220 Da visible in Figure 1(B) for each deglycosylated drug-load species correspond to linkers that have modified the antibody but do not contain conjugated DM1 due to a side-reaction.
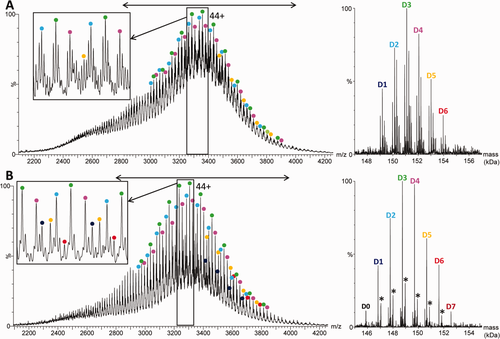
Raw (left) and deconvoluted (right) electrospray ionization mass spectra obtained under denaturing conditions by direct infusion on a Q-TOF instrument of trastuzumab emtansine (A) before and (B) after deglycosylation. The insets show expanded views of the 45+ and 46+ charge states. The mass range considered for deconvolution is indicated by a double arrow. The asterisks indicate +220 Da linker adducts.
In consideration of the many benefits described in the literature that native MS offers for the analytical characterization of noncovalent cysteine-linked ADCs,24, 36, 37 we used this technique on the covalent ADC T-DM1. As expected, the same analysis performed under nondenaturing conditions (150 mM ammonium acetate at pH 7.4, see the “Materials and Methods”) strongly reduces the charge state distribution, such that the different drug load species are more clearly resolved with fewer overlapping ion distributions. After fine tuning of the deconvolution parameters, D1–D6 and D0–D7 are resolved for the nondeglycosylated [Fig. 2(A)] and deglycosylated [Fig. 2(B)] T-DM1 samples, respectively. The average DARs calculated from the individual charge states (see “Materials and Methods”) were 3.1 ± 0.1 and 3.3 ± 0.3 for untreated and deglycosylated T-DM1, respectively, which is in good agreement with the value of 3.5 measured by LC-MS.34 Nonetheless, even for the deglycosylated sample, D8 is not detected, while D0 and D7 are also missing in the spectrum for untreated T-DM1. This is due to the relatively low resolution of the classical quadrupole Q-TOF instruments (R ∼1500 at m/z = 6200) used here. However, since the missing payload contributions compensate each other, the average DARs obtained are fortuitously accurate. Interestingly, D0 species are visible for the highest and lowest charge states (28+, 23+, 22+) in the spectrum of deglycosylated T-DM1 [as indicated by black dots in Fig. 2(B)] but not for those in between, reflecting the partial overlap of the different species and the importance of the choice of the charge states used for deconvolution. Altogether, our results illustrate—as already reported for cysteine-ADC conjugates24—that native MS is a powerful technique for covalent lysine-ADC analysis, even if a certain number of issues remain to be solved. However, due to deconvolution bias, the average DARs deduced from native MS should be determined using deglycosylated (rather than glycosylated) ADCs and from raw (rather than deconvoluted) spectra.
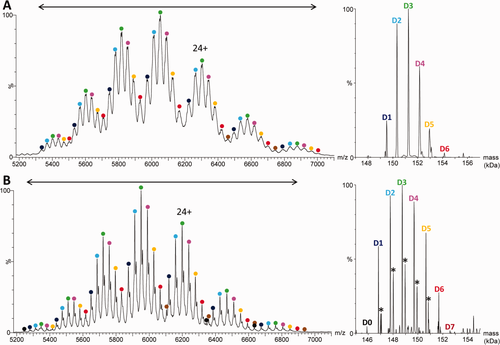
Raw (left) and deconvoluted (right) electrospray mass spectra obtained under native conditions by direct infusion on a Q-TOF instrument of trastuzumab emtansine (A) before and (B) after deglycosylation. The mass range considered for deconvolution is indicated by a double arrow. The asterisks indicate +220 Da linker adducts.
The benefits of high resolution native MS for lysine-linked ADC analysis
To avoid problems arising from overlapping ion signals in the native MS spectra, measurements were performed on a higher resolution mass analyzer. Both untreated and deglycosylated T-DM1 samples were injected into a high resolution orbitrap instrument optimized for native MS analysis.38 As has already been reported for cysteine-linked ADCs,24 at a nominal resolution of 17,500, an effective resolution of ∼2600–3000 at m/z = 6500 was obtained with all glycoforms resolved to the baseline. These measurements [Fig. 3(A)] allowed average DARs to be obtained for each species detected, that is, for the most intense glycoform of each individual charge state. For the most intense charge states, up to seven glycoforms were detected [Fig. 3(A)]. However, the highest Dn species of a given charge state (D7/D8) still overlap with the lowest (D0/D1) from the neighboring charge state. Consequently, the DARs obtained from this spectrum only account for species D0–D6, explaining the rather low average DAR (3.0 ± 0.2, see Table 1) obtained. Even with a high-resolution instrument, the mass distribution of large (150 kDa) molecules, such as T-DM1 intrinsically limits the resolution that can be achieved. Indeed, the full width at half maximum (FWHM) of 24+ or 23+ charge state peaks can reach 1 Th for a 150 kDa molecule. Thus, even at infinite instrument resolution (see Fig. S1 in Supporting Information), the D8 G0F/G1F 24+ peak (m/z = 6495.93) will always overlap with the D1 G1F/G1F 23+ peak (m/z = 6494.10). This means that increasing the effective resolution up to ∼6100 at m/z = 6500 will narrow the peaks, but that a mass resolution of ∼150,000 would be needed to start distinguishing the different isotopes (still with the same isotopic distribution width). As for the untreated sample, the high-resolution native MS instrument provides more clearly resolved spectra for deglycosylated T-DM1 than the Q-TOF instrument. Nevertheless, D8 species are still absent from the deconvoluted spectrum [Fig. 3(B)] measured at a resolution of 17,000, leading to an underestimated DAR of 3.0 ± 0.2.
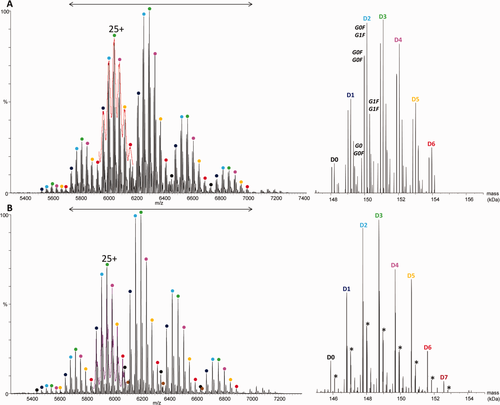
Raw (left) and deconvoluted (right) high-resolution mass spectra obtained under native conditions by direct infusion into an orbitrap instrument (nominal resolution: 17.5 k) of trastuzumab emtansine (A) before and (B) after deglycosylation. The corresponding signals obtained on the Q-TOF instrument are superimposed in (A) red and (B) pink for the 25+ charge state. The mass range considered for deconvolution is indicated by a double arrow. The asterisks indicate +220 Da linker adducts.
| Sample pretreatment | Charge state | Average DARa | |||||
|---|---|---|---|---|---|---|---|
| MS conditions | Instrument | Deglycosylation | Imidazole | Lowest | Highest | From raw data | From deconvolution |
| Denaturing | Q-TOF | − | − | 43+ | 47+ | 3.3 ± 0.1 | 3.3 |
| + | − | 41+ | 48+ | 3.6 ± 0.1 | 3.5 | ||
| Native | Q-TOF | − | − | 22+ | 27+ | 3.1 ± 0.1 | 2.9 |
| − | 10 mM | 17+ | 20+ | 3.0 ± 0.1 | 3.3 | ||
| + | − | 22+ | 26+ | 3.3 ± 0.2 | 3.2 | ||
| + | 10 mM | 15+ | 19+ | 3.5 ± 0.1 | 3.3 | ||
| Q-TOF in IM-MS mode | + | − | 23+ | 25+ | 3.4 ± 0.2 | N/A | |
| Orbitrap 17.5k | − | − | 22+ | 26+ | 3.0 ± 0.2 | 3.0 | |
| − | 20 mM | 18+ | 24+ | 3.3 ± 0.2 | 3.3 | ||
| − | 40 mM | 16+ | 22+ | 2.8 ± 0.3 | 2.5 | ||
| + | − | 22+ | 26+ | 3.0 ± 0.2 | 3.1 | ||
| Orbitrap 35k | + | − | 22+ | 26+ | 3.4 ± 0.2 | 3.4 | |
| + | 20 mM | 22+ | 26+ | 3.3 ± 0.1 | 3.3 | ||
| + | 40 mM | 17+ | 25+ | 3.5 ± 0.1 | 3.4 | ||
- a Values in bold indicate DARs obtained from spectra in which all Dn species were detected.
Combining charge state reduction with high-resolution native MS for the characterization of lysine-linked ADCs
Charge state reduction has been proposed as a means to separate overlapping peaks, which would further improve average DAR calculations from native MS measurements.39, 40 This was achieved here by supplementing the T-DM1 sample with increasing imidazole concentrations. Theoretically, shifting the charge states lower than 20+ should avoid the problem of overlapping peaks described in the previous section. Indeed, for glycosylated T-DM1, the theoretical m/z values for charge states lower than 20+ mean that neighboring D8 and D0 peaks should not overlap (the D8 and D0 peaks, respectively, of the G1F/G1F 19+ G0F/G0F 18+ states appear at 8213.64 and 8226.71 Th, respectively). The same applies for deglycosylated T-DM1 (D8–19+ at 8081.57 and D0–18+ at 8104.46 Th). The charge state reduction method described above leads to a shift of up to 10 charges for both the glycosylated and deglycosylated T-DM1 samples on the Q-TOF instrument (Fig. 4, in comparison with Fig. 2). Imidazole improves both the separation of the different Dn species (Fig. 4 insets) and the desolvation of the samples, leading to sharper peaks within each charge state. However, longer acquisition times are required to compensate for the increase in the number of ionized species and a lower transmission of the charged reduced species at higher m/z values.40 Furthermore, this charge reduction strategy is limited by the fact that lower charge states (at high m/z values) are desolvated less efficiently, as seen for the 14+ to 16+ states in Figure 4(A). Nevertheless, a good compromise can be achieved between the ion transmission, charge reduction, and separation of the different Dn species, allowing unambiguous observation of all of the latter (D0–D8) for deglycosylated T-DM1 [Fig. 4(B)].
Raw (left) and deconvoluted (right) electrospray ionization mass spectra obtained under denaturing conditions by direct infusion on a Q-TOF instrument of trastuzumab emtansine (A) before and (B) after deglycosylation with 10 mM imidazole added for charge reduction. The mass range considered for deconvolution is indicated by a double arrow. The asterisks indicate +220 Da linker adducts.
We next investigated whether the benefits of high-resolution MS and charge state reduction could be synergic for the characterization of T-DM1. In the presence of 20 mM imidazole, the charged species that lead to the overlap of the D0/D1 and D7 peaks of neighboring groups were effectively reduced. At a nominal resolution of 17,500 [Fig. 5(B)], this lead to an average DAR of 3.3 ± 0.2, closer to the expected value (viz. 3.5). Further charge state reduction is observed with 40 mM imidazole [Fig. 5(C)], but the associated decrease in intensity of the peaks, already reported by Mehmood et al.,40 prevents the detection of low abundance D7/D8 species, leading to an underestimation of the average DAR (see Table 1). Because of the lower number of species in deglycosylated T-DM1, this sample could be analyzed at a higher nominal resolution of 37,000. Under these experimental conditions, an effective resolution of 4500 at m/z = 6200 was obtained, allowing the detection of all Dn species. In the absence of imidazole, the deconvoluted mass spectrum obtained from deglycosylated T-DM1 shows the presence of all species from D0 to D7, leading to an average DAR of 3.4 ± 0.2 [Fig. 5(D)]. Adding 20 or 40 mM imidazole enables the unambiguous detection of the D8 species in the deconvoluted mass spectra [Fig. 5(E,F)], with a corresponding average DAR of 3.5 ± 0.1, in agreement with the expected value (Table 1).
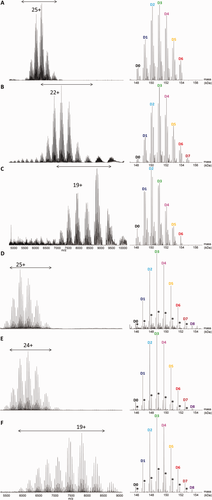
Raw (left) and deconvoluted (right) high-resolution mass spectra obtained under native conditions by direct infusion into an orbitrap instrument (nominal resolution: 17.5 k) of trastuzumab emtansine (A–C) before and (D–F) after deglycosylation, in (A, D) the absence or (B–F) the presence of (B, E) 20 mM and (C, F) 40 mM imidazole. The mass range considered for deconvolution is indicated by a double arrow. The asterisks indicate +220 Da linker adducts.
Native ion mobility MS analysis for average DAR determination of trastuzumab emtansine
Following the determination of the average DAR of the cysteine-linked reference ADC, BV, by IM-MS,24 we set out to analyze the more heterogeneous lysine conjugate T-DM1 with the same approach. A comparison of the IM-MS driftscope plots obtained for deglycosylated trastuzumab and T-DM1 shows that IM-MS provides a direct picture of lysine-conjugate heterogeneity (Supporting Information Fig. S2). The intensity distribution of the arrival time distribution (ATD) peaks corresponding to the Dn species of the most intense 24+ charge state of deglycosylated T-DM1 is similar to that of the corresponding m/z peaks [Fig. 6(A)]. The intensities of the drift peaks extracted for each charge state were plotted across the series for each drug binding stoichiometry and a Gaussian curve was fitted to the resulting distribution [Fig. 6(C)]. The relative intensity of these ATDs indicates the relative abundance of each species. Averaging the semiquantitative IM-MS data among the three most intense charge states (23+ to 25+) gives an average DAR of 3.4 ± 0.2 [Fig. 6(B) and Table 1], in good agreement with the expected value of 3.5, this despite the fact that the D8 species were not detected under these conditions.
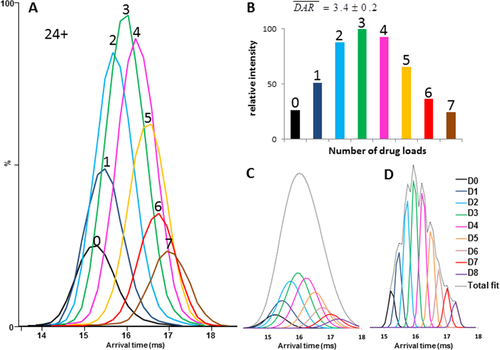
Determining the drug-to-antibody ratio (DAR) of deglycosylated trastuzumab emtansine by ion mobility MS. (A) The arrival time distributions (ATDs) obtained for each Dn species of the 24+ charge state. (B) The drug load as measured from IM-MS. (C) Gaussian fits of the experimental drift traces of the 24+ charge state. The experimental resolution was 20, resulting in a full width of half maximum (FWHM) of 0.83 ms and a separation of the different DARs at 92.5% of the valley. (D) Theoretical Gaussian fits of Dn species generated with a FWHM of 0.23 ms corresponding to an IM resolution of 69 and resulting in separation at 50% of the valley. In order to obtain more symmetric ATDs, the number of drift time bins was increased virtually from 200/cycle to 400/cycle.
Molecular modeling of the trastuzumab emtansine D4 positional isomers
On the basis of these results, IM-MS appears to be a promising analytical technique to characterize positional isomers in both cysteine and lysine conjugates. We have previously reported that positional isomers were not detected for BV, the reference full length cysteine ADC,24 suggesting that current resolutions of IM cells are insufficient for the detection of positional isomers. For deglycosylated T-DM1, the ATDs are resolved at 92.5% of the valley with the IM cell resolution used here [∼20, Fig. 6(C)]. Theoretical simulations of the ATDs indicate that a separation at 50% of the valley would require a resolution of ∼70 (and a higher number of bins per mobility cycle) [Fig. 6(D)].
The current absence in the Protein Data Bank (PDB) of any 3D ADC structural model makes our assumption (that current IM resolution is insufficient) rather difficult to confirm. Here we used a molecular model of the D4 positional isomers of T-DM1 to see how challenging it would be to separate DAR isoforms in a ion mobility cell. This model was generated based on the structure of human IgG1 and on the Fab structure of trastuzumab (PDB IDs 1HZH and 1N8Z, respectively). The theoretical collision cross-sections (CCSs) were calculated with Mobcal (see “Materials and Methods”) for D0 and each isoform from D1 to D4 [Fig. 7(A, B) and Table 2]. The CCS values measured by IM-MS (Table 2) are slightly higher than those calculated from the masses41 but considerably lower than those expected from molecular modeling [Fig. 7(A) and Table 2]. We have already pointed out the latter of these two discrepancies,24 as have others,42 which is rationalized by collapse in the gas-phase, in good agreement with in vacuo molecular dynamics simulations.42 In contrast with the results obtained for BV,24 the values calculated assuming spherical proteins41 do not agree with those measured by IM-MS. Each drug-load binding event induced a CCS increment of ∼25 Å2, which matches the contribution on binding expected from the mass of a single DM1 molecule (Table 2). This suggests that the conformational changes that occur in trastuzumab upon drug binding are very slight. However, the increases in CCS upon drug binding predicted from modeling (∼100 Å2) and from IM-MS (∼25 Å2) do not agree. The surface-exposure of lysine-linked payloads may explain this result. This indeed makes them more susceptible to gas-phase collapse than equivalent payloads in cysteine-linked conjugates.
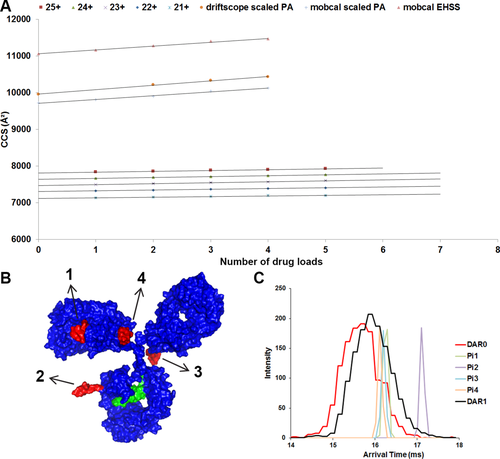
(A) Collision cross-section (CCS) as a function of drug-to-antibody ratio (DAR) measured for the different Dn species of glycosylated trastuzumab emtansine (T-DM1). (B) Molecular model of trastuzumab conjugated with four DM1 payloads (positional isomers Pi1 to Pi4). (C) Comparison of experimental and theoretical arrival time distributions (ATDs). The experimental ATDs for the D0 and D1 species of the 24+ charge state of glycosylated T-DM1 are represented in red and black lines, respectively. The theoretical values corresponding to the increment resulting from the conjugation of the four D1 positional isomers Pi1–Pi4 are represented respectively in green, purple, cyan, and orange. The increments were scaled down with the same scaling factor as measured between the experimental and theoretical CCS values for naked trastuzumab. In order to separate these isomers at 50% of the valley, a virtual resolution of ∼330 was used along with 400 bits/cycle.
| Experimental and theoretical CCSsb, c (Å2) | ΔCCs : theoretical increments from molecular modeling measured with Mobcal (Å2) | ||||||
|---|---|---|---|---|---|---|---|
| Dn | IM-MSd data | Measured from MWsd | Positional isoform (Pi) | Scaled PA | Average scaled PA | EHSS | Average EHSS |
| D1 | 7453 ± 8 (+19) | 6777 (+30) | Pi1 | 62 | 88 | 71 | 92 |
| Pi2 | 82 | 66 | |||||
| 7500 ± 0 | 6852 (+30) | Pi3 | 57 | 56 | |||
| Pi4 | 53 | 177 | |||||
| D2 | 7472 ± 0 (+19) | 6806 (+29) | Pi1 + Pi2 | 136 | 184 (+96) | 189 | 2.09 (+117) |
| Pi1 + Pi3 | 151 | 184 | |||||
| Pi1 + Pi4 | 219 | 254 | |||||
| 7522 ± 8 (+22) | 6881 (+29) | Pi2 + Pi3 | 192 | 192 | |||
| Pi2 + Pi4 | 208 | 243 | |||||
| Pi3 + Pi4 | 197 | 195 | |||||
| D3 | 7504 ± 8 (+32) | 6836 (+30) | Pi1 + Pi2 + Pi3 | 270 | 328 (+144) | 260 | 3.31 (+122) |
| Pi1 + Pi2 + Pi4 | 343 | 360 | |||||
| 7549 ± 8 (+27) | 6910 (+29) | Pi2 + Pi3 + Pi4 | 367 | 345 | |||
| Pi1 + Pi3 + Pi4 | 334 | 358 | |||||
| D4 | 7527 ± 0 (+23) | 6865 (+29) | Pi1+Pi2+Pi3+Pi4 | 402 | 402 (+74) | 398 | 3.98 (+67) |
| 7571 ± 8 (+22) | 6939 (+29) | ||||||
- a Experimental values were obtained from the 23+ charge state by IM-MS on deglycosylated and glycosylated samples.
- b The ΔCCSs per additional payload are indicated in brackets.
- c The values obtained from untreated samples are shown in bold.
- d CCS = 2.435 × M2/3; uncertainty values represent the variability as a result of repeat of injections (n = 3).
Subsequent simulations of the ATDs of the different D1 isoforms indicate that an IM resolution of ∼330 would be necessary to separate them in an ion mobility cell [Fig. 7(C)], indicating that further instrumental developments are required before the quantitative characterization of positional isoforms by native IM-MS becomes a possibility. With the resolution currently provided by commercial instruments, middle-down approaches following partial enzymatic digestion are probably better suited to study subtle structural differences using IM-MS.
Conclusion
We have combined ion mobility with native MS to study the reference lysine-ADC, T-DM1. We demonstrate for the first time the benefits that native MS offers for highly heterogeneous mixtures of covalent species such as T-DM1. This is in keeping with our previous results obtained for the reference cysteine ADC, BV.24 Among the attributes that need to be characterized for ADCs, native MS, and IM-MS provide accurate estimates of the average DAR and of the drug load profile (the number and relative quantitation of each Dn species). In the literature, average DARs are usually calculated after deconvolution of the raw data. Because the results of this procedure depend strongly on the deconvolution parameters (specifically on the selected charge states, intensity threshold, peak width, and mass accuracy, see Supporting Information Fig. S3), calculating average DARs directly from raw data seems a more reliable approach. Bioinformatics tools to facilitate these calculations remain to be developed. In our case, we wrote a simple Excel spreadsheet that automatically extracts the intensity of each peak and then calculates the average DAR for each charge state.
This second paper on the characterization of ADCs by native MS techniques confirms the versatility of native MS for determining average DARs. Native MS is now well-established and easy to implement. Whereas LC–MS runs are time-consuming and produce spectra with many overlapping peaks from highly charged species, the direct infusion of ADCs under native conditions after desalting directly and rapidly provides an overview of the payload distribution.
Antibody–drug conjugates are intrinsically heterogeneous, making their analysis particularly challenging. To overcome problems of overlapping charge states (D0/D1 with the neighboring D7/D8 in particular) that arise even in native MS as a result of ADC heterogeneity, we suggest using a modern high-resolution MS instrument and/or charge reduction compounds (e.g., imidazole) in the desalting buffer. Once more, the average DARs obtained from deconvoluted data should be interpreted with caution since the absence of the least abundant species (e.g., D0/D1 and D7/D8) in the deconvoluted spectra could be misleading. Their respective contributions to the average DAR calculation can compensate one another in some circumstances, such that the value obtained is in good agreement with the theoretical one. This emphasizes the importance of visualizing and analyzing potential overlap between charge states in raw rather than deconvoluted data.
As was observed for BV, the results of this study show that the spectra obtained by native MS are much simpler than those obtained under denaturing conditions. In contrast however with cysteine-linked ADCs, in which an even number of drug molecules are conjugated, the greater heterogeneity of lysine-linked ADCs means that a certain amount of signal overlap is inevitable, even in spectra obtained from high-resolution instruments. In this context, combining high-resolution MS with charge state reduction is beneficial, especially for nondeglycosylated ADCs, the preferred sample form. Indeed, preanalysis sample treatment should be avoided to reduce experimental bias, time, and cost. Thereby, we successfully detected the D8 species of T-DM1 and obtained an accurate average DAR. To the best of our knowledge, this is the first time a glycosylated lysine-linked ADC has been characterized in this way by direct infusion native MS.
Similar to the results obtained for BV,24 this study shows that IM-MS can be used to measure the average DAR and the drug load profile of T-DM1. However, molecular modeling of the D0–D4 species for T-DM1 reveals that an IM cell with a resolving power of at least 300 would be required to distinguish the positional isomers. Middle-down analysis (after partial enzymatic proteolysis) therefore seems the more appropriate approach to characterize these isomers.
Next-generation ADCs may be developed with reduced heterogeneity; however, the heterogeneous ADCs already on the market and in clinical trials already represent significant clinical breakthroughs. In this context therefore, the native MS methods presented here set the foundations for routine, high-throughput bioanalysis of ADCs (in vitro and in vivo), their related products (e.g., from deconjugation43), and their biobetter versions.
Materials and Methods
Sample preparation
Trastuzumab emtansine (Kadcyla®, Genentech/Roche) was deglycosylated by incubation for 30 min at 37°C with IgGZero (1 unit/µg, Genovis, Lund, Sweden). Glycosylated and deglycosylated T-DM1 samples were desalted against 150 mM ammonium acetate (pH 7.4) during five concentration/dilution cycles on a 30 kDa Vivaspin ultracentrifugation device (Sartorius, Göttingen, Germany). For charge state reduction, a 200 mM stock solution of imidazole (Sigma Aldrich, Steinheim, Germany) in 150 mM ammonium acetate was directly added to the buffer up to the desired concentration.
Denaturing and noncovalent mass spectrometry experiments
Mass spectrometry experiments were performed in positive mode, on a Synapt-G2 HDMS Traveling-Wave-Ion Mobility (TWIMS) instrument (Waters, Manchester, UK) and on an Orbitrap Exactive Plus Extended Mass Range mass spectrometer (Thermo Fisher Scientific, Bremen, Germany), both coupled with a Nanomate chip-based autosampler (Advion, Ithaca, USA). The parameters of the instruments were optimized to allow the stabilization and transmission of high molecular weight species. Electrospray ionization was conducted at a capillary voltage of 1.75 kV and a nitrogen nanoflow of 0.55 psi.
Denaturing experiments were acquired on the Synapt G2 instrument only, in the m/z 500–5000 mass range with a sample cone (Vc) of 50 V and a backing pressure of 2.0 mbar. Noncovalent experiments on the Synapt G2 instrument were performed in the m/z 1000–10,000 mass range, with a Vc of 150 V and a backing pressure of 6.0 mbar.
External calibration was performed with 2 µM horse heart myoglobin (Sigma Aldrich, Steinheim, Germany) in H2O/ACN/FA (50/50/1 v/v) for the experiments performed under denaturing conditions, and 2 mg/mL cesium iodide (Sigma Aldrich, Steinheim, Germany) in isopropanol/H2O (1/1) for those performed under nondenaturing conditions.
The measurements on the Exactive Plus EMR instrument were performed as follows. The data were acquired in positive mode for 2 min with the Nanomate, after external calibration in EMR mode with cesium iodide at 0.1 mg/mL (using the heated electrospray ionization source). The in-source collision-induced dissociation was set to 75 eV and the higher-energy collisional dissociation cell was turned off. The automatic gain control target was set to 5 × 10⁵ with nominal resolutions of 17,000 or 35,000, as described in Table 1. The gas pressure in the trap was set to 7.0 mbar and the high-mass species were transmitted with voltages on the inject, inter, and bent flatapoles of 8, 7, and 6 V, respectively.
Ion mobility experiments
Ion mobility MS experiments were performed on a TWIM-MS Synapt G2 instrument (Waters, Manchester, UK). The parameters were optimized with respect to the ion transmission and resolution in the drift cell, with as little gas-phase unfolding as possible: the sample cone, trap collision energy, transfer collision energy, and trap DC bias were set to 100, 2, 15, and 37 V, respectively. The backing pressure was 6.0 mbar and gas flows of 1.5, 130, and 45 mL/min were set in the collision (Ar), helium (He) and mobility cells (N2), respectively. The IM wave height and velocity were 40 V and 950 m/s, respectively. The CCS calculations were calibrated using concanavalin A, pyruvate kinase, and alcohol dehydrogenase (Sigma Aldrich, Steinheim, Germany) desalted against 150 mM ammonium acetate on 0.5 mL Zeba columns (Thermo Scientific, Rockford, USA). The CCS measurements were run in triplicate and the data were analyzed with MassLynx 4.1 and Driftscope 2.2 (Waters, Manchester, UK).
Homology modeling of trastuzumab and of the four payloads
The full trastuzumab structural model was assembled using Discovery Studio 3.0 modeling tools with the CHARMm forcefield (Biovia, France). The full human IgG1 structure (PDB ID 1HZH) and the Fab structure of trastuzumab (PDB ID 1NZ8) serve as template structures. The structure of IgG1 was completed by modeling the unresolved Thr-His-Thr sequence in the hinge region. The hinge region structure was then modified to obtain a more symmetrical structure of the two Fab domains compared with the Fc domain. The two Fab domains were removed and replaced by that of trastuzumab.
A structural model of was prepared for DM1 and four DM1 molecules were arbitrarily grafted on the four more exposed lysine side chains (L1-169, H1-325, L2-190, and H2-305).
Theoretical rotationally averaged collision cross sections
Collision cross-sections were calculated using the Mobcal exact-hard-sphere-scattering (EHSS) and projection-approximation models (PA).44, 45 The projection approximations were scaled by a factor of 1.14 as reported elsewhere.39
Deconvolution and average DAR calculation
The data acquired on the Q-TOF instrument was deconvoluted using the maximum entropy MaxEnt™ algorithm using MassLynx (Waters, Manchester, UK), after background subtraction (polynomial order 25, 2% area beneath the curve), from 145 to 157 kDa and with a minimum intensity ratio of 25% (left and right). The resolution (Da/channel) and uniform Gaussian FWHM were set to the same value, which was however adjusted for each spectrum in order to maximize the number of DARs in the deconvoluted spectra. The data acquired on the orbitrap EMR were deconvoluted using the Manual Respect™ algorithm in the Protein Deconvolution software (version 3.0, Thermo Scientific) with an output mass range of 145–157 kDa, 4 iterations, 1–3 minimum adjacent charges, and both the left and right peak shapes set to 2. The m/z range, the mass tolerance, the charge state range, and the target mass were optimized for each spectrum, in order to maximize the number of DARs in the deconvoluted spectra. In both cases, the charge state ranges used are indicated on the corresponding figures with a double arrow.
The average DARs were calculated, from both the denaturing and nondenaturing MS data, as a weighted average of each drug-load, based on the relative intensities of each peak in the deconvoluted spectra or of each charge state in the raw spectra, with an automated Excel macro developed inhouse and applying Eq. 1. The standard deviations in Table 1 represent the errors that result from averaging the values from each charge state.
 (1)
(1)Similarly, the average DARs from ion mobility MS were calculated as a weighted average of each drug-load, based on the relative intensities of each DAR drift trace, using the same equation but with the intensities of the ATDs used instead of those of the charge states.
ACKNOWLEDGMENTS
This work was supported by the OptimAbs network bioclusters (LyonBiopole and Alsace Biovalley) and sponsors (DGCIS, Oséo, Feder, Région Rhône-Alpes, Région Alsace, the Communauté Urbaine de Strasbourg, the CNRS, and the University of Strasbourg). We thank the GIS IBiSA and the Région Alsace for the financial support in purchasing the Synapt G2 HDMS and the Exactive Plus EMR Orbitrap instruments, respectively.


