EGFR and JAK2 were significant master gene biomarkers in invasive and noninvasive pituitary adenoma
Abstract
The pituitary adenoma (PA) is a common benign tumor of the pituitary gland. Pituitary tumors and healthy tissues, as well as different types of tumors, have distinct metabolite profiles. However, noninvasive to invasive transcriptional alterations, widely assumed to be therapeutic targets, have not yet been characterized. We describe the comprehensive identification of differentially expressed genes (DEGs) between tumors and controls, using microarray data for 70 samples from the Gene Expression Omnibus database, spanning the four most frequent tumor subtypes. There were a total of 940 DEGs unique to prolactin tumors, 437 DEGs unique to nonfunctional tumors, and 217 DEGs shared by all four categories. Many relevant biological functions were altered, as revealed by functional enrichment analysis. Involvement in cell cycle, AGE-RAGE, NF Kappa B, cytokine–cytokine interaction, and B- and T-cell receptors signaling were identified as significant pathways in high-expression genes. In contrast, the extracellular matrix, RAS signaling, breast cancer-related pathways, focal adhesion, RAP1 signaling, axon guidance, and RNA degradation were identified as significant pathways in low-expression genes. Also, EGFR and JAK2 had a prominent role in the invasion of PA. By performing a thorough bioinformatics analysis of the transcriptomics data available for PA, we were able to isolate a subset of metabolically related DEGs that may represent novel and highly promising treatment targets.
1 INTRODUCTION
An estimated 16.7% of the population has a pituitary adenoma (PA), making it the second most frequent primary intracranial tumor.1, 2 Functional adenomas, such as prolactin (PRL)-secreting adenomas, growth hormone (GH)-secreting adenomas, and adrenocorticotropic hormone (ACTH)-secreting adenomas, are distinguished from clinical nonfunctional PAs (NFPAs) by their hormone production patterns.3 PAs negatively impact the quality of life and longevity despite the benign nature of the tumors. Transsphenoidal surgery is typically used as first-line therapy for the four most frequent forms of PA, including those linked with Cushing's disease (ACTH-secreting), acromegaly (GH-secreting), and NFPAs. However, because certain PAs can spread to the cavernous sinus and/or the bone around the sellar area, complete surgical removal is not always possible.3 In addition, there is a lack of success with existing pharmacotherapies. As a result, a fresh approach to therapy is desperately needed.
One of the characteristics of tumor cells is metabolic imbalance.4 There is evidence that PAs, while being benign tumor, undergo metabolic remodeling.5 Mass spectrometry and nuclear magnetic resonance spectroscopy have been used in several investigations to confirm metabolite changes between the PA and healthy tissues or among various tumor subtypes.5, 6 The metabolomics profiles of PAs led researchers to identify many enzymes involved in metabolite differentiation as promising treatment targets.6 As previously demonstrated, the glycolysis enzyme lactate dehydrogenase A is overexpressed in invasive PAs and represents a prospective therapeutic target.7
As transcriptomics methods advanced, many new datasets were made available through public resources, including the Gene Expression Omnibus (GEO) database. These helpful tools provide a chance to investigate the molecular pathophysiology of this intricate illness. For instance, the released transcriptomics data was used to conduct a systematic examination into the various metabolic reprogramming of cancers.8 To date, there has been hardly any transcriptomics study to determine the genes involved in metabolism and the processes that lead to PA formation.
For this analysis, researchers compiled numerous PA-related datasets from GEO databases and incorporated them methodically into a comprehensive gene expression dataset. Then, it screened, annotated, and performed statistical analysis on the differentially expressed genes (DEGs). Many metabolic pathways were found to be enriched in the screened DEGs, leading to the identification of many genes involved in metabolism. These findings suggested that metabolic dysregulation may play a significant role in the development of PA. The pituitary gland, its four hormone subtypes, and the normal pituitary have never before had their transcriptomes analyzed in relation to metabolism. Hence, this study aimed to provide a theoretical framework for understanding critical alterations pathways and creating treatments for PAs based on the biomarkers discovery.
2 METHODS AND MATERIALS
2.1 Selection dataset
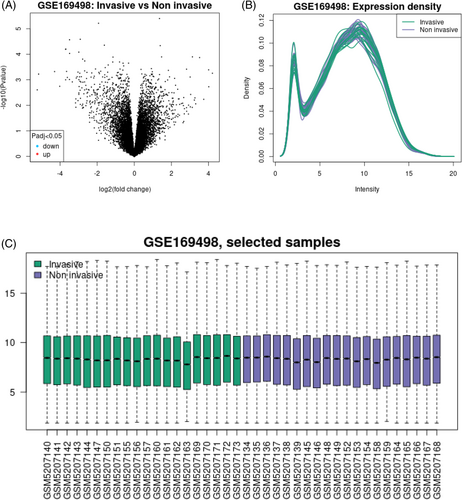
We chose the proper dataset by searching for it in the GEO database. Pathologically, the 70 samples in the GSE169498 microarray dataset represent the disease at various stages, from the earliest, noninvasive ones, to the most advanced, invasive ones. The GPL6947 Illumina HumanHT-12 V3.0 expression beadchip was used to generate this dataset. In this analysis, we compared two groups of PA patients: those in the noninvasive stage and those in the invasive stage. Extra data concerning this repository is displayed in Figure 1.
2.2 Data cleansing and preparation for bioinformatics
To identify DEGs between the noninvasive and invasive stages of PA, we retrieved microarray data (GSE169498) from the GEO database, encompassing gene expression profiles from PA samples at both stages. This dataset was imported into Python using Pandas for data manipulation and Numpy for numerical processing. To ensure comparability across samples, we applied quantile normalization using the Scipy library. Genes with missing expression values were excluded to maintain data integrity.
Differential expression analysis was conducted by comparing expression levels between noninvasive and invasive stages using the statsmodels package in Python, which allowed us to perform linear regression on each gene. For each gene, we calculated the log fold change (LogFC) and the associated p-value to assess statistical significance. The inclusion criteria for DEGs were based on a LogFC threshold of greater than 1 or less than −1, capturing genes with substantial expression differences. Although we did not impose a strict p-value threshold on LogFC, genes with p-values below 0.05 were prioritized for further analysis due to their statistical relevance.
2.3 Gene ontologies and signaling pathways
In the next step, KEGG and Reactome libraries were used to extract the signaling pathways from the gene clusters and uploaded both sets of genes to the Enrichr database. We used the GO collection found in Enrichr and Panther to investigate the GO. Then, we drew the GO interaction network utilizing the ShinyGO database.
2.4 Quantifying the link between protein forms
To learn about the proteins those genes produce, we consulted the STRING database via the NetworkAnalyst database. The proteins crucial to the protein network were then analyzed for their closest protein partners.
2.5 Candidate gene verification in PA samples
The selected genes were analyzed using the GEPIA database, which employed the TCGA and GTEx databases to examine the expression of genes in patient samples, to more accurately corroborate the selected genes from the previous steps and especially the interaction between the protein network. With the use of the GEPIA database, box plots depicting survival and genes expression were created.
3 RESULTS
3.1 Gene expression profiling of PA metastatic progressed from the noninvasive to the invasive phase
According to the expression profiles of the sorted genes, 945 genes had the exceptionally high-expression, whereas 854 genes had low-expression. Thirty-five patients representing each of the two disease stages (noninvasive and invasive) were chosen for this analysis, and their expression profiles were analyzed. Figure 1 displays the PCA diagram classification and data quality. GZMK (logFC = 4.925856), RASSF6 (logFC = 4.6688873), KCNK1 (logFC = 4.5590963), ABCA12 (logFC = 3.43792), and COL11A1 (logFC = 3.4240408) have the highest and FSHB (LogFC = −5.2971564), CLCNK3 (LogFC = −5.534097), GATA3 (logFC = −3.4314338), and TGFBR3L (logFC: −3.38238602) lowest gene expressions, respectively.
3.2 The extracellular matrix, RAS, immunological response, and cell cycle differed dramatically between invasive and noninvasive PA
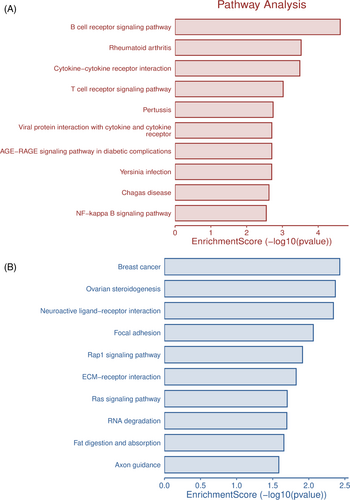
The cell cycle, AGE-RAGE, NF Kappa B, cytokine–cytokine interaction, and B- and T-cell receptors signaling were identified as significant pathways in high-expression genes. In contrast, the extracellular matrix, RAS signaling, breast cancer-related pathways, focal adhesion, RAP1 signaling, axon guidance, and RNA degradation were identified as significant pathways in low-expression genes using the pycharm package from python. The involvement of different sets of genes in different signaling pathways is presented in Figure 2.
3.3 The role of GO in the diagnosis and treatment of early and advanced forms of PA
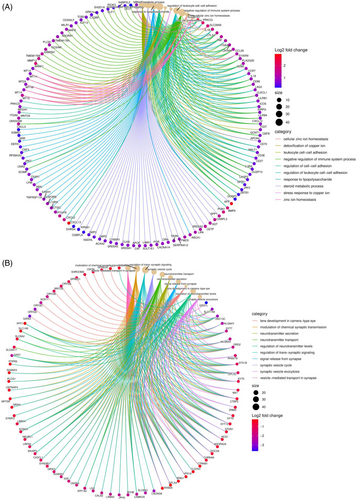
The nature of genes has been investigated using many methods. Here, we compared three different ways of thinking about the interplay between biological processes, molecular functions, and cellular components. Figure 3 shows the results of biological processes and molecular functions. Some of the pathways that showed high-expression were those involved in anatomical structure morphogenesis, regulation of cellular component organization, regulation of the developmental process, actin filament-based process, multicellular organismal process, vasculature development; binding of cytoskeletal proteins, actin, enzymes, extracellular matrix structural constituents, cell adhesion molecules, and kinases. Low-expression genes were found to be involved in a variety of biological processes and molecular functions, including RNA processing, organ nitrogen compound biosynthetic process, mitotic cell cycle, cellular response to stress, peptide metabolic process, nucleic acid binding, structural constituent of the ribosome, transferase activity, mRNA binding, and small molecule binding. The extracellular matrix-related genes were the primary focus of the cellular section. Figure 4A displays the expression of 69 genes involved in the extracellular matrix.
3.4 Noninvasive to invasive PA: protein network correlations impacting the tumor microenvironments
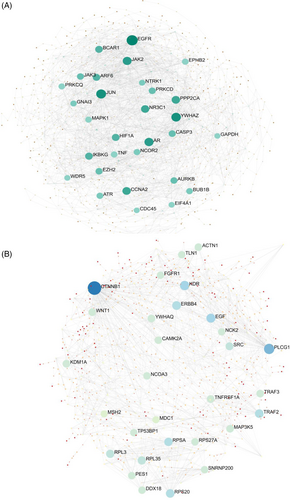
A substantial protein network connecting genes whose protein product is secreted into the extracellular matrix was obtained. This network had 247 protein nodes and 2145 edges, with a protein–protein interaction (PPI) enrichment p-value of less than 1 in 10 (e-16). These genes were identified as crucial in the extracellular matrix receptor interaction, focal adhesion, TGF-beta, and PI3K-Akt signaling pathways based on analyses performed by the STRING database. Additional details on the connections between proteins and the pathways are shown in Figure 4. Because of their relative abundance and significance in the network, CTNNB1, PLCG1, KDR, epidermal growth factor (EGF), ERBB4, and TGFB1 were chosen as upregulated proteins for this stage. While EGFR, CASP3, JUN, CCNA2, EZH2, and JAK2 were observed in downregulated proteins.
3.5 Significant increase of candidate genes expression was observed in patients with PA
By querying the GEPIA and TCGA databases, we analyzed the identification of hub genes and protein products that played a substantial role and function in the invasiveness of PA. Compared to the general population, the protein expression levels of CCNA2, EGFR, JUN, ERBB4, CASP3, and TGFB1 were all significantly expression in the PA patient group. A survival curve for these proteins; it reveals that the mean mortality rate for individuals with PA rises by 60%–80% due to the presence of these genes.
4 DISCUSSION
An improved ability to manage and prevent pituitary prolactinoma depend on researchers' ability to better understand the molecular mechanisms behind the disease. Bioinformatics analysis was used to find key candidate genes for pituitary prolactinoma in the present investigation. We retrieved 940 upregulated and 854 downregulated genes in pituitary prolactinoma from the gene expression data from GEO. However, EGFR may be responsible for pituitary prolactinoma due to its tumor-suppressing function and its epigenetic inactivation, both of which contribute to the onset of cancer.9 The expression of the homeodomain transcription factor NKX2-2 was associated with the development of neuro endocrine tumors by Wang et al.,10 but this gene may be the driving force behind the development of pituitary prolactinoma. In cancer cells, high-expression of the pleiotropic signaling protein BMP7 regulates proliferation, migration, and invasion.11 However, this gene may associated with the proliferation, migration, and invasion of pituitary prolactinoma cells. Although the progression of prolactinoma may be attributable to the involvement of this gene, Cipriano et al.12 found that ontogeny FAM83F is linked to epithelial cell transition in cancer. Prolactinoma cells in the pituitary gland may have a genetic relationship to the oncogene GRHL2, which regulates the transcriptional processes of cell division and differentiation throughout normal development and tumorigenesis.13 Pituitary prolactinoma cells may invade because of the overexpression of the TRIM24, which plays a crucial role in the proliferation and invasion of cancer cells.14 High-expression of the dual specificity kinase TTK is associated with the proliferative potential of cancer cells, as described by Kaistha et al.15 However, this gene may associated with the growth of pituitary prolactinoma. An increase in TOP2A expression may linked to the development of pituitary prolactinoma,16 a tumor that develops when the gene is overexpressed. Although KIF18A has been linked to cell division and checkpoint activation in cancer progression,17 it is possible that these processes are actually caused by this gene in pituitary prolactinoma. TPX2, a microtubule-associated protein, has been shown to promote cell division when overexpressed in cancer.18 However, it is possible that this gene also accelerates cell division in pituitary prolactinoma.
Members of the EGF family of growth factors are encoded by this gene. A peptide of 53 amino acids, is produced by proteolytic processing of the encoded preproprotein.19 Important for the development, proliferation, and differentiation of many different types of cells, this protein functions as a powerful mitogenic factor.19 To exert its effect, this protein binds specifically to the EGFR that found on the surface of cells. The fourth kind of hypomagnesemia is caused by mutations in this gene.20 The development and spread of several malignancies have been linked to a malfunction in EGFR gene.21 When a gene is subjected to alternative splicing, it generates numerous transcript variants, at least one of which encodes a preproprotein that is subsequently processed by proteolysis.22 EGFR was found to be overexpressed in 55.8% of pituitary corticotroph adenomas and in 1.6% of normal adenohypophysial tissues, as demonstrated by Liu et al.23 In contrast to typical adenohypophyseal tissues, pituitary corticotroph adenomas showed much greater expression levels. Phosphorylated Erk (p-Erk) was likewise highly activated in EGFR-overexpressing adenomas, indicating a strong downstream pathway.23 Furthermore, EGFR expression levels correlated positively with ACTH and cortisol levels but not with age, sex, and symptom duration.23 In the group with recurrent PA, the expression levels of EGFR, phosphorylated EGFR (p-EGFR), and p-Erk were all higher than in the group without recurrent adenomas. Relapse-free survival was significantly linked with EGFR expression levels.23 The pituitary tumors studied by Silvia et al.24 showed a positive immunohistochemistry reactivity to EGFR in two distinct cell types. We found a significant concentration of tumor-associated macrophages at the tumor's periphery in several adenomas. There was abundant EGFR expression in these cells. We found that cells with a homogeneous or granular cytoplasmatic pattern, such those found in the folliculostellate anlagen, express EGFR at high levels. The connections between folliculostellate cells and endocrine cells are both adherent and gap junctions. The presence of glial fibrillary acidic protein in these cells further supports the idea that they are an astrocyte- or microglia-like cell type. Our findings corroborate prior research suggesting that folliculostellate cells play a role in basement membrane remodeling, tumoral neoangiogenesis, and tumor growth, specifically through their increased activity under pathological conditions, their phagocytic activity, and their capacity to secrete angiogenic growth factors.24 According to Rai et al.25 study, the mean age of the cohort was 50 years old, and a majority of the participants were men (61.1%). When patients were followed for a median of 123 months (IQR 72–159), 46.1% of them experienced a recurrence.25 The percentage of recurrent NFPAs that tested positive for pEGFR T693 was substantially higher than that of nonrecurrent NFPAs (95.7% vs. 81%). Repeated NFPAs also had significantly higher h-scores (122.1 6 vs. 81.54 3.3).25 Recurrence in NFPAs was strongly predicted by the presence of pEGFR T693 (hazard ratio HR = 4.9). In a ROC analysis, a cutoff h-score of 89.8 was found to have a highly significant relationship with recurrence (sensitivity = 80%, specificity = 78%, and AUC = 0.84). The recurrent rate of NFPAs that expressed pEGFR T693 was substantially greater than the overall percentage. Furthermore, the h-scores were better in chronic NFPAs. The presence of pEGFR T693 in the nucleus could used to foretell recurrence in NFPAs.25 Ten to thirty-five percent of patients with PAs who exhibit hypersecretion of hormones or mass effect symptoms are resistant to traditional therapy.26 Several types of cancer have seen dramatic improvements in prognosis after receiving treatment that focuses on inhibiting EGFR.26 Compared to pituitary glands, EGFR-associated h-scores in 116 PA samples were greater, while p21-, p27-, and Wif-1-associated h-scores were lower in this immunochemistry analysis.26 Regarding patients with low-expression of EGFR, individuals with high-expression one exhibited more PA invasion, less complete resection, and less p21 and p27 expression.26 Using dual luciferase reporter gene assays, we determined that miR-137 targets EGFR and that a miR-137 mimic inhibits GH3 cell proliferation, induces apoptosis, and causes G1-phase arrest. It was found that the suppression of GH3 cells by the combination of miR-137 mimic and AZD9291 was greater than that by either agent alone; also, miR-137 inhibitor partially reversed the inhibition of AZD9291.26 The effects of miR-137 and AZD9291 on GH3 cells were shown to involve p21 and p27. Overall, tumor invasiveness was correlated with EGFR activation in PAs, and this correlated with a decrease in PA resection rates for patients. Indeed, patients with PAs who have developed resistance to normal treatment may benefit from combining miR-137 with AZD9291.26 The integrative genomes, transcriptomics, proteomics, and phosphoproteomics investigations were performed by Zhang et al.27 on 200 patients with neuroendocrine PA as the largest series. The genomic evidence suggests that an increase in the copy number of GNAS is a useful diagnostic marker for PIT1 lineage hyperproliferation. Tumors that overexpressed epithelial–mesenchymal transition markers grouped together to form a more invasive subgroup in a proteomic analysis of neuroendocrine PA.27 Therapeutic targets for several clusters were identified through further investigation, and they included CDK6, TWIST1, EGFR, and VEGFR2.27 Subtyping the immune system to investigate the feasibility of immunotherapy for neuroendocrine PA revealed a correlation between JAK1-signal transducer and activator of transcription (STAT)1-PDL1 axis modifications and immunological exhaustion and JAK3-STAT6-FOS/JUN axis alterations with immune infiltration.27 An additional 750 patients with neuroendocrine PA from a separate cohort study verified the presence of these genetic markers and variants in distinct clusters/subtypes.27 This proteogenomic research, which transcends conventional histological categories, enriches our present knowledge of neuroendocrine PA pathogenesis and provides new treatment targets and approaches.27
The tyrosine kinase encoded by the JAK2 gene is crucial in the transmission of signals involving cytokines and growth factors, but it is not a receptor kinase.28 This protein's major isoform has a tyrosine kinase domain at its carboxy-terminus, a pseudokinase domain in its amino-terminus, an SH2 domain that binds STAT transcription factors, and an N-terminal FERM domain that is necessary for erythropoietin receptor interaction.28 This kinase is activated by interaction of cytokines, which causes its own autophosphorylation. Proteins belonging to the STAT family are enlisted and phosphorylated after being recruited by this kinase.28 This kinase is phosphorylated and activated by growth factors like TGF-beta 1, which then triggers the nuclear translocation of downstream STAT proteins and their effect on gene transcription.29 Several inflammatory disorders and cancers have been linked to mutations in this gene. The pleiotropic cytokine IL6 is produced by B-cells, T-cells, dendritic cells, and macrophages to trigger an immune response or inflammation, and this gene is one of its downstream targets.29 Increased cellular proliferation and myeloproliferative neoplasms of hematopoietic stem cells result from dysregulation of the IL6/JAK2/STAT3 signaling pathways. Hypersensitivity to cytokine signaling and constitutive tyrosine phosphorylation activity are the outcomes of a nonsynonymous mutation in the pseudokinase region of this gene.29 Treatments for excessive inflammatory responses to viral infections can aim at regulating this gene and the IL6/JAK2/STAT3 signaling pathway. Multiple transcript variants encoding different isoforms are produced via alternative splicing.30, 31 The expression of ESR1 in gonadotropin-type PAs and its association with overall survival of patients was investigated using a tissue sample collection of 158 patients with this disease. We looked for ESR1-related genes by analyzing transcriptome data from 79 cases of gonadotropin-type PA. To pinpoint the impacted pathways and target genes, a KEGG pathway enrichment analysis was carried out. The therapeutic efficacy of the ER inhibitors AZD9496 and fulvestrant was studied using in vitro and in vivo PAs models and to determine how AZD9496 and fulvestrant inhibit PAs.32 Patients with PAs who had low levels of ESR1 had a better progression-free survival. The ErbB signaling pathway was shown to be the most significantly enriched pathway. In addition, STAT5B was found to be an important gene associated with ESR-1. There was a strong positive correlation between STAT5B expression and ESR1 expression in the PAs. The novel ER inhibitor AZD9496 significantly slowed the expansion of PA cells both in vitro and in vivo, and its effectiveness is on par with that of the standard ER inhibitor fulvestrant.32 Both the GT1-1 cells and the xenograft mice exhibited a dramatic decrease in JAK2/STAT5B activity after treatment with AZD9496 and fulvestrant, suggesting that this was a mechanistically induced effect.32 Indications for further clinical usage of AZD9496 in the treatment of patients with PA are strengthened by Liu et al. findings.32 Aberrant microRNA (miRNA) expression has been linked to tumorigenesis, metastasis, and invasion. The epigenetics of pituitary tumorigenesis are not well understood. The mRNA expression profile in consecutive pituitary tissues of a novel animal model with a GH-producing pituitary tumor was analyzed using miRNA profiling and real-time PCR.33 Further validation was performed in GH-producing cell lines and human pituitary tumor tissues for selected miRNAs. The expression of miR-216a-5p (fold change = 5.638) and miR-652-3p (fold change = 3.482) was consistently and significantly downregulated, among the 14 miRNAs whose expression was altered.33 Proliferation and invasion of GH3 were suppressed when miR-216a-5p and miR-652-3p mimics were transfected, but they were stimulated when inhibitors were transfected. Downregulation of miR-216a-5p and miR-652-3p target genes Jak2 and Prrx1, respectively, was observed in GH3 cells transfected with mimics and in serial pituitary gland tissues, including hyperplasic tissues and tumors of acromegalic animal models and pituitary tumor tissues of acromegalic people.33 In GH-producing pituitary tumors, downregulated expression of miR-216a-5p and miR-652-3p may contribute to tumor progression by targeting JAK2 and PRRX1.33 PAs are benign tumors that may have a wide range of clinical symptoms due to tumor bulk effects and/or the varied impacts of aberrant pituitary hormone release. There is a need for new biomarkers and therapy options for PAs due to their high morbidity and limited therapeutic choices. In particular, the STAT3 is of great interest because of the pivotal role it plays in mediating cytokine-induced alterations in gene expression.34 In addition, STAT3 regulates mitochondrial activity, which in turn influences cell growth. Several studies show that pharmacological suppression of STAT3 is an effective treatment for many types of tumors, including pituitary tumors, suggesting that STAT3 activation plays a significant role in carcinogenesis.34 Shen et al.35 found that IL-6 and STAT3 were mostly expressed in INFPAs, whereas NNFPAs showed only low levels of expression for both genes.35 However, E-cadherin expression was significantly lower in INFPAs compared to NNFPAs. Each group showed either a positive or a very strong positive N-cadherin. Also, IL-6 and STAT3 expression were favorably connected with Knosp's categorization, while E-cadherin expression was inversely correlated.35 However, N-cadherin expression levels did not correlate with Knosp's categorization. PAs that do not produce hormones tend to have high levels of IL-6, STAT3, and E-cadherin expression. N-cadherin expression, however, was not linked to inoperable PAs.35
Our study reveals significant upregulation of EGFR in invasive PA samples, highlighting its role in facilitating the transition from noninvasive to invasive stages. This finding is consistent with research showing that EGFR overexpression correlates with enhanced cell proliferation and metastasis in various cancers, including gliomas and lung adenomas. In PAs, Liu et al. demonstrated a positive association between high EGFR expression and recurrence in corticotroph adenomas, linking EGFR signaling to increased invasiveness and suggesting it as a marker for poor surgical outcomes. Our data also align with findings from Silvia et al., who noted increased EGFR expression in tumor-associated macrophages at the periphery of pituitary tumors, implying a role in modulating the tumor microenvironment and promoting invasiveness. The presence of EGFR-associated pathways, such as PI3K-Akt and TGF-beta, in invasive PA samples suggests that targeting EGFR could reduce invasiveness and improve therapeutic outcomes. The promising results of EGFR inhibitors in other cancers further support this approach as a potential therapeutic strategy in invasive PAs, especially in cases resistant to standard surgical resection.
Our analysis also highlights JAK2 as a critical player in the invasive progression of PA, with significantly increased expression in invasive samples. JAK2's role in enhancing cytokine-driven cell survival and immune evasion aligns with findings in other tumors, where JAK2/STAT signaling contributes to creating a pro-tumor microenvironment. In their proteogenomic analysis of neuroendocrine tumors, Zhang et al. identified upregulated JAK2 as part of an invasive subgroup characterized by immune infiltration and cytokine signaling changes, underscoring JAK2's role in modifying the microenvironment to favor tumor proliferation and invasion. Additionally, Lee et al. found that miR-216a-5p and miR-652-3p downregulation in GH-producing pituitary tumors promoted JAK2 activation, linking JAK2 overexpression to increased growth and invasiveness in PAs. Together, these findings validate our results and suggest that targeting the JAK2/STAT pathway may effectively reduce PA cell survival, mitigate invasion, and improve patient outcomes by limiting the invasive capabilities of PA cells.
Our research was limited by the absence of experimental confirmation. In the other word, confirming the role of the discovered genes in noninvasive to invasive PA require additional in vivo and in vitro molecular biological research.
5 CONCLSION
PA is studied by performing a bioinformatics study to discover genes with biological and clinical significance. We next used a set of defined constraints to filter out unimportant genes while keeping DEGs. These results have the potential to aid in the identification of diagnostic biomarkers and therapeutic strategies for pituitary prolactinoma by increasing our understanding of its origin, pathophysiology, and the potential molecular pathways and gene targets such as EGFR and JAK2.
AUTHOR CONTRIBUTIONS
All the authors contributed in this study equally and confirmed the final version of manuscript.
FUNDING INFORMATION
None.
CONFLICT OF INTEREST STATEMENT
The authors declare no conflict of interest.
ETHICS STATEMENT
Not applicated.
Open Research
DATA AVAILABILITY STATEMENT
The data used to support the findings of this study are available from the corresponding author upon request.


