Lung T1 MRI assessments in children with mild cystic fibrosis lung disease
Abstract
Rationale
Lung T1 MRI is a potential method to assess cystic fibrosis (CF) lung disease that is safe, quick, and widely available, but there are no data in children with mild CF lung disease.
Objective
Assess the ability of lung T1 MRI to detect abnormalities in children with mild CF lung disease.
Methods
We performed T1 MRI, multiple breath washout (MBW), chest computed tomography (CT), and spirometry in a cohort of 45 children with mild CF lung disease (6–11 years of age).
Main Results
Despite mean normal ppFEV1 values, the majority of children with CF in this study exhibited mild lung disease evident in lung clearance index (LCI) measured by MBW, chest CT Brody scores, and percent normal lung perfusion (%NLP) measured by T1 MRI. The %NLP correlated with chest CT Brody scores, as did LCI, but %NLP and LCI did not correlate with each other. Analysis of the Brody subscores showed that %NLP and LCI largely correlated with different Brody subscores.
Conclusions
T1 MRI can detect mild CF lung disease in children and correlates with chest CT findings. The %NLP from T1 MRI and LCI correlate with different chest CT Brody subscores, suggesting they provide complementary information about CF lung disease.
1 INTRODUCTION
Cystic fibrosis (CF) is an autosomal recessive condition cause by variants in the CF transmembrane conductance regulator (CFTR) gene.1 CF affects multiple organ systems, but lung disease is responsible for the vast majority of morbidity and mortality.2 Objective measures of lung function are therefore critical for CF clinical care and research.
The most widely used method to assess CF lung disease is spirometry, which can measure the percent predicted forced expiratory volume in 1 s (ppFEV1).3 ppFEV1 is a widely used outcome measure in CF clinical trials and correlates with mortality and quality of life.3 However, advances in CF care have rendered ppFEV1 an insensitive measure of early and mild CF lung disease. Indeed, in 2020 the median ppFEV1 in children 6–12 years with CF in the United States of America (USA) was 100%.2 The majority of new diagnoses of CF occur via newborn screening,2 and as highly effective CFTR modulators become available for infants and young children with CF,4 there is an urgent need for more sensitive measures to identify early and mild CF lung disease. Spirometry also requires patients to perform a maximal forced expiratory maneuver, which infants and young children cannot do.
The lung clearance index (LCI), measured by multiple breath washout (MBW), is a measurement of ventilation inhomogeneity, and it is increased in people with CF (PwCF).5 LCI has been shown to be more sensitive than spirometry in detecting signs of early CF lung disease as well as significant improvements (reduced LCI) in response to CFTR modulator therapy in young PwCF.6, 7 However, MBW requires a high degree of operator expertise to obtain quality data, especially in young children,8 and studies using MBW in young PwCF have usually incorporated overreading for quality control.9 The MBW method is also relatively time-consuming, since results are usually expressed as the average of two or more tests requiring additional time between tests to wash out the tracer gas. An additional practical limitation in the United States is that the device most commonly used in CF research studies is not cleared by the US Food and Drug Administration for clinical use. Also, LCI is a global index of ventilation inhomogeneity and cannot provide information about regional defects in lung function. These considerations limit the widespread application of MBW in clinical care of PwCF.
Chest imaging is another approach to assessing CF lung disease.10, 11 Chest computed tomography (CT) can readily identify areas of bronchiectasis, airway wall thickening, and mucus plugging in PwCF, even in infants and toddlers with CF. However, exposure to significant levels of ionizing radiation limits the frequent use of chest CT, especially for children with CF. Magnetic resonance imaging (MRI) does not utilize ionizing radiation, and there are a variety of MRI techniques that have been utilized in CF research, including hyperpolarized gas MRI, ultrashort echo time MRI, functional MRI, perfusion MRI, and conventional T1-weighted and T2-weighted MRI sequences.12-15 Some of these methods require specialized gases, equipment, or sequences which are expensive and not widely available. The acquisition time can also be relatively long, making it challenging to use in infants and young children. Both conventional CT and MRI images also require manual, subjective scoring of the acquired images, which adds time and expertise to perform and adds interobserver variability.16
One of the key measurements used in MRI is the T1 relaxation time, which varies amongst different tissue and body components. For example, blood has a very high T1 in comparison to many other tissues. Importantly, prior work has shown that quantitative lung T1 maps can serve as a proxy measure of pulmonary vascular perfusion that is altered in PwCF,17 as the lung disease progresses likely through lung disease/damage resulting in hypoxic vasoconstriction.17 Compared with other MRI methods, T1 MRI is fast (acquisition times of 10–15 s/imaging slice, total patient scan time of 5–10 min), does not require the use of specialized gases or MRI acquisitions, and is available on almost all modern clinical MRI scanners. As with all MRI techniques, T1 MRI does not utilize ionizing radiation, and because quantitative T1 maps are computer generated, no manual scoring is required. These features make T1 MRI an attractive option for assessment of CF lung disease that is safe, fast, and easily applied in the clinical setting. T1 MRI has also been applied to the study of other lung diseases, such as chronic obstructive pulmonary disease (COPD) and pulmonary fibrosis.18, 19 T1 MRI has been used to study lung disease in adults with CF,20, 21 and our previous work has shown that lung T1 MRI differences in PwCF are related to focal deficits in lung perfusion and can sensitively detect CF lung disease.17 However, there have been no studies to date comparing lung T1 MRI with either MBW or chest CT in children with mild CF lung disease.
We hypothesized that T1 MRI can detect early and mild CF lung disease and correlates with LCI and chest CT scores. To test this hypothesis, we performed T1 MRI, MBW, and chest CT in a cohort of PwCF ages 6–11 years and compared each test to each other using MRI scanners with different magnetic field strengths.
2 METHODS
2.1 Study population
We recruited children with CF ages 6–11 years followed at the CF Centers at Riley Hospital for Children (Indianapolis, IN) and the University of Michigan C.S. Mott Children's Hospital (Ann Arbor, MI) from February to September 2021. Elexacaftor/tezacaftor/ivacaftor (ETI) was approved for clinical use in the United States in June 2021, but none of the study participants were on ETI at the time of enrollment and performance of study procedures. Inclusion criteria included being homozygous for F508del or a compound heterozygote with 1 copy of F508del and a minimal function or residual function CFTR variant. Exclusion criteria included inability to do a breath hold for 15 s, increased respiratory symptoms at the time of the study visit or in the 2 weeks before the scan, and standard contraindications to MRI (e.g., metal within the body or having an implanted heart pacemaker). The institutional review boards at each hospital reviewed and approved their respective protocols, and a parent or legal guardian provided written informed consent at the time of enrollment.
2.2 Lung T1 MRI
Lung T1 MRI data were acquired for each subject on either a Siemens Prisma 3T MRI (Indiana) or a Philips Achieva 1.5T MRI scanner (Michigan). Each subject was first positioned supine in the scanner with ECG leads positioned for effective cardiac gating to limit cardiac motion artifacts. Following initial localizer scans for positioning, multiple, coronal lung T1 maps were acquired using a version of an established T1 MRI mapping sequence based on the Modified Look-Locker Inversion Recovery (MOLLI) acquisition used extensively for cardiac MRI imaging applications.22 As described previously,23 the MOLLI T1 MRI images were acquired with both a short echo time (TE = 0.7–0.8 ms) and a lower spatial resolution (e.g., 10 × 2.5 × 2.5 mm at 3T and 15 × 2.5 × 2.5 at 1.5T) to obtain sufficient image quality of the subjects' lungs. The lung T1 MRI data was acquired during instructed end-exhalation breath holds to limit respiratory motion artifacts. The slice thickness used for the 1.5T scanner was increased from 10 mm (for 3T) to 15 mm to partially compensate for the lower signal level of the 1.5T scanner. The lung T1 MRI maps were automatically reconstructed on the Siemens 3T MRI scanner and exported to Digital Imaging and Communication in Medicine (DICOM) format for additional analysis. The T1 MRI maps for the Philips 1.5T scanner were reconstructed offline in MATLAB (The Mathworks) using a dictionary matching process similar to our previous work to further limit respiratory motion artifacts.24
The lung T1 maps from the two sites were analyzed by two of the three expert raters (C. M., E. K., S. F.) for consistency. Using a custom MATLAB script, regions-of-interest (ROIs) were manually selected covering the majority of the left and right lungs for each of the three, coronal lung T1 maps (6 total ROIs). The lung T1 values were then averaged to generate a mean T1 for the left and right lungs. The mean T1 for the left and right lungs were then averaged to calculate an overall mean lung T1 value for each subject. Comparisons were made between the two raters to ensure that all mean lung T1 values were within 5% of each other.
As T1 MRI values change with magnetic field strength, we developed a T1 normalization procedure to compare the data obtained from the 1.5T and 3T MRI scanners to generate an overall measure of percent normal lung perfusion (%NLP). First, the mean lung T1 values for subjects exhibiting 100% ppFEV1 at 1.5T and 3T were used to calculate a “normal” threshold to distinguish between healthy lung regions (high T1 values, normal blood flow) and damaged lung regions (lower T1 values, reduced blood flow). The threshold at 1.5T (1072 ms, n = 5) and 3T (1356 ms, n = 10) was established as three standard deviations below the mean lung T1 value for the 6–11-year-old subjects with 100% ppFEV1. Once the threshold was calculated for each magnetic field strength, the overall %NLP was then determined by calculating the percentage of T1 map voxels with “normal” blood flow (high T1 values) and the number of voxels with reduced blood flow (low T1 values). This process effectively normalized the T1 MRI data to facilitate comparisons for PwCF scanned at the Michigan (1.5T) and Indiana (3T) sites.
2.3 MBW and spirometry
Spirometry was performed according to American Thoracic Society (ATS) guidelines.25 Absolute values of FEV1 and other measurements were converted to z-scores and percent predicted using the Global Lungs Initiative normal reference equations. Nitrogen breath MBW was performed according to ATS guidelines using the Exhalyzer-D (Eco Medics AG) with Spiroware version 3.1.6.8 LCI values were compared with normal reference data collected using the same Spiroware software version. All studies were reviewed by an overreader (C. C.), and studies that did not meet ATS research quality criteria were not included in the analysis. Spirometry was always performed after MBW.
2.4 Chest CT
High-resolution chest CT (HRCT) scans were performed with low-dose radiation dose using ALARA (as low as reasonably achievable) principles by using at least one dose reduction technique specific for each scanner at each site, with no injectable contrast agent and no sedation, similar to previously described protocols.26 Axial inspiratory HRCT images of 1 mm slice thickness were obtained incrementally at 10 mm intervals from the lung apex to the diaphragm using weight-based low radiation exposure settings; additionally, expiratory HRCT images of 1 mm slice thickness were obtained at four levels: (1) just above the aortic arch, (2) at the carina, (3) at the inferior hilum, and (4) just above the diaphragm. A board-certified pediatric radiologist at each site, blinded to the clinical severity of the patient's symptoms and other variables assessed in this study, reviewed the images for technical adequacy and independently scored each CT using the Brody scoring system as described previously.27, 28 Scores for bronchiectasis, bronchial wall thickening, mucous plugging, and parenchymal opacity assessments were obtained from the inspiratory scans, while the air trapping scores were assessed on the expiratory images. A Brody score was calculated for each patient for each of six lobes (including the lingula as a separate lobe), with a maximum score of 40.5 per lobe.29 To assess interreader variability, all CT scans were deidentified and the radiologist at Riley scored all the scans from Michigan and vice versa. To assess intrareader variability, the radiologist at each site rescored the same CTs obtained at their site several months later.
2.5 Statistical analysis
Demographic and clinical characteristics were generated and presented as means (standard deviations); medians (ranges) for continuous variables and as frequencies (percentages) for categorical variables. Body mass index (BMI) z-scores were derived using CDC reference data. Correlation analyses were performed using Spearman rank-sum correlation analyses, due to data skewness. A p value ≤ .05 was considered statistically significant. Intrareader and interreader variability were assessed using intraclass correlation (ICC) analyses, with the ICC coefficients being generated using the SAS macro intracc. All analytic assumptions were verified, and all analyses were performed using SAS v9.4 (SAS Institute).
3 RESULTS
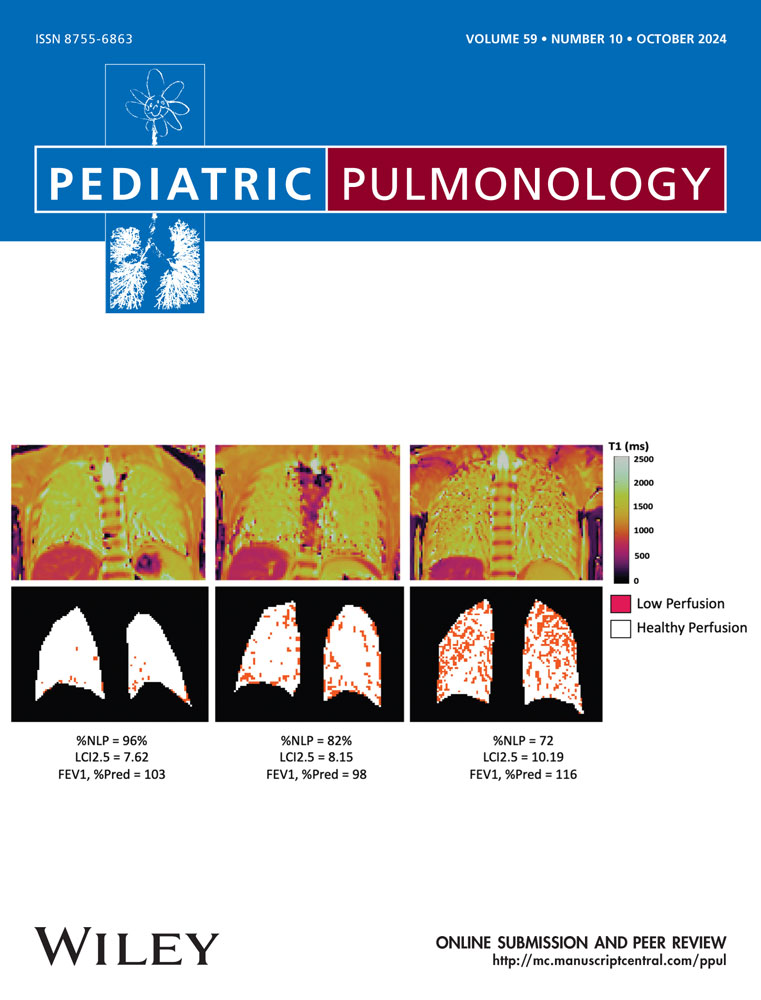
The clinical features and results of testing in our study cohort are shown in Table 1. Compared with data from the CF Foundation Patient Registry,30 our cohort had milder disease in children with CF of similar age, as evidenced by a higher ppFEV1 and BMI percentile. A total of 45 study participants completed spirometry, MBW, HRCT, and lung T1 MRI. Despite their high lung function and nutritional status and minimal history of pulmonary exacerbations, mean LCI, chest CT Brody scores, and T1 MRI %NLP were abnormal for the majority of subjects, albeit only mildly so. Representative T1 MRI maps from study participants with differing degrees of lung disease severity are shown in Figure 1.
| N | 45 |
|---|---|
| Sex, N (%) | |
| Male | 23 (51.1) |
| Female | 22 (48.9) |
| Race, N (%) | |
| White | 43 (97.7) |
| Black | 1 (2.3) |
| Multiracial | 1 |
| Age in years at time of testing, mean (SD) | 8.9 (1.7) |
| BMI z-score, mean (SD) | 0.4 (0.9) |
| Pulmonary exacerbation within last 3 months, N (%) | 7 (16.3) |
| Intravenous antibiotic treated exacerbation in the previous year, N (%) | 1 (2.4) |
| Pancreatic enzyme replacement therapy, N (%) | 40 (88.9) |
| FEV1 percent predicted, mean (SD) | 101.6 (15.3) |
| Lung clearance index, mean (SD) | 8.6 (1.3) |
| CT Brody score, mean (SD) | 23.6 (26.9) |
| T1 MRI %NLP, mean (SD) | 87.3 (8.9) |

Scatterplots of ppFEV1, LCI, chest CT Brody scores, and T1 MRI %NLP are shown in Figure 2. The majority of children (58% of the cohort) had an LCI above the published upper limit of normal (7.91) using the same software used in our study.31 The %NLP from lung T1 MRI was also below 95% for the majority of children (67% of the cohort) despite many subjects having ppFEV1 100%. In 73% of the cohort, their CT Brody score was above 10.

Table 2 shows the correlation between the different tests. Both LCI from MBW and %NLP from lung T1 MRI correlated significantly with CT Brody scores, but not with each other. Analysis of the Brody subscores (Table 3) showed that both LCI and %NLP correlated with central mucus plugging and peribronchial thickening. However, only LCI correlated with air trapping and only %NLP correlated with bronchial dilation and dense parenchymal opacities. Neither correlated with bronchiectasis or ground glass appearance. Analysis of intra- and interreader variability for the HRCT assessments showed that the interreader ICC was 0.90 and the intrareader variability ranged from 0.85 to 0.94.
| LCI 2.5 | CT total | MRI %NLP | |
|---|---|---|---|
| FEV1% predicted | −0.37; p = .011 | −0.12; p = .514 | 0.11; p = .455 |
| LCI 2.5 | 0.43; p = .017 | −0.06; p = .712 | |
| CT total | −0.41; p = .026 |
- Note: Values are Spearman nonparametric correlation coefficients with corresponding p values.
| Brody subscore | LCI | MRI-NLP |
|---|---|---|
| Brody subscale A size of largest dilated bronchus | 0.285; p = .1266 | −0.372; p = .0429 |
| Brody subscale B size of most prevalent dilated bronch | 0.289; p = .1212 | −0.382; p = .0374 |
| Brody subscale D extent of central bronchiectasis | 0.268; p = .1515 | −0.344; p = .0624 |
| Brody subscale E extent of peripheral bronchiectasis | 0.303; p = .1037 | −0.277; p = .1389 |
| Brody subscale G central mucus plugging | 0.446; p = .0135 | −0.405; p = .0262 |
| Brody subscale H peripheral mucus plugging | 0.299; p = .1080 | −0.285; p = .1275 |
| Brody subscale J peribronchial thickening | 0.395; p = .0305 | −0.363; p = .0483 |
| Brody subscale K central PBT | 0.366; p = .0468 | −0.350; p = .0581 |
| Brody subscale L peripheral PBT | 0.307; p = .0991 | −0.323; p = .0817 |
| Brody subscale N dense parenchymal opacity | 0.345; p = .0621 | −0.454; p = .0118 |
| Brody subscale O ground glass | −0.064; p = .7351 | −0.177; p = .3490 |
| Brody subscale P cysts/bullae | Not applicable | Not applicable |
| Brody subscale R air trapping | 0.401; p = .0282 | −0.232; p = .2181 |
| Brody subscale S air trapping degree | 0.391; p = .0326 | −0.267; p = .1534 |
- Note: Subscale P was not applicable because no cysts or bullae were noted in any CT scans.
4 DISCUSSION
In this multicenter, cross-sectional study of T1 MRI, MBW, CT, and spirometry in a cohort of young PwCF with mild lung disease, we demonstrated that lung T1 MRI %NLP can detect early, mild lung disease and correlates significantly with chest CT Brody scores. LCI also correlated with Brody scores, but not with %NLP from lung T1 MRI. T1 MRI %NLP and LCI largely correlated with different Brody subscores, suggesting that these two methods can provide complementary information about early, mild lung disease in children with CF.
Lung T1 MRI has been used to study other diseases, such as COPD, emphysema, and pulmonary fibrosis,18, 19 as well as CF. Jakob et al. performed T1 MRI in room air and under different hyperoxic conditions in a cohort of adult PwCF.20 PwCF showed baseline inhomogeneity, and changes in T1 map images in response to hyperoxia were more heterogenous and dependent upon their disease state. Triphan, et al performed T1 MRI in a cohort of infants and adults with CF.21 They did not compare their results to chest CT, but they did find that T1 MRI performed at very short echo times (i.e., <100 ms) correlated with LCI. Our current T1 MRI studies were consistent with prior work using moderate echo times (TE = 0.7–0.8 ms) that was shown to be primarily sensitive to pulmonary blood, which may account for the lack of association between T1 MRI %NLP and LCI in the current study.
Direct comparisons of our results to previous studies in PwCF are difficult because of differences in baseline lung disease (our study cohort had much milder lung disease), MBW equipment, and CT/MRI scoring systems used. However, overall, our results are similar to other studies comparing MBW to chest imaging with either CT or MRI. Both CT, MRI, and LCI are superior to spirometry in detecting abnormalities in lung function or structure, but abnormal LCI does not correlate with bronchiectasis on CT or MRI.6, 7, 14, 32, 33 Our study demonstrates that %NLP from lung T1 MRI can sensitively detect lung disease in a cohort of children with very mild disease and taken together with previous studies, suggests that LCI and lung imaging provide complementary information about CF lung disease. Furthermore, we were able to detect lung disease using T1 MRI maps with clinically available MRI acquisitions using different MRI magnetic field strengths.
LCI and T1 MRI %NLP correlated with Brody scores, but their respective associations with the individual Brody subscores were largely complementary. The Brody score is a composite value that incorporates parenchymal and airway abnormalities. LCI is a measure of ventilation inhomogeneity, and is a reflection of airway disease, whereas T1 MRI is largely impacted by local reductions in pulmonary perfusion, which, in turn, is more affected by parenchymal lung disease. The differences in these two measurements likely accounts for the differences in correlation with Brody subscores. Taken together, these results suggest that LCI and T1 MRI offer complementary information about CF lung disease.
The participants in our study had very mild lung disease by the ppFEV1 criteria. Nonetheless, the majority of subjects had an abnormal LCI and %NLP. ETI was approved for clinical use in June 2021, and all our assessment took place before any study participant initiating ETI therapy. We are now in the process of repeating MBW and T1 MRI after initiation of ETI to assess the response to highly effective CFTR modulatory therapy on this mild CF patient population.
T1 MRI has many advantages compared with other imaging methods. It does not utilize ionizing radiation and does not require special gases or sequences. It can also be performed without sedation. Total scan times are less than 10 min (~10 s/imaging slice), which makes it feasible to perform as part of clinical care and easier for young children to tolerate. As our results show, lung T1 MRI data can be compared across MRI field strengths using the %NLP metric, and T1 MRI methods are generally available on the large majority of modern MRI scanners. Finally, because %NLP is calculated from the T1 MRI map, it does not require manual scoring, which is both time consuming and can introduce a degree of subjectivity to the assessment. Although T1 MRI does not directly measure airway function and ventilation inhomogeneity, the results from our current study and our previous data demonstrate that T1 MRI may be abnormal in subjects with mild CF lung disease, suggesting that it may serve as a clinically useful assessment of CF lung disease.
There are several limitations to our study. In contrast to some other studies, we did not observe a correlation between LCI and MRI.15, 21 This lack of correlation may result from the fact that the majority of our study cohort had mild lung disease and a lower mean LCI than in other studies. For example, the mean ppFEV1 in the study by Triphan et al. was 85%. Further, MBW and T1 MRI assess very different aspects of CF lung disease (i.e., airway heterogeneity vs. pulmonary blood flow) which is supported by the complementary associations between LCI and %NLP with CT. The choice of software for the MBW device we used has been shown to affect LCI results.34 Although this may have affected our measurement of LCI, it would not affect any correlation assessments, and compared with published normal reference data using the older software, the mean LCI in our study cohort was still abnormal. The CT assessment of lung disease was quantified using an established Brody scoring method. This system was developed in the 1990s and may not be as sensitive to the detection of early lung disease. It is possible that we would have observed more abnormalities using the Perth-Rotterdam Annotated Grid Morphometric Analysis for CF (PRAGMA CF),35 but this system was not available to us for this study. Despite this limitation, many children had an abnormal Brody score, the mean score was elevated in this cohort of children with mild lung disease, and T1 MRI %NLP correlated significantly with the Brody score. One additional limitation for this study is that we used the PwCF with ppFEV1 values 100% to determine the T1 MRI threshholds at each site to classify each lung voxel as either normal perfusion (high T1 value) or abnormal perfusion (low T1 value). It is possible that scanning a cohort of healthy, non-CF age-matched subjects would result in slight alterations of the threshold. However, the T1 values in the lungs of these “normal” PwCF were similar to prior studies of healthy, non-CF adults17 suggesting that these differences would likely be minor.
In summary, lung T1 MRI can detect mild CF lung disease in children, correlates with chest CT Brody scores, and provides complementary information to that provided by MBW. The safety, speed, and accessibility of T1 MRI suggest that it may have a role in the clinical care of PwCF. Future work will focus on the ability of T1 MRI to detect treatment response to ETI and the application of T1 MRI to younger children with CF.
AUTHOR CONTRIBUTIONS
Clement L. Ren: Conceptualization; investigation; funding acquisition; writing—original draft; methodology; validation; writing—review and editing; formal analysis; project administration; data curation; supervision; resources. Samya Z. Nasr: Conceptualization; investigation; funding acquisition; methodology; validation; writing—review and editing; formal analysis; project administration; data curation; supervision; resources. James E. Slaven: Methodology; data curation; formal analysis; writing—review and editing. Aparna Joshi: Investigation; writing—review and editing; data curation. Maryam Ghadimi Mahani: Conceptualization; investigation; writing—review and editing; data curation; formal analysis. Charles Clem: Investigation; methodology; validation; formal analysis; data curation; writing—review and editing. Matthew Cooper: Investigation; writing—review and editing; formal analysis; data curation. Susan Farr: Investigation; writing—review and editing; project administration; supervision. Christina J. MacAskill: Investigation; formal analysis. Elise Keshock: Investigation; formal analysis. Jennifer L. Nicholas: Investigation; formal analysis; data curation. Matthew Ferrebee: Investigation; project administration. Kimberly McBennett: Conceptualization; investigation; writing—review and editing; formal analysis; data curation; project administration. Chris A. Flask: Conceptualization; investigation; funding acquisition; writing—review and editing; methodology; formal analysis; project administration; data curation; supervision; resources.
ACKNOWLEDGMENTS
We thank the children with CF and their families for participating in this study and the outstanding work of our research teams (Mary Heskett and Lisa Bendy, Riley Hospital for Children; Dawn Kruse and Jessica Carey, University of Michigan; Tia Rone, Julie Wallace, Jay Hilliard, and Ellen Divoky, Case Western Reserve and University Hospitals – Cleveland Medical Center). This work was supported by a grant from the CF Foundation to CAF, SZN, and CLR (FLASK20A0).
CONFLICT OF INTEREST STATEMENT
The authors declare no conflict of interest.
Open Research
DATA AVAILABILITY STATEMENT
The data that support the findings of this study are available from the corresponding author upon reasonable request.