Active Layer Warming and Thickening on CALM-S JGM, James Ross Island, in the Period 2013/14–2022/23
Funding: This research was supported by the Czech Science Foundation project (GM22-28659M) and internal grant of Masaryk University (MUNI/A/1323/2022).
ABSTRACT
The Circumpolar Active Layer Monitoring-South (CALM-S) site was established near the Johann Gregor Mendel (JGM) research station on James Ross Island in February 2014. The CALM-S JGM grid, measuring 80 × 70 m, encompasses two distinct lithological units: a Holocene marine terrace (covering approximately 75% of the grid) and Cretaceous sediments of the Whisky Bay Formation (covering the remaining 25%). Within each lithology, a monitoring profile was established to track the active layer thermal regime and thickness. Additionally, active layer thaw depth probing has been conducted annually around mid-February. Since 2017, the dataset has been further supplemented by surficial soil water content measurements. During the study period (2013/14–2022/23), air temperature increased at a rate of 0.2°C per year. Consequently, the active layer thickness, defined by the 0°C isotherm, increased by an average of 1.5 cm per year, while mechanically probed thaw depths showed an annual increase of 1.9 cm. This study confirms that local lithology strongly influences active layer thermal regime. On average, the active layer thickness was 24 cm greater on AWS-CALM (Cretaceous sediments) than on AWS-JGM (marine terrace). The thaw depth was 28 cm greater in the Cretaceous sediment part of CALM-S compared with the marine terrace part. A strong correlation (r = 0.82 to r = 0.91) was found between active layer thickness and thaw depth with thawing degree days of air and near-surface ground temperature in both lithologies.
1 Introduction
Active layer thickness (ALT) and temperature are two important climatic variables of permafrost environments [1, 2]. The Circumpolar Active Layer Monitoring (CALM) programme is one of the first international projects to standardise the monitoring of the active layer thermal regime and thaw depth. The predominant monitoring approach is to use mechanical probing to detect the active layer thaw depth within the grid nodes (e.g. [1, 3]). Furthermore, the CALM sites are equipped with active layer and permafrost temperature monitoring systems, which provide data for the ALT derived as the depth of the 0°C isotherm and the overall climatic conditions of the CALM sites. Recently, CALM monitoring results have been summarised for North America [4], Siberia [5, 6], and Antarctica [7]. Moreover, a number of studies conducted over the past two decades have focused on a detailed assessment of thaw depth variability at CALM sites situated in various regions of the Arctic (e.g. [8-13]) and Antarctica (e.g. [7, 14-21]).
The estimated extent of global permafrost is between 14 and 16 million km2 [22]. Of this total, only 45,000 to 70,000 km2 is located in the ice-free areas of Antarctica [23]. These ice-free areas are fragmented into a mosaic of very small rock outcrops covering up to a few hectares and larger Antarctic oases covering tens or hundreds of square kilometres. In contrast to the permafrost and active layer monitoring sites listed in the Global Terrestrial Network for Permafrost database (GTN-P), which have more than 80 profiles [23], the CALM-S (Circumpolar Active Layer Monitoring - South) database contains only nine sites [24]. Most of the CALM-S sites (six out of nine) are located in the Antarctic Peninsula region. This limited number of CALM-S sites in Antarctica is primarily caused by the local conditions that are unfavourable for thaw depth probing measurements (e.g. [1, 15]). Other limitations include logistic constraints or climate conditions like long-lasting snow cover presence, preventing the measurements (e.g. [20]). Nevertheless, the few CALM-S sites in Antarctica have provided valuable data to understand active layer thaw depth variability under different conditions. In particular, the factors studied in Antarctica were local lithology [18], snow cover [16, 20, 25], and vegetation [16]. The effect of these factors can result in a local thaw depth variability of up to 50 cm over the 100 × 100 m area.
- evaluation of decadal trends in active layer thermal regime, thickness and thaw depth,
- assessment of temperature influence on ALT and thaw depth,
- analysis of the spatial and temporal variability of VWC and its influence on thaw depth.
2 Methods
2.1 Study Area
James Ross Island is located in the northeastern part of the Antarctic Peninsula. It is the largest island in the region (approximately 2400 km2), with ice-free areas covering more than 500 km2 of its surface. Such an extension forms the largest mosaics of ice-free areas in the Antarctic Peninsula region (e.g. [23]). The area of interest is the northern part of James Ross Island, called Ulu Peninsula. The mean annual air temperature near sea level was −6.7°C in the period 2004–2021 [27]. Precipitation is estimated to be between 300 and 700 m w.e./year [28], mainly snowy. The snow is strongly redistributed by wind [29], leading to relatively low accumulations in flat areas (e.g. [30]). The permafrost is continuous [31], with ALT generally ranging from about 40 up to 120 cm (e.g. [23]).
2.2 CALM-S JGM
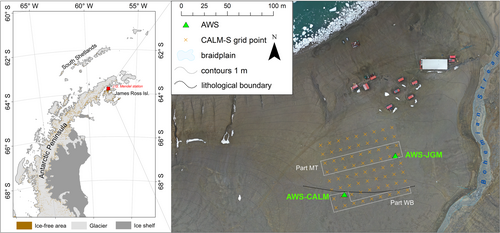
The CALM-S JGM grid of 80 × 70 m has a reduced size in respect to the CALM standard due to Johann Gregor Mendel station facilities located to the north and the area formed by soils that are difficult to probe to the south (Figure 1). The site is elevated between 8 and 12 m a.s.l., and it is gently inclined (1–5°) towards the north. The lithology of the CALM-S JGM consists of about 75% of gravelly to sandy sediments of a Holocene marine terrace and the remaining 25% of silt-loam sediments of the Whisky Bay Fm. of Cretaceous origin [18]. The CALM-S JGM area was delineated using a total station connected to the local geodetic network [32].
2.3 Automatic Monitoring Stations
The CALM-S JGM is equipped with an automatic weather station (AWS) and two profiles for ground temperature monitoring. The profile AWS-JGM is located on a Holocene marine terrace, whereas the profile AWS-CALM is located within the Cretaceous sediments of Whisky Bay Formation (Figure 1). The AWS-JGM provides air temperature data measured at 2 m above the ground surface using a Minikin TH sensor (EMS Brno) with an accuracy of ± 0.15°C placed in a protective radiation shield. AWS-JGM and AWS-CALM provide ground temperature data measured in a 200-cm deep profile using Pt100/8 thermometers (accuracy ± 0.15°C; EMS Brno) placed directly to the ground. Data are recorded at 30-min intervals using dataloggers EdgeBox V12 (EMS Brno).
2.3.1 Data Processing
The data from the air temperature and ground temperature sensors at 5-, 50-, 75-, 100-, and 200-cm depths were used from the AWS-JGM and AWS-CALM. The raw 30-min data from the temperature measurements were used to calculate daily means and subsequently utilised to compute monthly and annual averages. In accordance with previous studies (e.g. [18, 27]), the annual means were calculated for the period from March to February to contain a complete sequence of a freezing and thawing season. The temporal trends of selected parameters were established using the MAKESENS 1.0 application [33].
The datasets were continuous, with the exception of AWS-CALM ground temperatures, which were missing due to data logger malfunction in the period between 11 October 2016 to 21 January 2017. The mean daily temperatures were recalculated using linear regression models (R2 > 0.99 in all cases) based on relationships between ground temperatures of particular depths measured on AWS-CALM and AWS-JGM from 1 September 2016 to 28 February 2017.
- Thawing degree day (TDD) indices summarise the positive daily mean temperatures during the thawing season. For each season, TDD of air (TDDa) and ground temperatures at depths of 5 cm (TDD5) and 50 cm (TDD50) were defined for the periods (a) from the beginning of the thawing season until the day with maximum ALT (e.g. [1]), further referred to as TDDe, and (b) residual TDD for the whole thawing season, further referred to as TDDt.
- Freezing degree day (FDD) indices summarise the negative daily mean temperatures during the freezing season. FDDs were calculated for air temperature (FDDA) and ground temperature at a depth of 5 cm (FDD5).
2.4 ALT
ALT refers to the maximum annual depth of 0°C isotherm. It was calculated for the day when the maximum positive temperature was detected on the bottommost sensor in the active layer using a linear interpolation with the closest sensor recording temperature < 0°C. The pairs of these depths were 50 and 75 cm and 75 and 100 cm on AWS-JGM and AWS-CALM, respectively.
2.5 Active Layer Thaw Depth and Volumetric Water Content
Since 2017, the VWC has been measured using a Hydrosense II device equipped with a TDR probe CS659 (Campbel Sci.) with an electrode length of 12 cm (accuracy ± 3%). The measurement was carried out within a 1-m radius from each grid node of CALM-S JGM. The representative value was obtained as a mean from at least two measurements with a less than 5% difference. VWC measurements were conducted on the same day as the active layer thaw depth probed. Finally, to obtain values of thaw depth and VWC representing both lithological formations, we defined two areas, counting 10 nodes and 18 nodes for Whisky Bay Fm. (Part WB) and Holocene marine terrace (Part MT), respectively (Figure 1).
3 Results
3.1 Air and Ground Thermal Regime
3.1.1 Air Temperature AWS-JGM
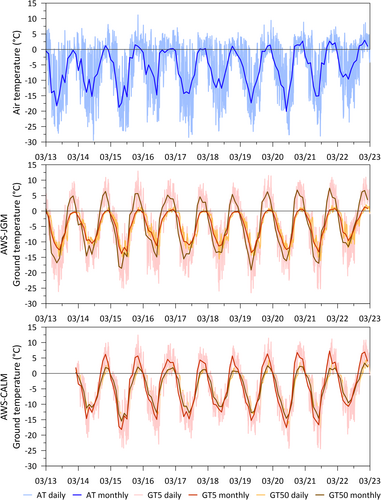
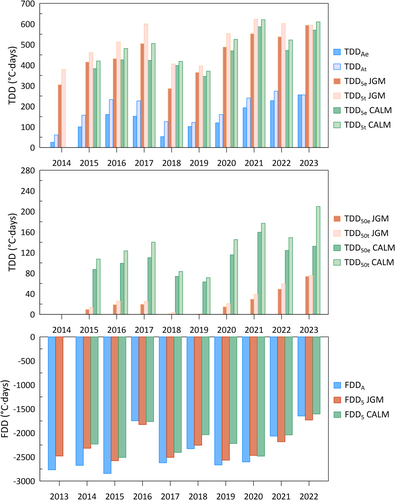
The mean annual air temperature (MAAT) was −5.8°C, and it ranged from −3.6°C (2022/23) to −7.4°C (2013/14) (Table 1). During the study period, the MAAT exhibited an increasing trend of 0.2°C/year (significant at p < 0.05). The mean monthly air temperature was positive only during the summer months from December to February. The warmest month recorded was January 2023 (3.0°C). Mean daily temperatures exceeded 5°C in each summer season. The maximum mean daily temperature (11.2°C) was recorded on 2 January 2016 (Figure 2). The mean value of TDDAe was 139°C·days (25°C·days in 2013/14 to 256°C·days in 2022/23), while the mean value of TDDAt was 185°C·days (61°C·days in 2013/14) to 274°C·days in 2021/22) (Figure 3). The mean monthly air temperature in winter occasionally dropped below −15°C. The minimum observed monthly temperature was −20.1°C in August 2020, and the daily minimum of −29.5°C was recorded on 18 August 2014 (Figure 2). The mean FDDa was −2397°C·days, ranging from −2767°C·days (2013) to −1648°C·days (2022) (Figure 3).
| AWS-JGM | AWS-CALM | ||||||||
|---|---|---|---|---|---|---|---|---|---|
| AT | GT5 | GT50 | GT100 | GT200 | GT5 | GT50 | GT100 | GT200 | |
| 2013/2014 | −7.4 | −5.4 | −5.5 | −6.0 | −6.0 | — | — | — | — |
| 2014/2015 | −6.7 | −5.0 | −5.1 | −5.7 | −5.6 | −4.9 | −5.0 | −5.2 | −5.2 |
| 2015/2016 | −7.0 | −5.6 | −5.8 | −6.3 | −6.0 | −5.6 | −5.8 | −5.7 | −5.7 |
| 2016/2017 | −3.9 | −3.3 | −4.0 | −4.8 | −5.1 | −3.5 | −4.2 | −4.6 | −4.7 |
| 2017/2018 | −6.6 | −5.6 | −5.1 | −5.4 | −5.2 | −5.3 | −5.3 | −5.1 | −5.1 |
| 2018/2019 | −6.0 | −5.1 | −5.1 | −5.6 | −5.4 | −4.6 | −4.7 | −4.7 | −4.8 |
| 2019/2020 | −6.5 | −5.4 | −5.6 | −6.1 | −5.8 | −4.6 | −4.9 | −5.1 | −5.1 |
| 2020/2021 | −6.4 | −5.0 | −5.3 | −5.8 | −5.6 | −5.0 | −5.3 | −5.4 | −5.4 |
| 2021/2022 | −4.7 | −4.3 | −4.7 | −5.3 | −5.4 | −4.1 | −4.4 | −4.6 | −4.7 |
| 2022/2023 | −3.6 | −3.0 | −3.7 | −4.5 | −4.7 | −2.7 | −3.2 | −3.6 | −3.8 |
| 2013–2023 | −5.9 | −4.8 | −5.0 | −5.5 | −5.5 | −4.5 | −4.8 | −4.9 | −5.0 |
| Annual trend | 0.20* | 0.12 | 0.10 | 0.09 | 0.08 | 0.16 | 0.18 | 0.13 | 0.10 |
- * Statistically significant at p < 0.05.
3.1.2 Ground Temperature AWS-JGM
The mean annual ground temperature (MAGT) on AWS-JGM ranged from −4.8°C (5 cm) to −5.5°C (200 cm) during the period from 1 March 2013 to 28 February 2023. The highest MAGT was observed in 2022/23, with ground temperatures between −3.0°C (5 cm) and −4.7°C (200 cm), whereas the coldest year was 2015/16, with temperatures between −5.6°C (5 cm) and −6.0°C (200 cm). The mean monthly ground temperature at the depth of 5 cm was usually > 0°C for 4 months from November to February and occasionally exceeded 5°C in December and January. The warmest month recorded was December 2021 (7.4°C) (Figure 2). The mean TDD5e was 448°C·days (287 to 594°C·days) days, while the mean TDD5t reached 513°C·days (379 to 623°C·days) (Figure 3). The mean monthly temperature at a depth of 50 cm exceeded 0°C only in January and February. The recorded maximum was 1.3°C in January 2023 (Figure 2). The mean TDD50e reached 22°C·days (0°C·days in 2013/14 to 74°C·days in 2022/23). The mean TDD50t was only slightly higher (24°C·days), with a range from 0°C·days (2013/14) to 76°C·days (2022/23) (Figure 3).
The mean monthly ground temperature at a depth of 5 cm occasionally dropped below −15°C in winter. The coldest month was July 2019 (−19.1°C), when the lowest mean daily temperature of −26.5°C was recorded (1 July 2019). Mean FDD5 reached −2292°C·days (−2566°C·days to −1731°C·days). Mean monthly temperatures at a depth of 50 cm usually dropped below −10°C. The coldest month was July 2015 (−13.8°C), while the lowest mean daily temperature was recorded on 22 August 2021 (−16.1°C).
3.1.3 Ground Temperature AWS-CALM
The MAGT on AWS-CALM varied between −4.5°C (5 cm) and −5.0°C (200 cm). The highest MAGT was recorded in the 2022/23 season (−2.7°C at 5 cm and −3.8°C at 200 cm). The coldest year was 2015/16, with MAGT between −5.6°C (5 cm) and −5.8°C (50 cm) (Table 1). In a similar manner to AWS-JGM, the mean monthly ground temperatures at a depth of 5 cm on AWS-CALM were above 0°C in the period from November to February. The temperatures even exceeded 5°C in December and January. The warmest month was December 2021 (7.3°C at 5 cm) 2021 (Figure 2). The mean TDD5e was 452°C·days (345°C·days to 570°C·days) while the mean TDD5t was 497°C·days (381°C·days to 621°C·days) (Figure 3). In contrast to AWS-JGM, mean monthly temperatures at a depth of 50 cm exceeded 0°C in January and February. Furthermore, since 2017, positive monthly mean temperatures have also been observed in December. In particular, the mean monthly ground temperature at a depth of 50 cm exceeded 0°C in March 2016, 2020 and 2022. The maximum mean monthly temperature at a depth of 50 cm (3.3°C) was recorded in January 2023 (Figure 2). The mean TDD50e reached 107°C·days (63°C·days in 2018/19 to 183°C·days in 2022/23). The mean TDD50t was higher (134°C·days) with a range from 71°C·days (2018/19) to 210°C·days (2022/23) (Figure 3).
The mean monthly ground temperature at a depth of 5 cm usually dropped below −15°C during winter. The coldest month was July 2019 (−19.1°C). The lowest daily temperature was recorded on 20 August 2021 (−24.5°C). The mean monthly temperatures at a depth of 50 cm regularly dropped below −10°C. The coldest month was July 2015 (−15.6°C); the lowest mean daily temperature was −18.7°C (4 September 2020). The mean FDD5 reached −2121°C·days, with a range from −2510°C·days (2015) to −1605°C·days (2022) (Figure 3).
3.2 ALT and Thaw Depth
3.2.1 ALT Variability
The mean ALTs on study sites were 64 cm (AWS-JGM) and 88 cm (AWS-CALM). The maximum ALT of 73 cm (AWS-JGM) and 98 cm (AWS-CALM) was detected in 2022/23, while the lowest ALT was 51 cm (AWS-JGM) and 77 cm (AWS-CALM) in 2013/14. Statistically significant thickening trends reached 1.5 cm/year on AWS-JGM and 1.1 cm/year on AWS-CALM (Table 2). The date of maximum ALT occurrence was between 9 January and 21 February on AWS-JGM and between 25 January and 21 February on AWS-CALM (Table 2). The average thaw propagation period was 94 days (62 to 135 days) on AWS-JGM and 101 days (76 to 133 days) on AWS-CALM (Table 2).
| Season | AWS JGM | AWS-CALM | CALM-S JGM | ||||||||||||
|---|---|---|---|---|---|---|---|---|---|---|---|---|---|---|---|
| ALT (cm) | ALT date | Thawing season start | Season (days) | ALT (cm) | ALT date | Thawing season start | Season (days) | Probing date | Thaw depth | VWC (%) | Thaw depth MT | VWC MT (%) | Thaw depth WB | VWC MB (%) | |
| 2013/2014 | 51 | 24 February 2014 | 17 November 2013 | 69 | — | — | — | — | 5 February 2014 | 66 | — | 65 | — | 80 | — |
| 2014/2015 | 63 | 7 February 2015 | 24 November 2014 | 76 | 86 | 8 February 2015 | 25 November 2014 | 76 | 6 February 2015 | 78 | — | 73 | — | 102 | — |
| 2015/2016 | 65 | 5 February 2016 | 22 November 2015 | 76 | 88 | 8 February 2016 | 22 November 2015 | 79 | 29 January 2016 | 77 | — | 70 | — | 98 | — |
| 2016/2017 | 66 | 10 February 2017 | 29 September 2016 | 135 | 90 | 11 February 2017 | 2 November 2016 | 133 | 9 February 2017 | 80 | 15.6 | 75 | 13.9 | 100 | 21.4 |
| 2017/2018 | 59 | 9 January 2018 | November | 62 | 81 | 18 February 2018 | 10 November 2017 | 101 | 12 February 2018 | 75 | 21 | 66 | 19.6 | 106 | 27.3 |
| 2018/2019 | 56 | 5 February 2019 | 24 October 2018 | 105 | 77 | 7 February 2019 | 27 November 2018 | 104 | 12 February 2019 | 67 | 16.6 | 61 | 15.3 | 91 | 22.4 |
| 2019/2020 | 66 | 11 February 2020 | 9 November 2019 | 95 | 92 | 13 February 2020 | 10 November 2019 | 96 | 21 February 2020 | 80 | 16.9 | 75 | 14.9 | 102 | 25.1 |
| 2020/2021 | 66 | 12 February 2021 | 31 October 2020 | 105 | 92 | 13 February 2021 | 31 October 2020 | 106 | — | 83# | 16.7 | 73# | 15.5 | 107# | 20.4 |
| 2021/2022 | 71 | 12 February 2022 | 31 October 2021 | 105 | 92 | 13 February 2022 | 1 November 2021 | 105 | 9 February 2022 | 81 | 19.3 | 77 | 17.5 | 99 | 22.5 |
| 2022/2023 | 73 | 21 February 2023 | 6 November 2022 | 108 | 98 | 13 February 2023 | 6 November 2022 | 100 | 11 February 2023 | 93 | 13.4 | 85 | 12 | 124 | 21 |
| Mean | 64 | 5 February | 5 November | 94 | 88 | 12 February | 5 November | 100 | — | 82 | 16.1 | 75 | 15.3 | 103 | 22.3 |
| Trend (cm/year) | 1.5* | — | — | — | 1.1+ | — | — | — | — | 1.9* | — | 1.3+ | — | 2.2+ | — |
- # Data reconstructed using a regression model from AWS-JGM and AWS-CALM.
- * Significant at p < 0.05.
- + Significant at p < 0.1.
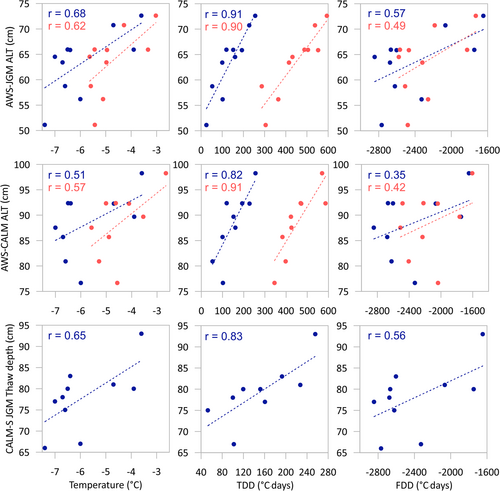
The strongest correlation was found between ALT and TDDAe (r = 0.91) and TDD5e (r = 0.90) on AWS-JGM. The relationships between ALT and annual temperatures were less pronounced, expressed by r = 0.68 (ALT vs MAAT) and r = 0.62 (ALT vs MAGT). ALT also strongly correlated with TDDAe (r = 0.82) and TDD5e (r = 0.91) on AWS-CALM. Nevertheless, only moderate correlations were observed between ALT and MAAT (r = 0.51) and MAGT (r = 0.57) (Figure 4).
3.2.2 Thaw Depth Distribution and Variability
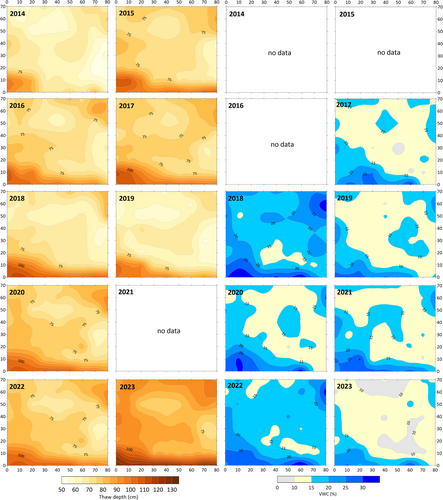
The mean active layer thaw depth on CALM-S JGM was 78 cm, with an annual range from 66 cm (2014) to 93 cm (2023) (Table 2). The year-to-year increase in thaw depths displayed a statistically significant thickening trend of 1.9 cm/year during the period 2014 to 2023 (Table 2). The maximum thaw depths increased from 100 cm (2014) to 130 cm (2023), while the minimum thaw depths increased from 51 cm (2014) to 72 cm (2023) (Figure 5). A clear pattern emerges in the thaw depth variation between the northern, larger grid area located on a Holocene marine terrace, with the thaw depths typically less than 80 cm, and the southern part, which is underlain by the Cretaceous sediments of the Whisky Bay Fm. Here, thaw depths regularly exceed 100 cm (Figure 5). A comparison of the reference zones revealed that the thaw depth on the Whisky Bay Fm. was, on average, 28 cm thicker than that of Holocene marine sediments, with a stronger thickening trend of 2.2 cm/year compared with 1.3 cm/year (Table 2). The thaw depth exhibited a very strong correlation with TDDAe (r = 0.83) and TDD5e both on AWS-JGM (r = 0.84) and AWS-CALM (r = 0.87). Strong correlations were found with MAAT and MAGT on AWS-JGM (both r = 0.67) and MAGT on AWS-CALM (r = 0.66) (Figure 4).
3.3 Surficial Volumetric Water Content
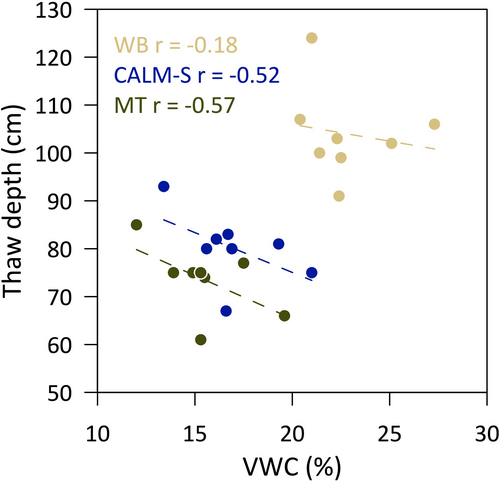
The mean surficial VWC on CALM-S JGM ranged from 13.4% (2023) to 21.0% (2018). Similar to ALT, the strongest gradient of VWC was observed in the southern part of CALM-S, where the wettest patches with soil moisture exceeding 25% were located. The annual maximums reached 31% (2023) to 38% (2022). In some years (2018, 2020 and 2022), the patches with VWC > 25% were also present in the northeast corner of the grid (Figure 6). The drier parts with VWC lower than 15% were presented mostly in a diagonal direction from northwest to southeast (Figure 6). The vast majority of the CALM-S JGM had VWC < 15% in 2023, including several larger patches with VWC < 10% detected in the north and southeast part (Figure 6). Overall, the VWC was about 7% higher in the reference part WB than in the part MT (Table 2; Figure 6). We found a moderate negative correlation (r = −0.52 and −0.57; statistically not significant) between mean thaw depth and mean VWC for the whole CALM-S JGM and for the part MT, respectively. A very weak negative correlation (r = −0.18; statistically not significant) was found in the MB part (Figure 6).
4 Discussion
4.1 Sustainability of CALM-S JGM
After 10 seasons, the monitoring experience, quality and representativeness of the dataset generated by the CALM-S JGM can be evaluated. Managing a CALM-S site in Antarctica is challenging, and several obstacles can be faced related to the climatic conditions and the general remoteness of the continent. This threatens the homogeneity of the dataset [15]. Some of the same problems were encountered with the CALM-S JGM, but overall, the grid provided a unique and consistent dataset.
Although the CALM-S JGM is located in a relatively flat area, it is possible to clearly distinguish between the two main lithological units, which is reflected in the variability of soil physical properties such as texture, density, moisture and thermal properties. In particular, soil thermal properties are considered the primary factor causing the variability of thaw depth on the CALM-S JGM [18]. As the site consists entirely of bare ground, there is no effect of vegetation [16] or organic matter or peat content (e.g. [6, 11]).
The variability of thaw depth on other CALM sites is also often related to uneven distribution of snow cover (e.g. [12, 16, 20]). However, our previous studies from the area of CALM-S JGM found that the typical snow cover was thinner than 30 cm and irregular. Therefore, the snow effect on the active layer thermal regime was generally negligible [30]. A notable influence of snow on the thaw depth was only observed in 2018 when short-term snow presence during the summer led to a distinctive reduction of the thaw depth [26].
Physical properties, namely soil texture, also affect the practical aspects of thaw depth probing. The sandy soil matrix of the marine terrace that forms the northern part of the CALM-S JGM provides favourable conditions for the probing, making it fast and reliable. However, this lithological unit represents only a small part of the total area of the Ulu Peninsula [37]. Due to the low values of soil thermal conductivity of this lithological unit, the ALT observed on the AWS-JGM is a few decimetres thinner than in other lowland areas of the JRI (e.g. [18, 38, 39]). On the other hand, the smaller part of the CALM-S JGM plot underlain by Cretaceous sediments can be considered representative for a much larger part of the Ulu Peninsula, as this particular lithological unit covers larger areas there [37]. Notably, the soil thermal properties determined for AWS-CALM are similar to other sites in the northern part of the Ulu Peninsula, which is also reflected in similar ALTs between 80 and 100 cm ([23]; unpublished data). However, this part of CALM-S is difficult to survey by mechanical probing due to the high adhesion of the silty to clayey soils and the presence of larger boulders hidden in the ground. For this reason, it was decided that the probing would be conducted in only 10 nodes of this lithological unit to ensure the sustainability of the monitoring.
Finally, logistical constraints preventing the measurement as close as possible to the time of maximum ALT represent a noticeable issue of CALM-S monitoring in Antarctica [15], which is the main objective on the Arctic CALM sites (e.g. [1]). In Antarctica, a difference of a few weeks between the probing and the maximum ALT occurrence is an issue, especially on the sites at the South Shetlands, where field probing is typically conducted in early February, while maximum ALT is observed in March or even April (e.g. [36]). Consequently, the reported thaw depth can be several decimetres thinner than the ALT [23]. In the case of CALM-S JGM, the maximum ALT was most often recorded between 5th and 13th February. Therefore, our approach of 2–3 measurements during the period from late January to late February ensures that the thaw depth measurement will be within a few days of the ALT maximum.
4.2 Effect of Thermal Regime and Moisture on Active Layer Thaw
Our results showed a very strong correlation between ALT/thaw depth and TDD of both air (r = 0.82 to 0.90) and ground (r = 0.90 to 0.91), confirming our observations, which generally neglect the role of the snow cover and the absence of other important factors such as vegetation or organic matter content, which typically reduce the correlation to r < 0.7 (e.g. [11, 12]). In contrast to summer temperature, the relationship between ALT/thaw depth and mean annual temperature or winter temperature was only moderate and statistically insignificant. However, a general pattern can be observed suggesting a thicker active layer in warmer years, including the winter season.
Unlike our recent study from the Abernethy Flats area on James Ross Island [39], the relationship between soil moisture and thaw depth on CALM-S were not statistically significant, which, is caused by the short dataset of only 7 years. Nevertheless, the negative correlation suggests the tendency of increasing thaw depth with decreasing surficial VWC. This pattern points towards a relatively even distribution of soil water in the profile, amplifying the effect of latent heat over the soil thermal conductivity (e.g. [40]).
4.3 Response of Active Layer to Climate Variability
In the Antarctic Peninsula region, the beginning of the 21st century until about 2012 to 2014 was connected with atmospheric cooling [41] and the associated impacts on the cryosphere, such as permafrost cooling, active layer thinning and glacier advance [42]. In particular, the active layer thinning of more than 1 cm/year was observed on James Ross Island [35] and the South Shetlands [21] during the period 2006 to 2015. However, our study period 2013/14 to 2023 was under the influence of a substantial increase in air temperature with a trend of 2.0°C/decade (significant at p < 0.05). As a result, observed ground temperatures increased by 0.8°C/decade (200 cm) to 1.8°C/decade (5 cm), but both trends are not statistically significant. Renewed warming was observed across all of the Antarctic Peninsula (e.g. [43]) and resulted in 2022 being the warmest year ever observed in the northeastern Antarctic Peninsula [44].
Thickening of the thaw depth by 1.9 cm/year (CALM-S JGM) and ALT by 1.5 cm and 1.1 cm on AWS-JGM and AWS-CALM, respectively, resulted from the strong relationship between thaw depth and summer temperatures. These trends were higher than reported in the period 2012 to 2021 [27], emphasising the effect of the warm period after 2015. When analysing the complete dataset of ALT available for AWS-JGM (2012 to 2023), the ALT thickening reached 1.1 cm/year.
These results are consistent with the global behaviour of the active layer, which shows thickening trend rates between 0.27 and 4.0 cm/year in the period 1995 to 2020 [4-6, 12, 23]. The only area with a relatively stable or even decreasing active layer was found in the Dry Valleys in Antarctica, where the trends ranged from −0.5 to 0.04 cm/year [23].
5 Conclusions
CALM-S JGM is the first continuously operated CALM site in the northeastern part of the Antarctic Peninsula region. Although the site has atypical dimensions of 80 × 70 m, it provides valuable results on the thermal regime and thickness of the active layer. Results from 2013/14 to 2022/23 confirmed our initial hypothesis that distinctive lithology can significantly affect ALT and thaw depth at CALM-S JGM. The active layer was, on average, 24 cm thicker on AWS-CALM than on AWS-JGM, although TDD was higher on AWS-JGM. The thaw depth was, on average, 28 cm thicker in the part formed by Cretaceous sediments compared with marine sediments. ALT and thaw depth showed significant thickening trends between 1.1 and 2.2 cm/year, which can be associated with the 2.0°C increase in air temperature during the study period. Finally, surface soil moisture distribution was clearly affected by distinctive lithology. On average, soil moisture was 7.3% higher in the silty soils of the Whisky Bay Fm. than in the sandy soils of the Holocene marine terrace. The negative correlation between annual mean soil moisture and active layer thaw depth further suggests that soil drying will favour active layer deepening on the CALM-S JGM. However, this assumption so far lacks statistical significance due to the temporal limitation of moisture monitoring.
Acknowledgments
The authors would like to thank Czech Antarctic Research Programme and the crew of the Johann Gregor Mendel for field support, namely, Zdeněk Stachoň, Jakub Ondruch, Matěj Roman, Jana Smolíková, and Zbyněk Engel who participated in the CALM-S measurement fieldwork. Open access publishing facilitated by Masarykova univerzita, as part of the Wiley - CzechELib agreement.
Open Research
Data Availability Statement
Data are available upon request.


