Analysis of miRNAs responsive to long-term calcium deficiency in tef (Eragrostis tef (Zucc.) Trotter)
Abstract
MicroRNAs (miRNAs) play an important role in growth, development, stress resilience, and epigenetic modifications of plants. However, the effect of calcium (Ca2+) deficiency on miRNA expression in the orphan crop tef (Eragrostis tef) remains unknown. In this study, we analyzed expression of miRNAs in roots and shoots of tef in response to Ca2+ treatment. miRNA-seq followed by bioinformatic analysis allowed us to identify a large number of small RNAs (sRNAs) ranging from 17 to 35 nt in length. A total of 1380 miRNAs were identified in tef experiencing long-term Ca2+ deficiency while 1495 miRNAs were detected in control plants. Among the miRNAs identified in this study, 161 miRNAs were similar with those previously characterized in other plant species and 348 miRNAs were novel, while the remaining miRNAs were uncharacterized. Putative target genes and their functions were predicted for all the known and novel miRNAs that we identified. Based on gene ontology (GO) analysis, the predicted target genes are known to have various biological and molecular functions including calcium uptake and transport. Pairwise comparison of differentially expressed miRNAs revealed that some miRNAs were specifically enriched in roots or shoots of low Ca2+-treated plants. Further characterization of the miRNAs and their targets identified in this study may help in understanding Ca2+ deficiency responses in tef and related orphan crops.
1 INTRODUCTION
The role of miRNAs in response to multiple nutrient stress conditions such as calcium (Ca2+) starvation, sodium toxicity, and potassium (K) and iron (Fe) deficiencies has been documented (Hu et al., 2015). Two miRNAs, miR827 and miR2111, are known to be involved in ubiquitin-mediated degradation of their target protein under phosphate (P) starvation (Hackenberg et al., 2012; Hsieh et al., 2009). Besides their roles under Pi-deficiency, miR2111, miR827, and miR399 are involved in conditions of nitrogen (N) starvation (Liang et al., 2012). Other miRNAs such as miR156, miR160, miR170, miR169, miR172, and miR393 (Li et al., 2016; Tiwari et al., 2020) respond to N deficiency through altering root architecture and nodule development. Some miRNAs have been implicated in additional mineral deficiencies such as K, copper (Cu), Fe, manganese (Mn), and zinc (Zn) (Nath & Tuteja, 2016; Waters et al., 2012). For example, overexpression of OsmiR399 results in increasing the expression level of Ca channel gene in rice6, while Chen et al. (2019) reported that some miRNAs and their target genes may be implicated in embryo abortion induced by Ca2+ deficiency in peanut.
However, while calcium (Ca2+) signaling has been studied previously in plants (Rudd & Franklin-Tong, 1999), very little is known about Ca2+-deficiency-responsive miRNAs, including their potential role in tef growth and development. Calcium is one of the macronutrients required by plants in larger quantities; it is an integral part of plant cell structures and is the most ubiquitous second messenger in environmental stress signaling. Plants absorb Ca2+ from the soil through cation channels and the apoplast, and translocated to the shoot through the xylem via the transpiration stream (White, 2001). Ca2+ is stored in the plant cell in the endoplasmic reticulum (ER), vacuole and plasmalemma; however, cytosolic Ca2+ undergoes rapid changes in concentration in response to various stresses (Kaplan et al., 2006; Taylor et al., 1988). Storage pathways and transport systems are involved in handling cellular Ca2+ in response to environmental stimuli. ER-localized ECA (P2A-type Ca2+-ATPases), CAX (Ca2+/H+ antiporters), and tonoplast-localized ACA (autoinhibited Ca2+-ATPases) are some of the calcium transporters involved in dampening cytoplasmic Ca2+ concentration (Demidchik et al., 2018; Robertson, 2013). Excess cytoplasmic Ca2+ can be removed to the vacuole by the ACA11 and ACA4 transporters. Knocking out genes ACA11 and ACA4 in Arabidopsis (Arabidopsis thaliana) resulted in programmed cell death in the mesophyll causing microlesions on the leaves, particularly at the margins, which was suppressed by adding exogenous Ca2+ treatment (Boursiac et al., 2010). Additional transporters (ECA1 and ECA3) are also important for Ca2+ and Mn2+ homeostasis between the ER and the cytoplasm of plant cells (Su et al., 2016).
Different Ca2+ signatures regulate the response of plants to signals. These signatures cover a range of Ca2+ sensor families such as Calmodulins (CaM), Calmodulin-like proteins (CMLs), Ca2+ CDPKs, and Calcineurin B-like proteins (CBLs) and CBL-interacting kinases (CIPKs). These Ca2+ sensors are encoded by multiple gene families and generate complex signaling networks that enable information processing to be specific, resilient and adaptable. For example, there is increasing evidence that CDPKs participate in environmental stress signaling. In Arabidopsis, exposure to cold, salt, and drought resulted in elevation of CDPK transcript levels (Taèhtiharju et al., 1997) and overexpression of OsCDPK7 in rice (Oryza sativa) increased cold and salt-tolerance (Saijo et al., 2000). NtCDPK1 transcription in tobacco (Nicotiana tabacum) was shown to be responsive to non-specific elicitors and mechanical injury (Yoon et al., 1999). In addition, CDPK enzyme activity has been linked to osmotic stress and elicitation in a more physiological setting (Takahashi et al., 1997).
Tef belongs to the Chloridoideae subfamily of Poaceae along with finger millet (Eleusine caracana). It is widely cultivated in the Horn of Africa, primarily Ethiopia, affords staple food for over 60 million people (VanBuren et al., 2020), and is becoming popular in many countries as a food and forage crop (Cheng et al., 2017; Lee, 2018). Tef is traditionally grown under short-day (11–13 h) photoperiod (van Delden et al., 2012) and is adapted to a variety of soil type ranging from sand to water-logged clay at neutral pH. The grains contain higher, or similar, levels of protein, fiber, fat, starch, and vitamin C as wheat (Triticum aestivum), barley (Hordeum vulgare), rice (O. sativa), maize (Zea mays), oat (Avena sativa), and sorghum (Sorghum bicolor) (Abewa et al., 2019; Cheng et al., 2017). Further, tef grains contain higher levels of macronutrients (Ca, K, and Mg) (Abebe et al., 2007; Umeta et al., 2005) and micronutrients (Fe, Zn, and Mn) than other cereal crops (Dame, 2020; Ermias et al., 2019; Ligaba-Osena et al., 2021). Thus, tef has considerable potential for nutrient biofortification for humans, which could be especially valuable for children (Daba, 2017; Pucher et al., 2014) and women in East Africa. In addition, tef grains may be a better alternative diet for people with type 2 diabetes, due to its low glycemic index, and for people with gluten intolerance or celiac disease due to its gluten free grains (Shumoy et al., 2018). Despite its significant potential as a healthy food and forage crop, tef is considered an orphan crop with limited research attention. Recently, stress tolerance studies in tef, such as lodging (Assefa et al., 2011; Blösch et al., 2020) and drought (Blösch et al., 2019; Ferede et al., 2020; Martinelli et al., 2018) have begun to emerge. Martinelli et al. (2018) perfomed microRNA profiling of tef under drought conditions in contrasting genotypes and reported 13 and 35 deferentially regulated miRNAs in drought-susceptible (Alba) and drought-tolerant (Tsedey) tef genotypes, respectively.
However, miRNA profiling of tef under mineral deficiency stress has never been investigated. The aim of the present study was to identify tef miRNAs that may play a role in maintaining homeostasis under low Ca2+ conditions. We performed miRNA profiling of roots and shoots of tef plants exposed to long-term Ca2+ deficiency. Our findings reveal a large number of differentially expressed miRNAs (DEMs) including some that are novel. We also identified several putative targets which may play a role in Ca2+ signaling, uptake, transport, or metabolism. To our knowledge, this is the first report detailing miRNA responses to long-term Ca2+ deficiency in tef. Further research will characterize the physiological role of novel miRNAs and target genes in Ca2+ homeostasis in tef.
2 RESULTS
2.1 Phenotype changes of tef seedlings exposed to low Ca2+
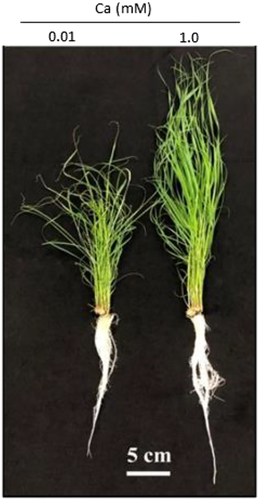
Although tef is known to accumulate high levels of Ca2+ in both the straw and grains, the effect of low Ca2+ treatment on tef growth and development are unknown. In this study, 6-day-old seedlings were transferred to control (1 mM Ca2+) or low Ca2+ (.01 mM) hydroponic solution and plants were evaluated after 4 weeks of growth. As shown in Figure 1, low Ca2+ treatment decreased plant growth as compared to control plants. Ca-deficient plants exhibited symptoms including leaf necrosis, leaf curling, and growth stunting, while control plants produced more biomass without marked symptoms. Roots of control plants were slightly longer than those grown in low Ca2+ solution, but there was no marked difference in root mass between low and optimal Ca2+.
2.2 Characterization of small RNAs via high-throughput sequencing
We performed here miRNA sequencing of control and Ca2+-deficient roots and shoots to understand the pattern of miRNA expression in tef. miRNA-seq was performed using the Illumina HiSeq 2500. After filtering raw sequencing reads, clean reads were mapped to small RNA (sRNA), transfer-RNA (tRNA), ribosomal-RNA (rRNA), and small nuclear RNA (snoRNA) (Table 1). The number of raw reads ranged from ~8.9–22 million in the four replicates of roots treated with low calcium (LCR); after filtering, ~7.5 to 18.1 million clean reads were obtained. Similarly, in shoots under low calcium conditions (LCS), the number of raw reads ranged from ~14.7–44.7 million and after filtering, the number of clean reads ranged from ~13.1–39.9 million reads. Overall, more reads were obtained from shoots as compared to roots under low Ca condition (Table 1). Furthermore, higher sRNA reads (~4.1–9.7 million in roots and over ~7.5–21.5 million in shoots) were detected as compared to tRNA, rRNA, and snoRNA. In control roots (root treated with 1 mM Ca2+, ConR), the number of raw reads ranged from ~22.9 million to 43.1 million; however, after filtering, the range of clean reads was ~20–37.4 million. Similarly, in control shoots, designated as ConS, the number of raw reads ranged from ~17.1–38.9 million, while after filtering, the number of clean reads ranged from ~14.9–36.1 million. Overall, higher sRNA reads were observed for samples from ConR plants as compared to low Ca2+ plants. Moreover, variation in the number of sRNAs was observed between samples, tissues and Ca2+ treatment (Table 1).
| Name | Repeats | Items | |||||
|---|---|---|---|---|---|---|---|
| Raw reads | Clean reads | sRNA | tRNA | rRNA | snoRNA | ||
| LCR | LCR1 | 8,865,129 | 7,491,569 | 4,114,563 | 124,877 | 685,364 | 12,907 |
| LCR2 | 21,998,245 | 18,060,789 | 9,692,370 | 271,917 | 1,836,884 | 31,089 | |
| LCR3 | 18,525,423 | 15,149,488 | 8,294,386 | 205,582 | 1,480,771 | 25,451 | |
| LCR4 | 13,336,135 | 11,320,721 | 6,377,360 | 121,814 | 1,054,652 | 20,152 | |
| LCS | LCS1 | 14,705,848 | 13,066,806 | 7,539,361 | 165,637 | 874,071 | 16,550 |
| LCS2 | 44,670,279 | 39,905,683 | 21,508,548 | 592,717 | 1,920,837 | 37,234 | |
| LCS3 | 26,480,710 | 23,956,008 | 13,923,636 | 327,691 | 1,575,414 | 27,617 | |
| LCS4 | 18,011,425 | 16,198,449 | 9,438,645 | 229,519 | 954,673 | 19,870 | |
| ConR | ConR1 | 32,258,808 | 28,393,511 | 15,666,870 | 617,873 | 1,644,863 | 53,607 |
| ConR2 | 24,262,362 | 21,212,843 | 11,068,091 | 556,060 | 1,236,688 | 37,782 | |
| ConR3 | 22,906,060 | 19,972,636 | 11,441,918 | 199,000 | 1,743,775 | 40,172 | |
| ConR4 | 43,108,797 | 37,442,841 | 20,055,757 | 328,243 | 2,435,990 | 56,365 | |
| ConS | ConS1 | 28,672,935 | 25,883,553 | 14,619,111 | 503,416 | 1,283,629 | 23,208 |
| ConS2 | 17,067,621 | 14,873,274 | 5,368,773 | 176,699 | 676,398 | 11,109 | |
| ConS3 | 36,900,806 | 34,093,754 | 19,209,198 | 605,904 | 1,194,634 | 24,912 | |
| ConS4 | 38,869,261 | 36,071,793 | 20,108,302 | 552,624 | 1,504,158 | 30,881 | |
| Total | 410,639,844 | 363,093,718 | 198,426,889 | 5,579,573 | 22,102,801 | 468,906 | |
- Note: miRNA sequencing was performed in control and calcium deficient root and shoots. Clean reads were mapped to different classes of RNAs (sRNA, tRNA, rRNA, and snoRNA). Treatments are LCR, low Ca2+ root; LCS, low Ca2+ shoot; ConR, control root; ConS, control shoot. Each treatment was replicated four times.
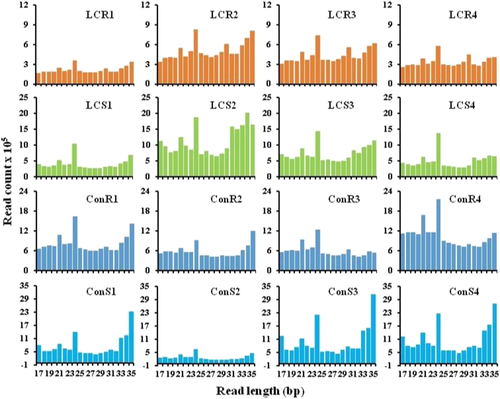
The sizes of detected sRNA in both low Ca2+ and control treatments were in the range of 17 to 35 nt (Figure 2 and Table S1). In most samples from low Ca2+ treatment, 24-nt reads were more abundant than other sRNAs. Furthermore, the read number in the LCS was higher than the LCR. The size distribution of the sRNAs observed in control samples was similar with that of low Ca2+ samples. Reads with 21- and 35-nt reads were more abundant in ConS (Figure 2 and Table S1) while 21- and 24-nt reads were more abundant for most ConR.
2.3 miRNA identification
Across all samples, 350 unique novel and 161 already known miRNAs were identified as shown in Tables S2 and S3, and the total novel and known miRNAs along with their read counts for all the treatments LCR, LCS, ConR, and ConS are listed in Table 4. All miRNAs were found to have predicted hairpin structure, which is conserved among regulatory miRNAs. Homologous sequences were not found in miRbase (http://www.mirbase.org/) for all novel miRNAs, which were derived from the 3′ and 5′ sequences (referring to the position within the hairpin). Furthermore, a total of 161 known miRNAs that we identified in this study are homologous to those previously reported in tef and other plant species. For example, 14 miRNAs matched those previously identified in tef including tef-miR1219b_5p, tef-miR461a_3p, and tef-miR5387a_5p tef (Martinelli et al., 2018); 45 miRNAs matched to Brachypodium distachyon miRNAs including bdi-miR160a-5p, bdi-miR168-3p, bdi-miR393a, and bdi-miR2118a (Unver & Budak, 2009); 47 miRNAs matched to miRNAs identified previously in rice including osa-miR408-5p, osa-miR399a, and osa-miR396e-5p (Li et al., 2005); 29 miRNAs matched to A. thaliana miRNAs including ath-miR164a, ath-miR167a-5p, and ath-miR156a-5p (Rajagopalan et al., 2006); six miRNAs matched to Camelina sativa (cas-miR166c-3p) (Poudel et al., 2015); and six miRNAs matched to Z. mays including zma-miR156a-3p, zma-miR162-5p, and zma-miR529-5p (Gupta et al., 2017); 10 miRNAs matched to Glycine max including gma-miR156k, gma-miR166h-3p, and gma-miR169e (Joshi et al., 2010); three miRNAs matched to Citrus trifoliata (ctr-miR166 and ctr-miR171) (Song et al., 2010); and one miRNA matched to the previously identified miRNA in Avicennia marina (ama-miR156) (Khraiwesh et al., 2013) (Table S3).
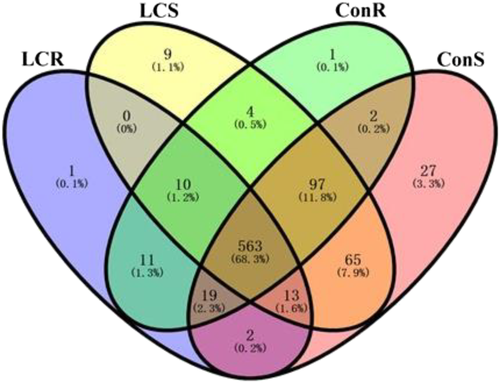
The Venn diagram in Figure 3 shows miRNAs uniquely or commonly expressed in the four groups (LCR, LCS, ConR, and ConS). In low Ca2+ treatment, the number of miRNAs detected in roots was 619, 563 (68%) miRNAs were commonly expressed across all the samples, 11 were commonly expressed in LCR and ConR, two were expressed in LCR and ConS, 10 were expressed in LCR, LCS, and ConR, 19 were common to LCR, ConR and ConS, and 13 were common to LCR, LCS, and ConS. Only one miRNA was uniquely detected in the LCR. The total number of miRNAs in the shoots of low Ca2+ treatment (LCS) was 761 including the 563 miRNAs that are commonly detected under all treatments. Four were commonly expressed in LCS and LCR, 10 were common to LCS, LCR, and ConR, 13 were common to LCS, LCR, and ConS, 65 were common between LCS and ConS, and 97 were commonly expressed among the LCS, ConR, and ConS while nine were uniquely detected in LCS. Similarly, a total of 707 miRNA were detected in the ConR. Pairwise comparison of miRNAs and those commonly detected in the four groups (ConS, ConR, LCS, and LCR) is shown in Figure 3. A total of 788 miRNAs were detected in ConS, of which only 27 miRNAs were uniquely expressed while the remaining were commonly expressed also in roots and under low Ca2+ condition.
2.4 Differentially expressed miRNAs
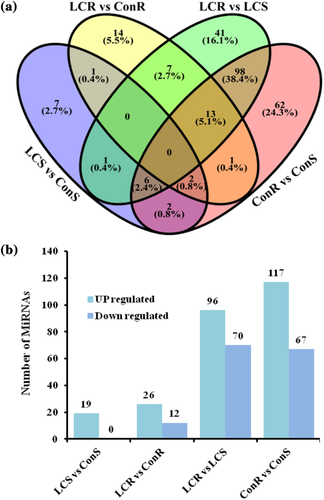
The expression levels of miRNAs were analyzed in shoots and roots of control and low Ca2+ treatment. For both Ca2+ treatments, the number of DEMs was higher in roots than shoots (LCR vs. LCS and ConR vs. ConS) (Figure 4). Pairwise comparison of miRNAs detected in different treatments is shown in Figure 4a. A total of 19 DEMs were detected in LCS compared to ConS, whereas 38 DEMs were detected in LCR compared to ConR. Moreover, 166 DEMs were detected in LCR compared to LCS, while 184 were expressed in ConR compared to ConS. Interestingly, there were no DEMs common to the different comparisons (LCS vs. ConS, LCR vs. ConR, LCR vs. LCS and ConR vs. ConS). Similarly, there was no DEMs common to LCS versus ConS, LCR versus ConR, and LCR versus LCS. In the LCS, 19 miRNAs were upregulated compared to ConS, while there were no downregulated miRNAs detected in LCS compared to ConS (Figure 4b and Table S5). Expression of 26 miRNAs was higher in LCR compared to ConR including tef-novel-201_5p, known112_5p and known046_3p, while 12 miRNAs were downregulated in LCR compared to ConR including tef-novel-314_3p and known157_5p (Figure 4b and Table S5). The number of DEMs between root and shoot tissues is greater than those differentially expressed between the Ca2+ treatments. A total of 96 miRNAs were upregulated including known155_3p, tef-novel-043_5p, tef-novel-043_3p, known117_5p, and known118_5p in LCR as compared to LCS, while 70 miRNAs were downregulated in LCR including tef-novel-067_5p, tef-novel-067_3p, known084_5p, known085_5p, known084_3p, and known085_3p compared to LCS (Figure 4b and Table S5). Similarly, 117 miRNAs were upregulated, while 67 miRNAs were downregulated in ConR compared to ConS (Figure 4b and Table S5). Comparing both roots and shoots of plants grown under low calcium condition, 96 miRNAs were upregulated while 70 miRNAs were downregulated in LCR compared to LCS. Taken together, miRNA expression is tef appears to be more influenced by the tissue type than the Ca2+ levels.
2.5 Identifying miRNA targets
As described in methods section, an online database “psRNA Target Server” (http://biocomp5.noble.org/psRNATarget/) (Dai & Zhao, 2011) was used to understand the possible function of the miRNAs., miRNA targets with the expectation scores of 0 to 3.5 were selected as target genes (Table 6). Target genes which are involved in certain functions were identified for each DEMs and listed in Table S7. A total of 11,458 putative target genes were identified for the miRNAs. Among these, 5606 genes were annotated. Furthermore, among the annotated set, 817 genes belong to an uncharacterized gene family (Table S7) while the remaining target genes belong to gene families that are known to participate in various biological processes including ion transport, signaling, and transcriptional regulation.
The predicted miRNA target transporter genes include cation transporters (calcium-transporting-ATPase-10,-plasma-membrane-type, calcium-transporting-ATPase-4,-endoplasmic-reticulum-type, copper-transporting ATPase HMA5, and zinc_transporter_6), phosphate transporters (inorganic-phosphate-transporter-2-1,-chloroplastic), various sugar transporters (sugar-transport-protein-7, sugar-transport-protein-MST3, MST4, and MST6), a sucrose transporter (sucrose_transport_protein_SUT1), several polyamine transporters, chloride channels (Table S9), as well as plasma membrane-type and endoplasmic reticulum-type ATPase 4 (Table S7). Similarly, several genes involved in signaling, including calcium-dependent protein kinases (CDPK 1, CDPK 8, CDPK 9, CDPK 12, CDPK 13, CDPK 20, and CDPK 4 isoform X2) were identified as target of the miRNAs (Table S7). Other identified miRNA target genes were auxin response factors (ARF8, ARF10, ARF12, ARF14, ARF17, ARF18, ARF22, and ARF25). Moreover, transcription factors such as WRKY (WRKY24, WRKY27, and WRKY48), leucin zipper protein targets (HOX9, HOX10, HOX11, HOX14, HOX20, HOX32, and HOX33), heat stress factor gene (heat-stress-transcription-factor-A-3) (Table S7), and NAC-domain containing proteins (NAC7, NAC21/22, NAC43, NAC79, and NAC92) were detected (Table S8). However, none of these proteins have been characterized in tef, and their role in plant growth and development remains unknown.
2.6 Gene ontology (GO) analysis
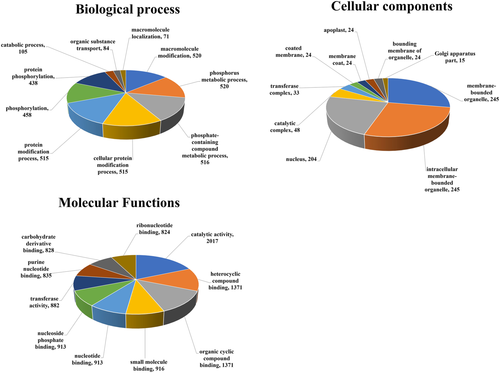
To predict the involvement of miRNAs targets in various processes, we performed GO analysis using the AgriGo website (http://bioinfo.cau.edu.cn/agriGO/). A total of 15,498 identified target genes were classified into three major categories; 3742 genes were grouped into the biological process, 886 genes were grouped into the cellular component, and 10,870 genes were grouped into the molecular functions categories (Figure 5). Of the genes grouped into the biological process category, the majority of them may be involved in metabolic process including macromolecule modification, phosphorous metabolism, metabolism of phosphate containing compounds, and protein modification processes including protein phosphorylation. From the cellular components category, the majority of target genes were associated with organelles, membrane, and the nucleus. In the molecular functions category, most of the miRNA target genes were associated with catalytic activity and substrate binding functions including heterocyclic compound binding, organic cyclic compound binding, small molecule binding, nucleotide binding, and nucleotide phosphate binding (Figure 5).
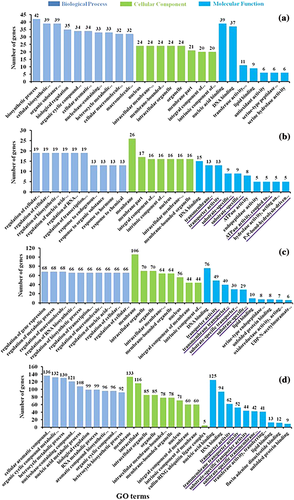
Furthermore, GO analysis of target genes of DEMs was performed for the pairwise comparisons (LCR vs. ConR, LCS vs. ConS, LCR vs. LCS, and ConR vs. ConS; Figure 6). For all comparisons, most of the miRNA target genes are involved in nucleic acid binding and/or DNA bining from the molecular functions category. Whereas in comparisons LCS versus ConS, LCR versus LCS, and ConR versus ConS, most target genes are also involved in trasport activitites. From the cellular compontent category, most target genes were associated with membranes for these comparisons (Figure 6). In the biological process category, there appears to be no similarity in the fuctons of the miRNA target genes between the four comparisons (LCR vs. ConR, LCS vs. ConS, LCR vs. LCS, and ConR vs. ConS).
3 DISCUSSION
It is well documented that miRNAs regulate plant growth and developmental processes. Certain miRNAs are known to modulate activities in most plant tissues and organs (Saliminejad et al., 2019; Voinnet, 2009). During developmental processes, and in response to environmental changes, rapid and subtle changes in mRNA or protein profiles may be necessary, which can be accomplished, in part, by miRNA-mediated mRNA decay or translation regulation (Duarte et al., 2013). Non-coding RNAs, including siRNAs and miRNAs, were discovered recently to play a role in plant responses to nutrient sensing, deficiency, uptake, transport, and homeostasis (Kumar et al., 2017; Paul et al., 2015). However, to date, there is no report in tef on the pattern of expression of miRNA and their potential roles in response to prolonged Ca2+ deficiency.
It has been reported in several plant species that expression of some miRNAs respond to nutrient deficiency such as K (Zeng et al., 2019), Mg (Liang et al., 2017), P (Du et al., 2018; Kuo & Chiou, 2011), and N (Liang et al., 2012; Sinha et al., 2015). However, the pattern of miRNA expression in response to Ca2+ deficiency remains unknown. In this study, we analyzed miRNA expression in roots and shoots of tef plants gown under optimal Ca2+ and prolonged Ca2+ deficient condition. We identified 2875 miRNAs in both control and low Ca2+ treatments, of which 1495 miRNAs were detected in the control while 1380 miRNAs were detected in the low Ca2+ treated plants. Furthermore, in control samples, 707 miRNAs were detected in roots and 788 miRNAs were detected in shoots. Similarly, in the low Ca2+ calcium treatment, 619 miRNAs were detected in the roots, and 761 miRNAs were detected in the shoots (Figure 3A). Previously, drought responsive miRNAs were identified in roots and shoots of two tef genotypes (Martinelli et al., 2018).
Novel miRNAs have been reported in the past few years and their roles in plant stress physiology are being revealed (Kozomara & Griffiths-Jones, 2014). For example, miR169 which is the highly conserved plant miRNA, and miRNA159 have been implicated in plant abiotic stress responses (Abdelrahman et al., 2018; Li, Oono, et al., 2008; Zhao et al., 2011). Shinde et al. (2020) identified 14 novel miRNAs in pearl millet in response to salinity. In our study, we identified a total of 348 novel, and 161 knowns, miRNAs in response to Ca2+ deficiency that are predicted to be associated with various processes.
The predicted miRNA sequences (read counts of known and novel miRNAs) and their targets are presented in Tables S4 and S7. The miRNAs were distributed in both roots and shoots of control and low calcium treatment plants. One of the miRNAs, tef-novel-259_3p (Tables 2, S5, and S6), we identified in this study was homologous to a sequence previously reported in rice to be responsive to drought, iron, and senescence (Ricachenevsky et al., 2010). We could not identify a homologous sequence in the miRBase database for this particular miRNA (http://www.mirbase.org/). We identified “known miRNAs” (Table S3) by comparing our sequences to the already annotated miRNAs in miRbase. We observed that the tef miRNA sequences match well with closely related model and other plant species including O. sativa (under abiotic stresses) (Jian et al., 2010), B. distachyon (Unver & Budak, 2009), A. thaliana (Wang et al., 2004), C. sativa (Poudel et al., 2015), Z. mays (under phosphate stress) (Gupta et al., 2017), G. max (Joshi et al., 2010), C. trifoliata (Song et al., 2010), and A. marina (Khraiwesh et al., 2013). Furthermore, we performed pairwise comparison on miRNAs detected in both control and low Ca2+ treated roots and shoots. We detected a total of 563 miRNAs in all four groups (ConR, ConS, LCR, and LCS) (Figure 3A). Ten miRNAs were responsive to Ca2+ deficiency in both roots and shoots, which were not detected in control samples, as shown in the Venn diagram (Figure 3a). Mineral deficiency alters the expression of certain miRNAs in plants (Liang et al., 2017; Ye et al., 2021). Differential expression of miRNAs under various abiotic and biotic stress conditions, including nutrient deficiency, has been well documented in the model plant Arabidopsis (Kawashima et al., 2009; Yamasaki et al., 2007).
| Target gene ID | miRNA_Acc. | Log2 fold change | miRNA role | Target gene function | ||||
|---|---|---|---|---|---|---|---|---|
| LCS_ConS | LCR_ConR | LCR_LCS | ConR_ConS | |||||
| 1 | Et_10A_001249 | known122_5p | −.62 | NA | NA | .03 | Cleavage | calcium_uniporter_protein_6, mitochondrial |
| 2 | Et_4A_034619 | known154_3p | 4.69 | .39 | −3.96 | −8.53 | Cleavage | calcium-transporting_ATPase_10, plasma membrane-type |
| 3 | Et_9B_064669 | Tef-novel-277_3p | −1.43 | −1.25 | 2.20 | 2.59 | Cleavage | calcium-dependent_protein_kinase_1 |
| 4 | Et_7B_054972 | tef-novel-126_5p | NA | NA | NA | NA | Cleavage | calcium-dependent_protein_kinase_12 |
| 5 | Et_1B_010435 | known119_5p | −0.15 | NA | 4.38 | 6.22 | Translation | transmembrane_9_superfamily_member_1 |
| 6 | Et_7A_050904 | known021_5p | −.17 | −.70 | 3.04 | 2.15 | Cleavage | transport_inhibitor_response_1-like_protein_Os04g0395600 |
| 7 | Et_4B_039149 | tef-novel-273_3p | 0.10 | −1.97 | −5.11 | −7.55 | Cleavage | calcium-transporting_ATPase_4, endoplasmic reticulum-type |
| 8 | Et_2B_021459 | tef-novel-238_3p | −1.46 | 3.98 | −1.38 | 3.74 | Cleavage | CDPK-related_kinase_3 |
| 9 | Et_5A_041939 | tef-novel-324_3p | .78 | −1.46 | −1.75 | −4.26 | Cleavage | chaperone_protein_ClpB2,_chloroplastic |
| 10 | Et_1A_006105 | tef-novel-291_3p | −1.80 | 1.82 |
−.32 |
3.61 | Cleavage | chlorophyllase-2,_chloroplastic_isoform_X2 |
| 11 | Et_1A_008162 | tef-novel-129_3p | .35 | 0.10 | −.07 | −.64 | Cleavage | chloride_channel_protein_CLC-f_isoform_X1 |
| 12 | Et_2A_014514 | tef-novel-262_3p | 1.55 | 1.27 | −1.58 | −1.74 | Cleavage | chlorophyll_a-b_binding_protein_1,_chloroplastic |
| 13 | Et_10B_004030 | known017_3p | −.26 | 2.83 | 0.10 | 3.03 | Cleavage | disease_resistance_protein_RGA2 |
| 14 | Et_7A_052173 | tef-novel-259_3p | −2.17 | −1.35 | −.25 | .85 | Cleavage | probable_WRKY_transcription_factor_14 |
All the novel and known miRNAs that we detected in this study appeared to have potential target genes with corresponding function. Target prediction of the miRNAs helps in understanding the specific functions, as well as the regulation of these miRNAs (Sun, 2012). Most plant miRNAs have perfect, or nearly perfect complementarity to their targets, which provides a reliable basis for the identification of miRNA targets (Rhoades et al., 2002; Zhang et al., 2007). In this study, the target genes for the miRNAs we identified are associated with various biological and molecular functions (Tables 2 and S7–S9). These results are consistent with previous reports which suggested that miRNAs have several target genes (Reinhart et al., 2002; Zhou et al., 2010).
For example, some of the novel miRNAs we identified in this study, tef-novel-277 3p and tef-novel-126_5p, are predicted to target CDPK genes (Tables 2 and S7). A known miRNA we detected in this study (known122_5p: ID: Et_10A_001249) is predicted to target mitochondrial calcium uniporter protein 6 (MCU6) (Tables 2 and S7). We also identified additional novel miRNA such as tef-novel-273_3p, which is predicted to target ER calcium-transporting ATPase4 (ECAs4) (Tables 2 and S7), and novel miRNA (tef-novel-238_3p), that is predicted to target CDPK-related kinase 3 (CRK3) (Tables 2 and S7). The physiological functions in tef of the predicted targets, for example, CDPK1, CUP4, ECAs4, and CRK3, remain unknown. However, the CDPKs and CRKs in other plant species are implicated in various developmental processes and biotic and abiotic stress responses (Yip Delormel & Boudsocq, 2019; Zhao et al., 2021). The CDPK1 is involved in gibberellic acid biosynthesis and drought stress tolerance in rice (Asano et al., 2005; Ho et al., 2013), and in wheat, it has been reported that CDPK1 regulates biotic and abiotic stress response (Li, Wang, et al., 2008; Wei et al., 2016). The ECA proteins are primary active transporters of Ca2+ and Mn2+ (He et al., 2021), and MCU proteins are implicated in Ca2+ uptake into the mitochondrial matrix; the AtMCU1 has been shown to function as a Ca2+ permeable channel (Teardo et al., 2017).
Another miRNA (known050_5p) regulates the inorganic-phosphate-transporter-2-1,-chloroplastic. In Arabidopsis, PHT2;1 has been reported to affect P allocation within the plant, and to modulates P-starvation responses (Versaw & Harrison, 2002). Phosphate transporter genes were previously reported to enhance phosphate acquisition in rice (Ruili et al., 2020). The wheat TaPHT2 was reported to translocate P, and regulate plant growth under limited supply of P (Guo et al., 2013). Besides transporters and signaling genes, we predicted that some miRNAs, including miRNA tef-novel-259_3p, would target transcription factors like probable_WRKY_transcription_factor_14. Other miRNAs, such as tef-novel-114_3p, may target auxin response factors (Table S7). We identified several additional miRNAs, listed in Tables S7 and S9, which target many transporters, signaling genes and transcription factors. Taken together, we have identified some novel and known miRNAs in tef that target genes with important biological functions including phosphate acquisition. This study will open up new avenues for further investigation of miRNAs and their targets in tef and related orphan crops such as millets.
In conclusions, we identified 2875 miRNAs in tef plants grown under controlled (optimal calcium conditions) and those grown under low Ca2+ treatment. Among this set, we identified 1380 miRNAs in plants grown under low Ca2+ treatment and 1495 miRNAs in control samples. We identified a total of 161 known and 348 novel miRNAs and assessed their potential target genes and their functions. We found that the predicted target genes appear to have various physiological roles including uptake and transport of macronutrients calcium and phosphate, suggesting roles for miRNAs in tef plant ion homeostasis under prolonged Ca2+ deficiency. We also identified potential target genes of miRNAs that are implicated in essential biological and molecular functions. Our findings provide some clues on the involvement of miRNAs in cellular adjustments to long-term Ca2+ deficiency. However, further study is needed to understand the role of miRNAs in tef mineral nutrition acquisition and homeostasis.
4 MATERIALS AND METHODS
4.1 Plant materials and growth conditions
E. tefaccession (PI-494307), previously selected for high seed Ca2+ content (Ligaba-Osena et al., 2021), was used in this study. A sample of 25 seeds was surface sterilized using 70% ethanol followed by 1% NaOCl solution containing .1% Tween-20 for 20 min. The seeds were then washed with sterile ultrapure or Milli-Q® (18.2 milliohms) water. Sterilized seeds were transferred onto moist filter papers and grown for 6 days. The seedlings were transferred to modified Hoagland solution containing [in mM]; KNO3[1.5], NH4CO3 [.5], NH4H2PO4 [.5], MgSO4.7H2O [.25], and [in mM], KCl [12.5], Fe (III)-EDTA-2Na [.125], H3BO3 [6.25], MnSO4.H2O [.5], ZnSO4.7H2O [.5], CuSO4.5H2O [.125], Na6Mo7O24 [.025]. NH4CO3 is a substitute of Ca (NO3)2·4H2O for the low Ca2+ treatment (10 μM) while for control plants, Ca (NO3)2·4H2O [1 mM] was applied. Four biological replicates were used for each root and shoots of control (control 1 to 4) and low calcium treated (low calcium 1 to 4) plants. The pH of the hydroponic solution was adjusted to 5.8 using 1 N KOH solution. The seedlings in hydroponics were transferred to growth chamber (28°C day and 25°C night temperatures, and 12-h day and night cycles). The nutrient solution was renewed every 4 days and plants were grown for 4 weeks until root and shoot tissues were collected for RNA isolation.
4.2 RNA isolation, RNA library generation, and sequencing
Root and shoot samples were ground into powder under liquid nitrogen using a mortar and pestle. Total RNA was isolated using the GeneJET RNA purification kit following manufacturer's procedure (Fisher Scientific). Small RNA libraries for miRNA-seq were prepared using the NEBNext® Multiplex small RNA library preparation set according to user instructions for the Illumina (E7300 and E7580, NEB). Sequencing was performed using Illumina Hiseq2500 platform using 50-nt read length with single end sequencing protocol (Saus et al., 2018).
4.3 Sequence analysis and identification of novel and conserved miRNAs
The raw reads were filtered for adapters, ambiguous residues, and low-quality reads prior to sRNA analysis using a Perl script Cutadapt v2.10 (Martin, 2011); the parameters were cutadapt -a AGATCGG -q 30 --discard-untrimmed –o. small RNAs of 17–35-nt reads were counted. For novel miRNA prediction, we selected sRNA reads with a minimum raw read count of 10 per library and then combined these into one sRNA library for miRNA prediction (Jin & Wu, 2015). These reads were mapped to the Tef genomic sequence (Pacbio Eragrostis_tef_tef-ft-CDS-gid-50954, https://genomevolution.org/coge/GenomeInfo.pl?gid=50954) using Bowtie 2 software (Langmead & Salzberg, 2012) with two mismatches at maximum. With one end attached 20 nt away from the mapped sRNA site, sequences in the range of 120 to 360 nt each with the extension of 20 nt were collected that covered the region of sRNA. Under similar conditions used by Meyers et al. (2008) and Thakur et al. (2011), at the sRNA location the stem loop structure having three or less gaps with ≤8 bases, and the miRNA-miRNA duplexes mapped to the precursor locus with more than 75% of reads were considered the candidate miRNA precursors. The miRNAs identified with no mismatch to any known miRNA in the miRBase dataset (miRBase, 21.0) were classified as known miRNAs while the remaining miRNAs were classified as novel miRNAs.
4.4 miRNA target identification
For miRNA target prediction, the psRNA Target software (http://plantgrn.noble.org/psRNATarget/) was used with its default parameters and published tef transcriptome (VanBuren et al., 2020). During the result filtration, only those with expectation scores from 0 to 3.5 were included. Genes targeted by differently regulated miRNAs were determined using psRNATarget (a plant-based miRNA target analysis server) (Dai & Zhao, 2011). The psRNATarget site was determined using default parameters to scan the tef transcriptome assembled by VanBuren et al. (2020) for differentially regulated miRNAs in tef. These targets were then utilized in PageMan (Usadel et al., 2006) to uncover functional ontologies that were over- and under-represented. Visualization was done using MapMan (Thimm et al., 2004). The SeqTar method (Zheng et al., 2012) was used to predict miRNA targets. Targets with less than or equal to four mismatches were considered for further investigation in the case of conserved miRNAs. Only targets with at least one valid read and fewer than four mismatches were used for novel miRNAs.
4.5 miRNA target annotation and GO analysis
miRNA target genes were predicted using the online database psRNA Target Server (http://biocomp5.noble.org/psRNATarget/) (Dai & Zhao, 2011) by using the default parameters. Function annotations and analysis were further performed by the AgriGO (agriGO: GO Analysis Toolkit and Database for Agricultural Community (cau.edu.cn)). After target predictions, all the targets of novel and conserved miRNAs were processed via the SEA tool of agriGO (an online toolkit version 1.2 for the GO analysis) (Tian et al., 2017). The AgriGO toolkit was used to assess the enriched GO terms in our dataset in relation to total annotated genes using Fisher's exact test at a significant P value of .05. The result of the software defines three GO categorization categories: biological processes, cellular components and molecular functions.
4.6 Analysis of miRNA expression patterns
Differential accumulation of miRNA was determined using the DeSeq2 package using the shrinkage estimation of fold change and dispersion for improving estimation interpretability as well as stability (Love et al., 2014). R statistical software packages ggplot2 (Wickham, 2011) and gplots (Warnes et al., 2009) were used for all the plot presentations.
ACKNOWLEDGMENTS
We are grateful to Patricia Baldrich and Blake Meyers at the Donald Danforth Plant Science Center for assistance and feedback on the analyses. We are also grateful to Joanna Friesner of the Danforth Center for her work in editing an earlier draft of the manuscript. This study was supported by start-up funding from The University of North Carolina at Greensboro (# 133504 to AL-O).
CONFLICT OF INTEREST
The authors declare no known competing financial interests.
AUTHOR CONTRIBUTIONS
AL-O and RB conceived the project. AL-O, XW, SCC, and RB designed the experiments. SC-C, XW, and AL-O conducted experiments. WG, WJ, BD, and MN analyzed data. MN, WG, and AL-O wrote the manuscript. All authors have reviewed the manuscript before submission.
Open Research
DATA AVAILABILITY STATEMENT
The dataset reported in this study are available from the corresponding author upon request.
Supplementary table files and largescale datasets have been stored at https://www.ncbi.nlm.nih.gov/geo/Accession #GSE193130.


