Influence of crystal orientation on stretching induced void formation in poly(4-methyl-1-pentene) investigated by in-situ small-angle and wide-angle X-ray scattering
Funding information: China Postdoctoral Science Foundation, Grant/Award Number: 2019M652571; National Natural Science Foundation of China, Grant/Award Number: 52003249; Natural Science Foundation of Henan, Grant/Award Number: 202300410426; State Key Laboratory of Advanced Design and Manufacturing for Vehicle Body, Grant/Award Number: SYFD061910K
Abstract
In this work, the void formation of poly(4-methyl-1-pentene) (P4MP1) during solid-state stretching was investigated by in-situ small-angle and wide-angle X-ray scattering. By controlling the heating temperature, P4MP1 specimens with different orientation degrees were obtained. The results showed that: (1) specimens with high orientation presented hard elastic deformation behavior. Before the voids were induced, a density decrease in the amorphous phase was detected due to the extension of chain network. Once voids were formed, their longitude direction was aligned perpendicular to the stretching direction. With the increase of crystal orientation, the volume fraction of voids was greatly enlarged; (2) specimen with random orientation showed cold drawing deformation. As the Hencky strain was larger than 0.13, the void scattering was strengthened in the vertical direction whereas weakened in the horizontal direction, indicating that the longitude direction of the voids was changed to the stretching direction. With further stretching, the length of the voids was enlarged and the orientation of the voids was enhanced, but the volume fraction of the voids was reduced slightly due to the collapse of small voids. After stretching, the length and width of the void evaluated from SEM were 382 and 81 nm.
1 INTRODUCTION
Poly(4-methyl-1-pentene) (P4MP1) is a semicrystalline polyolefin with high optical transparency (the transmittance is large than 90% in the range of visible light),1 high melting temperature (ca. 232°C),2 as well as high energy density and low dielectric loss.3, 4 Its density is 0.83 g/cm3, and it is the only semicrystalline polymer whose density of the amorphous part is higher than that of the crystalline part.5, 6 Benefiting from its unique physical properties, P4MP1 is widely used in the area of membrane oxygenator,7-9 optical devices,10 radiative cooling,11, 12 dielectric devices and capacitors,13 anion-conductive membranes,14 and so on.
Nowadays, polyolefin separators are extensively used in lithium-ion batteries, electrochemical storage devices, and electric vehicles.15, 16 Polyolefin separators are made mainly by polypropylene (PP), polyethylene (PE), and their combinations. Whereas, due to the low melting point nature of PP (167°C) and PE (132°C), a coating procedure by inorganic nanoparticles is normally needed to improve the thermal stabilities and decrease the thermal shrinkage of the separator.17, 18 The melting point of P4MP1 is 67°C higher than PP and 100°C higher than PE, providing a great opportunity to improve the intrinsic thermal stability of the separator. But, up to now, only a few works can be found concerning the preparation of the P4MP1 separator.
To fabric the P4MP1 separator, several methods have been developed, including solvent-induced phase separation,19 electrospun,20 and melt extrusion/annealing/uniaxial stretching (MEAUS). Since that MEAUS is solvent-free and eco-friendly, it gains more attention than the others. Pioneer reports21-23 found that in MEAUS to achieve an appropriate microporous membrane it is necessary to develop a precursor film containing a planar stacked lamellar texture. In addition, the precursor film can be transformed into the microporous membrane only under appropriate annealing and stretching conditions. During extrusion, a larger molecular weight, higher extrusion speed, and a larger quench height promote the formation of planar stacked lamellar texture and higher main-chain crystalline orientation factor.21 For the P4MP1 precursor film, the optimum annealing temperature and time were 205°C and 20 min, and the best cold and hot stretching temperatures were 70 and 180°C.23 In the later work by Yin et al.,24-26 P4MP1 precursor film with different draw ratios was obtained and the optimum annealing parameters and stretching parameters were discussed. It was found that the crystallinity of the precursor film declines with increasing draw ratios. Meanwhile, the morphology of the film was changed from partially twisted lamellae to parallel oriented lamellae perpendicular to the machine direction.24 During the annealing treatment, the thickness of the crystalline phase is a function of annealing time. The optimum annealing temperature and time were 200°C and 30 min.25 The variation of the optimum annealing condition is of great possibility caused by the different molecular weight and extrusion parameters. In the stretching stage, low temperature and faster stretching speed resulted in more voids and larger void sizes.26
In spite that the influence of processing parameters of MEAUS on the porosity of microporous P4MP1 membrane was discussed, the development of voids in P4MP1 during stretching remains not fully understood, which inhibits the better control of the pore size and size distribution in the membrane. To figure out the initiation and evolution of voids in P4MP1 during stretching, the in-situ ultra-small angle X-ray scattering (USAXS) method was employed to monitor the structural evolution of compression-molded P4MP1 plates.27, 28 Results showed that extensive voids were formed as the stretching temperature was below and above the glass transition temperature. At small strain (Hencky strain <0.1), disk-shaped void with large size (void length >170 nm) appeared around the yield point, and at larger strain (Hencky strain >0.1) abundant voids with small size (void length <50 nm) were triggered. The voids formed at small strain were attributed to the competitive process between the cavity formation and lamellae shearing, and those formed at larger strain were caused by the failure of the highly oriented entangled amorphous network.
In this work, the focus will be emphasized on the role of orientation on the evolution of void during stretching of P4MP1, since that (1) a preferred orientation always exists in the precursor film; and (2) as evidenced in PP or PE, the orientation plays a vital role in determining the void evolution during stretching and the properties of the porous film.29-31 As the specimens with different crystal orientations were obtained, the in-situ small angle X-ray scattering (SAXS) measurements were performed to evaluate the void evolution and to calculate the void size. The morphology of voids after stretching was characterized by scanning electronic microscopy (SEM) and atomic force microscopy (AFM). In addition, the deformation of the crystalline part upon stretching was also investigated by in-situ wide angle X-ray scattering (WAXS).
2 EXPERIMENTAL SECTION
2.1 Materials and sample preparation
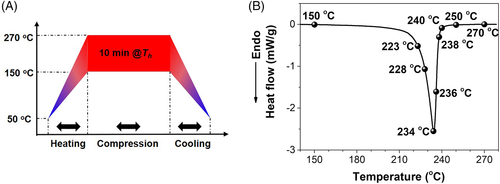
P4MP1 used in this study was purchased from Mitsui Chemicals with a trademark of MX004, the melt flow rate is 25 g/10 min (260°C, 5 kg).32 The as-received P4MP1 pellets were injection molded by Demag 80 (Germany) to get plates with preferred orientation along the machine direction. The barrel temperature was set at 270, 275, 255, and 100°C from the nozzle to the hopper. The mold temperature was 90°C. The injection pressure and holding pressure were 1100 and 600 bar. The injection molding speed was 80 cm3/s. The width, length, and thickness of the specimen were 60, 80, and 0.3 mm. To enlarge the melt flow time and enhance the orientation, a spew groove was added at the end of the cavity. After injection molding, the plates were suffered a heating treatment shown in Figure 1A to adjust the orientation state inside. The heating temperature (Th) in the thermal protocol was selected according to the melting behavior of the injection-molded plate (Figure 1B). The duration of the treatment at Th was 10 min. For simplification, the sample was labeled as P4MP1-Th. P4MP1-ref refers to the sample without any heating treatment after injection molding.
2.2 Differential scanning calorimetry (DSC) measurement
The melting behavior of the sample was characterized by TA instrument Q2000 (USA) under nitrogen atmosphere. Five milligrams sample was heated from room temperature to 280°C with a heating rate of 10°C/min and then cooled to 80°C with a cooling rate of 10°C/min. The heat absorption during heating was recorded.
2.3 Scanning electronic microscopy (SEM) measurement
The morphology of the sample before and after stretching was examined by JEOL JSM-6380 (Japan) operated at an accelerating voltage of 10 kV. Before the observation, the sample was etched by a mixture of KMnO4-H2SO4-HNO3 and then sputter-coated with a layer of gold.
2.4 Atomic force microscopy (AFM) measurement
The morphology of the sample was also observed by Bruker MultiMode 8 (Germany) by tapping mode. Before the measurement, the sample was cut by Cryo-ultra-microtome (Leica EM FC7) at −80°C.
2.5 Uniaxial stretching and in-situ synchrotron X-ray scattering experiments
 ()
() and
and  are the initial and instant widths of samples during stretching which were obtained by gauging optical photo images.
In-situ two-dimensional (2D)-SAXS and 2D-WAXS measurements were performed on Bruker Nanostar (Germany) with Vantec 2000 area detector and Bruker D8 ADVANCE (Germany) with Vantec 500 area detector, respectively. The resolution of the detectors is 2048 × 2048 pixels, and the pixel size is 68 × 68 μm2. The sample to detector distance was 1087.5 and 148.8 mm, respectively. The wavelength of the X-ray was 0.154 nm and the energy of the X-ray is ca. 8 keV. To make sure that the scattering patterns have enough resolution, the collection time was set at 30 s. The diameter of the X-ray beam is 0.5 mm. The SAXS and WAXS patterns were further processed by self-written Python scripts.
3 RESULTS AND DISCUSSION
3.1 The microstructure and morphology of P4MP1 suffered different heating treatment
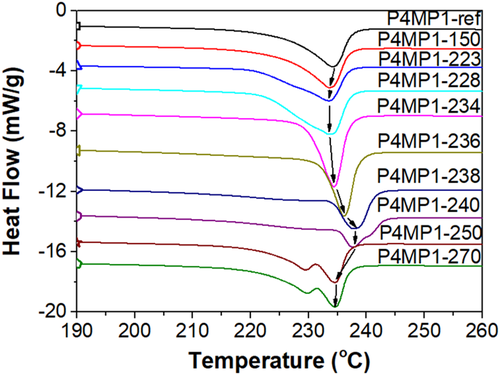
Figure 2 presents the melting behavior of the sample treated at different Th. On the curve of P4MP1-ref, the melting peak was located at 234.2°C. Treating at 150°C influenced slightly the melting behavior. As Th was elevated to 223 and 228°C, a broad shoulder peak appeared at 228°C due to the melting of the imperfect crystals formed during the heat treatment.25 When Th was in the range of 234–238°C, the shoulder peak disappeared and the main peak shifted obviously to a higher temperature as a result of crystal perfection. When Th was higher than 240°C, the temperature of the main peak started to decrease and finally stayed at 234°C. In addition, a small shoulder peak can be recognized as Th was higher than 250°C. The appearance of this shoulder peak should be ascribed to the melting of metastable crystals formed during the cooling process in the heating treatment.
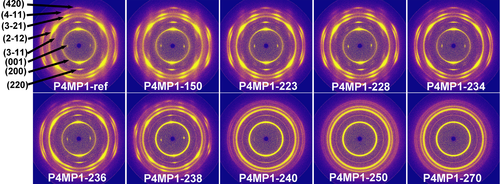
To check the orientation of the sample before stretching, 2D-WAXS patterns are provided in Figure 3. On the pattern one can see a series of diffractions from inner to outer region, which are originated from different crystal planes. It is well known that P4MP1 is a polymer with polymorphic behavior: Form I owns a tetragonal unit cell (a = 18.88 and c = 13.8 Å),35, 36 Form II exhibits a monoclinic unit (a = 18.50, b = 10.43, c = 7.22 Å and γ = 113°),37 Form III presents a tetragonal cell (a = 19.16 and c = 7.12 Å),38 and Form IV shows a hexagonal structure (a = 22.17 and c = 6.69 Å).38 Among all crystal forms, Form I is the most stable one and is also the only one that can be crystallized directly from the melt. In Form I, the chains are characterized by 72 helical conformations. As verified by the results in Figure 2, no characteristic peak of Form II (133°C) or Form III (74°C)39 can be found, so it is inferred that only Form I exists in the sample. These diffractions were assigned to (001), (200), (220), (3  1), (2
  2), (3
  1), (4
  1), and (420) crystal planes of Form I considering their two-theta value. For the sample without any treatment, the intensity distribution of the diffraction indicates an anisotropic structure in the sample.40 As Th was higher than 236°C, the intensity distribution of the diffraction was changed obviously from a combination of arc and circle to full circle with increasing Th, indicating a transition of orientation from oriented to randomly distributed one.
 ()
() represents the mean-square cosine (average overall crystallites) of the angle between the c-axis and the Z direction. fH = 1 means that the c-axis is perfectly oriented along the flow direction, fH = −0.5 suggests the c-axis is perpendicular to the flow direction, and fH = 0 means a random orientation. Since that the intensity of (001) crystal plane is quite weak and disappeared as Th is higher than 240°C, so
  is given by
 ()
() ()
() is the intensity distribution of (200) crystal plane as a function of the azimuthal angle (
  ). fH is summarized in Figure 4B. In addition, the crystallinity of the sample calculated from the 1D-WAXS curve through a standard peak fitting procedure is provided in Figure 4C. 1D-WAXS curves were obtained by circular integration of the 2D-WAXS patterns. The peak fitting procedure is shown in Figure S1.
It can be found that fH was 0.49 and the crystallinity was 0.38 in P4MP1-ref, and they were enlarged to 0.52 and 0.40, respectively, when Th was 150°C. As shown in Figure 2, no additional melting peak arose, so the increase of fH and the crystallinity was probably caused by the lamellae perfection and molecular chains rearrangement in the amorphous phase.25, 41, 42 As Th was higher than 223°C and lower than 234°C, part of the previously existed crystals was melted. The residual part served as nuclei to induce the formation of the oriented crystal during the cooling process in the heat treatment, as a result of the “memory effect”.43, 44 So fH was further increased to 0.58. Meanwhile, the crystallinity was enlarged drastically to 0.47. “Memory effect” refers to the phenomenon that the polymer melt containing clusters of molecular segments with a more ordered conformation than the equilibrated random coil will crystallize faster due to a depression in free energy change for nucleation.43, 44 When the semicrystalline polymer is heated to a temperature close to its nominal melting temperature or well below the equilibrium melting point, the “memory effect” will be triggered.45, 46 As Th was higher than 236°C, fH began to decrease and reached 0 when Th was 250°C due to that the majority part of the previously existed crystals was destroyed and lost the orientation nature, although the residual part can still serve as nuclei to increase the crystallinity of the sample (see Figure 4C). Lastly, as Th was higher than 250°C, the crystallinity of the sample was decreased to 0.41, which was only slightly larger than P4MP1-ref and P4MP1-150.
Normally, due to the existence of the shear rate and the temperature gradient, a “skin-core” structure will be formed in the injection-molded sample47, 48: in the skin region a frozen layer and a highly oriented layer can be recognized, and in the core region a homogenous region with spherulite can be observed. The morphology of P4MP1-ref and P4MP1-270 are shown in Figure 5. The horizontal dark line in Figure 5A is the amorphous phase which was removed during etching. Interestingly, no “skin-core” structure can be found in P4MP1-ref, which is greatly different from the morphology of normal injection molded semi-crystalline polymer. The suppression of the “skin-core” structure herein is of great possibility caused by the high shear rate, high mold temperature, and fast crystallization rate of P4MP1. As the melt was injection molded into the cavity, since that the thickness of the cavity is very small, so dense nuclei were induced by the shear flow at the edge of the cavity. Then the lamellae grew towards the center in a very fast way and occupied the full cavity. Therefore, the formation of the core region was suppressed. As P4MP1-ref was treated at 270°C, the previously formed oriented lamellae melt totally as proved by the DSC and WAXS results. So, spherulite was formed during the cooling process.

3.2 The stretching induced void formation
Figure 6 shows the selected optical images and the stress–strain curves of P4MP1 stretched at 30°C. The mechanical behaviors can be divided into three groups, which are hard-elastic deformation where no obvious necking can be found (Th ≤ 236°C), ductile deformation where the sample is broken after necking (Th = 238 and 240°C), and cold drawing (Th = 250 and 270°C) where a stable neck is developed. The results in Figure 6 prove that the deformation behavior of P4MP1 correlates intimately with its microstructure and morphology. The hard-elastic deformation belongs to the sample with high orientation when the stretching direction is parallel with the c-axis of the crystal.31, 49 And the separation of lamellae by the molecular network extension within the amorphous phase contributed mainly to the hard-elastic deformation.50 For those samples which exhibited hard-elastic behavior, no load drop can be found after the linear deformation region. Due to lamellae perfection and molecular rearrangement in the amorphous phase, the stress at the same Hencky strain was enlarged obviously and the Hencky strain at failure was decreased.42, 51 The sample with moderate orientation was broken shortly after necking. In these samples, both lamellae separation and lamellae/chain slip existed during necking.52, 53 In addition, these samples were fractured earlier than the fully homogeneous sample.
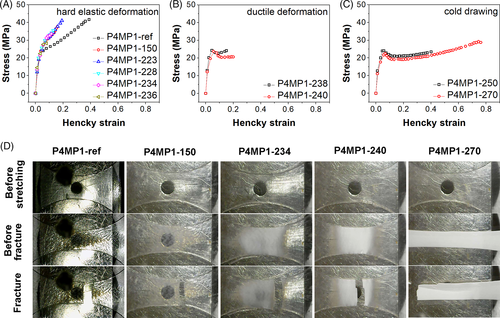
The optical images showed that the stress-whitening behavior of the sample was altered greatly as Th was changed, implying a variation of the cavitation behavior. With increasing Th, the transparency of the sample was gradually weakened at fracture, indicating an intensification of void formation.28 Moreover, for the specimen with hard elastic deformation, a straight fracture line can be observed on the optical image. For the specimen with ductile deformation and cold-drawing, the fracture line is less straight. In addition, a large elongation can be found for the specimen with cold drawing deformation.
SAXS is powerful in detecting the structure with tens to hundreds of nanometers. Representative 2D-SAXS patterns during stretching are provided in Figure 7. Since that the density contrast between the crystalline phase and the amorphous phase is extraordinarily small in P4MP1,54 no lamellae scattering can be found before stretching, although the lamellar structure has been observed in Figure 5. Whereas upon stretching the lamellae scattering (indicated by the green arrows in Figure 7) showed up at the Hencky strain of ca. 0.05, presenting solid evidence that in hard-elastic P4MP1 uniaxial stretching will lead to a decrease of the density in the amorphous phase. The decrease of the density in the amorphous phase is of great possibility caused by the expansion of the molecular NETWORK CONFINED WITHIN ADJACENT LAMELLAE.
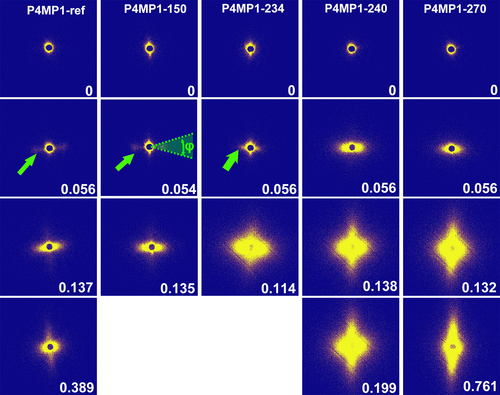
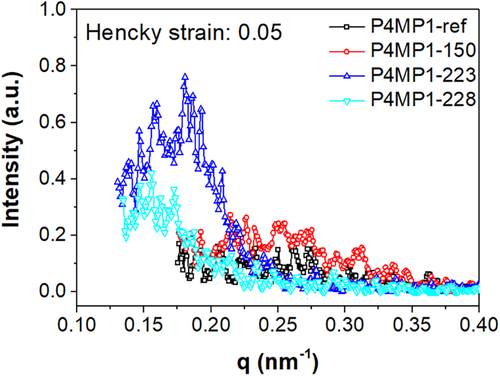
To evaluate the long period (Lp), a cut was made on the 2D-SAXS pattern in the direction of the lamellar scattering, and the 1D-SAXS curve obtained from the cut as shown in Figure 8. The cut was made along the direction of lamellae scattering and the angle range of the cut (φ) is 30° as shown in Figure 7. Then Lp is calculated by  ,
,  is the peak position on the 1D-SAXS curve. Lp at the Hencky strain of ca. 0.05 was increased from 23.8 nm (without heating treatment) to 39.9 nm (Th = 228°C). As Th was higher than 234°C, no lamellae scattering can be recognized from the pattern, which can be understood from the following aspects: (1) the lamellae scattering was redistributed in the whole azimuthal range due to orientation reduction, so the intensity in the equator direction was decreased; (2) Lp was so large that the maximum scattering moved to a position which was overlapped with the beam-stop.
In the 2D-SAXS pattern of P4MP1-ref, as the Hencky strain reached 0.137 a strong streak scattering showed up after the appearance of the lamellae scattering, as a result of void formation. The streak is along the horizontal direction, suggesting that the longitude axis of the void is perpendicular to the stretching direction. At a larger Hencky strain, the scattering in the horizontal direction is weakened, but a weak scattering rises in the vertical direction. This suggests that a new group of voids with their longitude direction parallel with the stretching direction were formed. The appearance of the new group of voids can be caused by the direction transition of initially formed voids,55, 56 or the formation of new voids directly. Different from P4MP1-ref, the sample with Th of 150°C was broken at a Hencky strain of 0.135, so no voids direction transverse was observed. As Th was increased to 234°C, the voids scattering became much stronger implying that more voids were formed. In the sample with Th of 240 and 270°C, the horizontal void scattering can be found at a smaller Hencky strain, and the scattering intensity was quite strong. In addition, due to the occurrence of yielding and cold drawing, in the sample with Th of 270°C the void scattering was transformed to a strong vertical scattering at the final stage of stretching.
 ) of voids and the electron density contrast between voids and the matrix by
 ()
() and
and  are the volume fraction of the matrix and voids,
  and
and  are the electron density of the matrix and voids. Equation (5) can be rewritten as
 ()
() ()
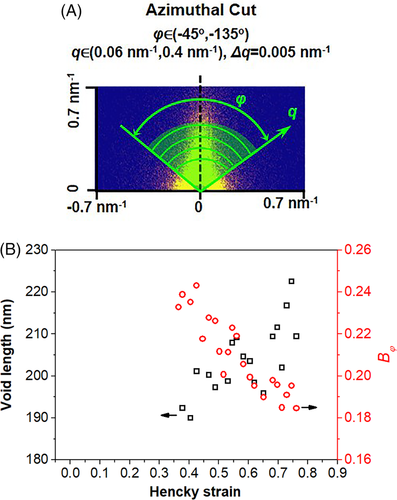
()
 ()
() is the misorientation of the void. The results in Figure 10B show that in the sample with Th of 270°C, Lvoid increased gradually from 190 to 220 nm as the Hencky strain was increased from 0.4 to 0.8. Meanwhile, the misorientation of the void is decreased suggesting an enhanced orientation of the void.
As well known, the SAXS measurements provide information of the entity in the reciprocal space. To check the morphology of voids in real space SEM and AFM were performed on P4MP1-270 after stretching (Figure 11). The stretching direction is horizontal. It can be found that voids are distributed homogeneously in the whole scope of the image. In the AFM image given in Figure 11B, more details about the voids can be observed. Generally, two types of voids can be distinguished: which are voids containing fibrils (type I) inside and voids containing nothing (type II). The voids containing fibrils is formed by the coalescence of small voids, and the fibrils in the voids are caused by the stretching of the boundary between these voids. The voids containing nothing is a result of the growth of nascent small voids.
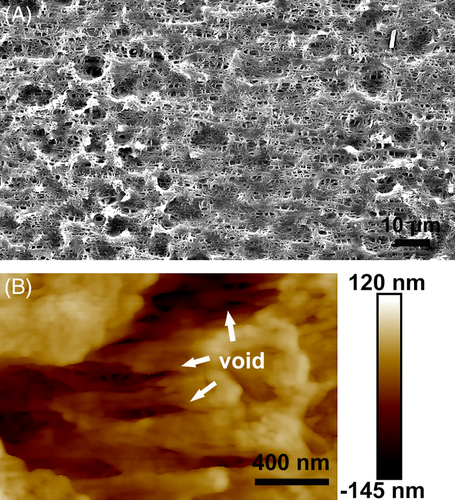
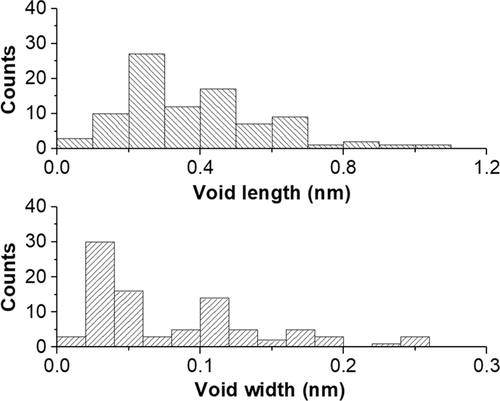
The size of the voids in real space is analyzed statistically and the results are given in Figure 12. The statistical values of the voids length and voids width are 382 and 81 nm, respectively. The size of the voids presented here is larger than that calculated from SAXS results. The discrepancy between them may be caused by the different detecting resolutions and detecting areas of these two methods. During SAXS measurement, the beam size was set at 500 × 500 μm2 which covers a region much larger than the scope of SEM. Additionally, the etching procedure used in SEM may also contribute to the enlargement of the void size.
3.3 The deformation of the crystalline phase
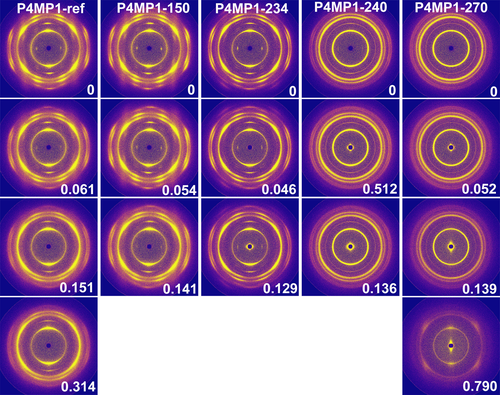
Representative 2D-WAXS patterns during stretching are provided in Figure 13. The diffractions on the pattern are assigned to (001), (200), (220), (3  1), (2
  2), (3
  1), (4
  1), and (420) crystal planes of Form I from inner to outer region. In P4MP1-ref, before stretching (001) diffraction is focused on the equator due to crystal orientation. Upon stretching, (001) diffraction disappeared at the Hencky strain of 0.15 as a result of the orientation reduction. The orientation reduction can be also found from the evolution of the azimuthal intensity distribution of (200) diffraction. The broader (200) diffraction at the final stage of stretching indicating that the orientation was reduced after stretching. Similar to that of P4MP1-ref, the orientation of P4MP1-150 and P4MP1-234 also exhibits a decreasing trend upon stretching. However, in P4MP1-240 the orientation was varied very slightly. In P4MP1-270, the crystal orientation was enhanced by stretching where the (200) diffraction was changed from a circle to an arc.
The quantitative analysis of the c-axis orientation during stretching is summarized in Figure 14A. To be more specific, in P4MP1-ref fH decreased slightly from 0.49 to 0.44, as a result of lamellae fragmentation and melting. For the sample with Th higher than 150°C and lower than 236°C, the evolution trend of fH is similar with that of P4MP1-ref. In P4MP1-238 fH was decreased from 0.25 to 0.21. Whereas in P4MP1-270, fH grew gradually from 0 to 0.32 after stretching. The increase of fH in P4MP1-270 was caused by the combination effect of lamellae rotation and stretching induced crystallization.58
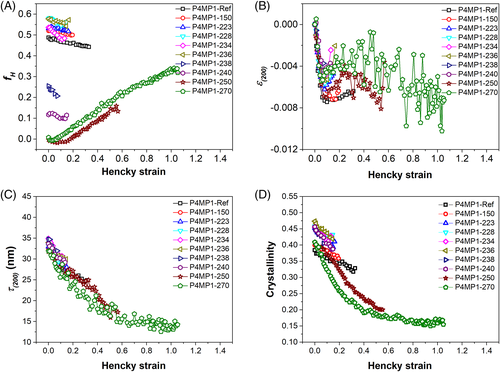
 , and (D) the crystallinity of P4MP1 as a function of the Hencky strain
 ()
() ()
() is the initial d-spacing of (200) crystal plane,
  is the d-spacing during stretching,
  is the wavelength, and
  is the Braggs angle of (200) on the 1D-WAXS curve. The results presented in Figure 14B showed that (200) crystal plane suffered compression stress upon stretching due to the contraction that occurred in the transverse direction of the c-axis. Then, the compression was saturated very fast at the Hencky strain of 0.06, suggesting that the affine deformation happened only in a very small Hencky strain range. As the Hencky strain exceeded 0.06, the macroscopic stretching of the sample was completed mainly by the extension of the molecular network in the amorphous phase, the crystal slip, lamellae slip, and melting-recrystallization. In P4MP1-250 and P4MP1-270, the fibrillation process that occurred during cold-drawing gave rise to the increase of fH.
 ) along the normal direction of (200) crystal plane was evaluated by Scherrer equation
 ()
() is the half-width of (200) diffraction on the 1D-WAXS curve. As one can see in Figure 14C, although the orientation was greatly changed by the heating treatment, the evolution of
  was influenced negligibly.
  in all specimens was reduced upon stretching. In P4MP1-270,
  was reduced gradually from 32 to 15 nm when the Hencky strain reached 0.6 as a result of chain slip and lamellae fragmentation. Afterward,
  was kept constantly at 15 nm until fracture. The crystallinity is related to the fraction of the crystalline phase. Therefore, the evolution of the crystallinity in Figure 14D provides a broad view of the deformation of the crystalline phase. In general, the crystallinity was reduced as the Hencky strain was increased. In P4MP1-ref, the crystallinity was decreased from 0.38 to 0.32 in the whole stretching process. The variation of the crystallinity is much larger than the detection resolution of WAXS (0.005–0.01),59 suggesting that the stretching led to a fragmentation and melting of lamellae. In the sample showing hard elastic behavior, the evolution trend was similar with that of P4MP1-ref although the crystallinity was larger. In the sample exhibiting ductile deformation and cold drawing, the crystallinity was decreased much faster. For instance, at the Hencky strain of 0.31 the crystallinity was decreased to 0.33 in P4MP1-ref and 0.22 in P4MP1-270, respectively.
3.4 Final discussion
A summary is made here necessary before the final discussion. By injection molding, P4MP1 plates with oriented morphology were obtained. In addition, the traditional “skin-core” structure was suppressed in the injection-molded plates. Subsequently, the microstructure and morphology of the plates were adjusted by the designed heating treatment. The mechanical behavior of the final plates was categorized into three groups which are hard elastic deformation, ductile deformation, and cold drawing deformation. The discussion below will be focused on the hard elastic deformation and cold drawing, since that the ductile deformation is more like a combination of them.
For the specimens exhibiting hard elastic deformation, the volume fraction of the void was increased as Th was elevated. Before the initiation of the void, a density decrease in the amorphous phase was observed. In addition, the longitude direction of voids was perpendicular to the stretching direction when voids were initiated. Before the specimen was fractured, only a few voids transferred its longitude direction to the stretching direction.
For the specimens showing cold drawing deformation, the volume fraction of the void was in the same order as that of the highest one of the specimens showing hard elastic deformation. Once the voids were formed their longitude direction was perpendicular to the stretching direction. After yielding, a new group of voids appeared with their longitude direction aligned in the stretching direction. Upon further stretching, the length of the voids was increased and the orientation of the voids was enhanced along the stretching direction. The average length and width of the voids obtained from the SEM image were 382 and 81 nm.
3.4.1 The enhanced void formation in hard elastic P4MP1 after heating treatment
The void formation in semicrystalline polymer upon stretching was reported widely in PP,29, 33, 60 PE,61 poly(1-butene),56 P4MP1,28 polyamide 6,62 and so on. The void formation will be influenced by either the sample intrinsic characters like crystallinity, crystal form, lamellae orientation and morphology, and mobility of polymer chains in the amorphous phase, or the stretching temperature and stretching speed. In either case, the void is induced in the region where negative hydrostatic stress exists.63 For the samples where crystals inside show higher plastic resistant ability,64 the stretching force will be transferred more efficiently to the amorphous phase. As a result, the enhanced void formation would be induced.
In hard elastic P4MP1, the lamellae are aligned with their normal parallel with the stretching direction (Figure 5). Upon stretching, the applied force will be transferred to the crystalline phase and the amorphous phase simultaneously, leading to an affine deformation of the microstructure. Whereas, the affine deformation was terminated very fast as the linear deformation is finished (Figures 6A and 14B). Afterward, the stretching of the specimen is realized mainly by the drastic extension of the chain network in the amorphous phase, so the density contrast between the crystalline phase and amorphous phase was enlarged, giving rise to the appearance of lamellae scattering on the SAXS pattern (Figure 7). The stretching induced density variation can be also found in hard elastic PP and PE.65, 66 Subsequently, voids are induced in the amorphous phase when the negative stress reaches the critical value, and the initial voids are expanding very fast in the transverse direction where the constraining force is much smaller. In the meantime, the stretching of tie chains connecting neighboring lamellae would promote the occurrence of chain slip.67 The initial lamellae are deformed into crystal blocks, leading to the decreased crystal orientation and reduced crystal size (Figure 14A,C). After heating treatment, the crystallinity of the sample is elevated, and the crystal orientation is enhanced (Figure 4). The imperfect lamellae are disappeared and the lamellae thickness distribution is reduced, as evidenced by the increased melting temperature and much narrower peak width (Figure 2). Therefore, the applied force is transferred more efficiently to the amorphous phase. In addition, the disappeared imperfect lamellae and enlarged long period benefit greatly the mobility of polymer chains in the amorphous phase. So, the void fraction is greatly improved. Whereas, due to the weak constraint force in the transverse direction, the fast propagation of voids in the transverse direction results in a much smaller fracture strain.
3.4.2 The void formation in randomly oriented P4MP1
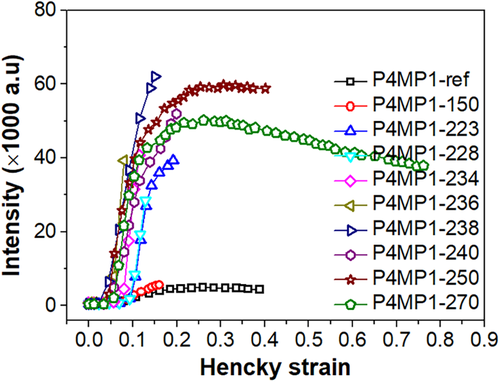
In the sample with random orientation, voids were formed at a critical Hencky strain of 0.06, which is the same as that of the specimen with the highest orientation. Once voids are formed in the random oriented P4MP1, its longitude direction is perpendicular to the stretching direction, suggesting that voids are preferred to grow in the region where the normal of lamellae is parallel to the stretching direction. But, different from oriented P4MP1, a load drop was observed on the mechanical curve of the random oriented P4MP1. The load drop is related to the intense plastic deformation of the crystalline phase including crystal slip, lamellae fragmentation, and melting-recrystallization, as proved by the decreased crystal size and the crystallinity in Figure 14. After yielding, the streak scattering on the SAXS pattern is strengthened gradually in the vertical direction. Meanwhile, the scattering is weakened in the horizontal direction (Figure S3), indicating that the orientation direction of the voids was altered. The orientation transition can be also found in other reports28, 56 by SAXS measurement. Moreover, the void orientation transition was observed in real space by the synchrotron radiation nanotomography in the work by Ovalle et al.55 The Hencky strain where the scattering intensity in the horizontal direction starts to decrease is marked as the critical strain of void orientation transition, which is 0.13 in P4MP1-270. As the Hencky strain is larger than 0.13, the increasing speed of the volume fraction of the void is slowed down. And the volume fraction of voids reaches a maximum at the Hencky strain of 0.21 (Figure 9). The decrease of the volume fraction is probably caused by the coalescence of the void.68 By coalescence, the boundary of the adjacent voids is changed to fibrils shown in Figure 11.
The results in this work proves that the orientation degree of the specimen influences greatly the void formation behavior of P4MP1 during solid-state stretching. Although the volume fraction of voids is nearly the same in highly oriented specimen and randomly oriented specimen, the elongation at break is much shorter for the highly oriented specimen, suggesting that randomly oriented film maybe better for the fabrication of porous membrane. Whereas, generally a two-step stretching procedure is used when preparing polyolefin porous membrane: the first step (cold stretching) is used to induce the voids, and the second step (hot stretching) is used to expand the size of voids. Consequently, in the future more work needs to be done in the aspect of void expanding during hot stretching.
4 CONCLUSION
In this work, P4MP1 specimens with various orientation degrees were prepared by injection molding and subsequent heating treatment. As the heating temperature was lower than the peak melting temperature (236°C) of the raw injection-molded specimen. The crystal orientation and crystallinity of the specimen were continuously enhanced as a result of imperfect lamellae melting and lamellae perfection; as the heating temperature was higher than 236°C and lower than the maximum melting temperature (240°C), the crystal orientation and crystallinity began to decrease since that majority part of the previous crystal was destroyed in the heat treatment; as the heating temperature was higher than 240°C, the initially oriented specimen was changed to random oriented one. Depending on the microstructure of the specimen, three types of deformation were found which were hard elastic deformation, ductile deformation, and cold drawing deformation. For the specimens exhibiting hard elastic deformation, a density decrease of the amorphous phase was observed before the void initiation as a result of the extension of the chain network. When the negative stress in the amorphous phase reached the critical value, voids were triggered with their longitude direction aligned perpendicular to the stretching direction. After the heating treatment, lamellae perfection led to an enhanced shear modulus of the lamellae, so the stress can be transferred to the amorphous phase in a better way. In addition, the melting of the imperfect lamellae gave rise to the enhanced mobility of the molecular chains in the amorphous phase. So the volume fraction of the voids was greatly enlarged. For the specimen showing cold drawing, the crystal was randomly oriented before stretching. The volume fraction of the voids in the randomly oriented specimen was in the same order as that of the oriented specimen. As the Hencky strain was larger than 0.13, the void scattering was strengthened in the vertical direction whereas weakened in the horizontal direction, indicating that the longitude direction of the voids was changed to the stretching direction. With further stretching, the length of the voids was enlarged and the orientation of the voids was enhanced, but the volume fraction of the voids was reduced slightly due to the coalescence of voids. After stretching, the length and width of the void evaluated from SEM were 382 and 81 nm.
ACKNOWLEDGMENTS
The authors are grateful to DESY for beamtime within the project II-20150042. Baobao Chang gratefully acknowledges the financial support for this work by the National Natural Science Foundation of China (Grant No. 52003249), the China Postdoctoral Science Foundation (Grant No. 2019M652571), the Natural Science Foundation of Henan (Grant No. 202300410426), the Open Funding Project of National Key Laboratory of Human Factors Engineering (Grant No. SYFD061910K).
CONFLICT OF INTEREST
The authors declare that they have no known competing financial interests or personal relationships that could have appeared to influence the work reported in this paper.


