Crystalline morphologies at the surface of PET/PEN random copolymer films
Abstract
A series of PET (poly(ethylene terephthalate))/PEN (poly(ethylene 2,6-naphthalate)) copolyesters were synthesized by molten transesterification, and the surface crystallization behavior of their thin films investigated by atomic force microscope with an in situ heating stage. Force-distance measurements detected a surface glass transition (T gS) of the copolymers several tens of degrees below their bulk glass transition (T gB) obtained by differential scanning calorimeter. The surface crystalline morphologies as a function of annealing temperature and film thickness were summarized as surface morphology diagrams. The surface crystallization temperature (T cS) was found to be several degrees lower than the bulk crystallization (T cB), and the films thinner than ~100 nm showed significant increase in T cB. The lamellar crystalline morphology of copolymers with high randomness and short sequence length deviated from that of the homopolymers, reflecting the composition and degree of randomness. Highly random PET/PEN = 75/25 wt% copolymers exhibited unique lamellar curvature with arbitrary growth directions. Sharp boundaries between the crystals and amorphous suggested an absence of large amounts of rejected material at the growth front. In the case of copolymers with high randomness and short sequence length, no bulk crystallization morphology was observed even at 190°C, with the relatively thick surface crystalline layer totally covering the emergence of any bulk crystals.
1 INTRODUCTION
Crystallization in random copolymers will be influenced by the ability of random sequences of monomers to form ordered crystal structures. Thus, we would expect that the amount of crystallization, the crystallization temperature, and the crystal morphology will all be affected by the nature of the different comonomers, the relative proportions of the monomers, and the sequence (in particular the degree of “blockiness”/randomness) of the monomers. Many studies have been made of crystallization of polymers in thin films and at the surface of films, and copolymerization would be expected to have an influence on this behavior. In observing the behavior of copolymer crystallization, we should draw upon the understanding of how random sequences of monomers may form regions of ordered crystalline material. Flory1 suggested that crystallization in a random copolymer system may take place based on matching of homopolymer sequences of the crystallizable component while the non-crystallizable component is rejected into the interlamellar amorphous regions. Later, kinetic constraints were introduced into Flory's model,2 in which only the nearest neighboring molecules are capable of adding to the crystal, and different units could be treated as defects in the crystal.
It has been experimentally demonstrated that there are some copolymers in which only one component is crystallizable and the other component is rejected from the crystal. For example, in the case of the random copolymer systems such as poly(butylene terephthalate) (PBT)/poly(tetramethylene ether glycol),3 poly(butylene succinate) (PBS)/PBT,4 ethylene-octene olefin copolymers,5 and PET/poly(ethylene oxide),6 the crystallization of two components occurs competitively resulting in mesophase separation, with the minor component rejected from the crystalline phase.
In contrast to this “rejection of the non-crystallizing component” model, if the two crystallizable polymers have similar molecular structure, co-crystallization of the two components may take place. Random copolyesters of PET/PEN,7, 8 PET/poly(ethylene isophthalate) (PEI),9 poly(trimethylene terephthalate) (PTT)/PEN,10 and PEN/poly(pentylene terephthalate) (PPT)11 are known to show co-crystallization behavior, in which both monomers are included in the crystals. Windle et al12-16 conducted diffraction studies of PET/PEN random copolymers, reporting that co-crystallization of terephthalate and naphthalate units is possible by lateral matching of similar monomer sequences. According to this idea, even the mixtures that contain different monomer units and lack periodicity in the chain direction are able to crystallize by sequence matching with neighboring chains. It was found that a set of unit cell parameters of the random copolymer crystals changes gradually from one homopolymer to the other as a function of the PET/PEN composition.14 Gutierrez et al17 also proposed a similar idea based on the X-ray diffraction (XRD) results of copolyesters prepared from 4-hydroxybenzoic acid and 2-hydroxy-6-naphthoic acid.
In this study, we consider three aspects of the crystallization behavior. First, we present the surface glass transition temperature, T gS, of a series of PET/PEN random copolymer films, which implies enhanced mobility at the surface and consider the thickness of the surface layer and surface crystals18, 19 depending on the degree of randomness. Second, we map the surface morphology diagrams of the copolymer films as functions of film thickness and crystallization temperature, which indicate both characteristic surface crystallization behavior and influences by degree of transesterification. Third, as the surface crystallization gives rise to very clear morphologies that can be examined by atomic force microscope (AFM), we utilize this opportunity to examine lamellar morphologies of the copolymer crystals which depend on the film thickness, and the composition and regularity of the copolymers, aiming to provide a better understanding of the crystallization of heterogeneous monomer units.
2 EXPERIMENTAL
2.1 Copolymer synthesis
This study is presented as a continuation of our previous work in which the synthesis and molecular characterization of a series of PET/PEN copolymers is reported in detail.20 PET (Sigma-Aldrich) and PEN (kindly provided from Teijin Chemical Co., Ltd) at various ratios were co-dissolved in a mixed solvent of 70 wt% 2-chlorophenol (Fisher Scientific) and 30 wt% 1,1,1,3,3,3-hexafluoro-2-propanol (Sigma-Aldrich). Solutions were filtrated with 0.2 μm pore-sized poly(tetrafluoroethylene) (PTFE) syringe filters (Gelman), and coprecipitated by pouring the solution into acetone.21 The precipitation was thoroughly washed with acetone by Soxhlet extractor for 48 hours, and dried in a vacuum oven at 120°C for 24 hours. From these mixed precipitates, a series of PET/PEN copolymers (Table 1) were synthesized by transesterification reaction for study in this work. Different mixing ratio and reaction periods were used to form the various copolymers of different composition and randomness. The transesterification reaction was carried out in the molten state in a differential scanning calorimeter (DSC; Perkin Elmer DSC-7)21 at 300°C for 5, 20, and 60 minutes in an argon gas atmosphere. During transesterification, series of segments swap between one chain and another, and thus, as the reaction proceeds, the “runs” of one monomer type that have not been transesterified with another chain decreases. Hence, a longer reaction time leads to shorter sequence lengths of the same monomer, that is, a more random chain.
| Composition | Reaction time | Molecular weight | Sequence length | Degree of randomness | ||
|---|---|---|---|---|---|---|
| PET/PEN | Minute | kDa | L T | L N | B | |
| PET | 100/0 | 0 | 25.9 | Hompolymer | 0.00 | |
| Copoly 6 | 90/10 | 5 | 13.4 | 400 | 23 | 0.05 |
| Copoly 4 | 90/10 | 60 | 13.0 | 12 | 1.2 | 0.95 |
| Copoly 10 | 75/25 | 60 | 12.3 | 5.1 | 1.2 | 1.00 |
| Copoly 3 | 50/50 | 5 | 12.8 | 29 | 25 | 0.08 |
| Copoly 1 | 50/50 | 60 | 14.9 | 2.1 | 1.7 | 1.06 |
| Copoly 13 | 25/75 | 60 | 16.4 | 1.5 | 4.4 | 0.91 |
| Copoly 7 | 10/90 | 60 | 12.2 | 1.1 | 20 | 0.97 |
| Copoly 9 | 10/90 | 5 | 12.9 | 21 | 280 | 0.05 |
| PEN | 0/100 | 0 | 14.5 | Homopolymer | 0.00 | |
- Note: Reaction temperature: 300°C.
- Abbreviations: PEN, poly(ethylene 2,6-naphthalate); PET, poly(ethylene terephthalate).
The viscosity average molecular weights of the product copolymers were determined by Ubbelohde viscometry with application of the Mark-Houwink-Sakurada equation.22
2.2 Differential scanning calorimeter
The bulk thermal behavior of PET, PEN, and their copolymers (as-synthesized material) was measured by DSC (Perkin Elmer DSC-7) at a heating rate of 10°C/min in an argon gas atmosphere. DSC traces are presented in Figure S1.
2.3 1H NMR spectroscopy
 (1)
(1) (2)
(2) (3)
(3)2.4 In situ AFM observation
Amorphous polymer films of various thicknesses were deposited on single crystal silicon substrates (Compart Technology, orientation [100] plane) by spin coating at 3000 rpm (solutions were filtrated with 0.2 μm pore-sized filters beforehand), and dried in a vacuum oven at 40°C for 6 hour. The film thicknesses were measured using an ellipsometer (Rudolph Research/Auto EL).
The developing crystalline morphology was observed at a range of temperatures, using an AFM (Auto-probe CP microscope, Park Scientific Instruments) at a scanning rate of 0.5 Hz. Each sample cast on a Si substrate was set on a specially designed in situ heating stage placed on an AFM scanner, and annealed at elevated temperatures ranging from 50 to 190°C. The heating was performed stepwise from low to high temperatures and samples were kept at each elevated temperature for 2 hours before the morphology was recorded. All the AFM data shown in this study are topographic images where whiter areas correspond to a higher surface. The characteristic morphologies of the surface (many examples of which are given in this manuscript, for example, Figures 2 and 4) and bulk crystallinity (an example of which is given in Figure S2) can be used to determine whether surface or bulk crystallization has occurred at a specific annealing temperature in the thin films. A full description of this method is given in Shinotsuka and Assender.24
2.5 Force-distance curve analysis
Scanning force microscope (SFM) force-distance curve measurements of polyesters and copolyesters were carried out using the same AFM used for the morphology study. Details of the measurements and an example analysis are described in Figure S3. The spin-coated films were attached on the in situ heating stage and force-distance curve measurements were taken with the same V-shaped cantilever as the topographic images (contact force of 0.24 nN, contact frequency of 0.7 Hz). The force-distance behavior from AFM curves has been used by multiple groups for the determination of a change in properties, associated with T g.18, 24-28 For measurements reported here, the T g at the near surface was determined from the observed change in the snap-off displacement vs temperature.18, 24, 25 The snap-off displacement at each temperature was taken as the mean of 30 measurements from different locations on the sample. Example data are shown in Figure S3.
3 RESULTS AND DISCUSSION
3.1 Molecular weight, sequence length, and degree of randomness
The molecular weight, sequence length, and degree of randomness of synthesized PET/PEN copolymers are summarized in Table 1. The measured molecular weights are thought to be large enough to exemplify polymeric behavior of the products. As the reaction progresses, the sequence length L T and L N gradually decreases and degree of randomness B increases, depending on the ester exchange reaction rate. The observed behavior of the sequence length and the degree of randomness are consistent with previous reports of the copolymerization of PET/PEN.29-34
3.2 Bulk and surface thermal transition temperatures
T gS of each of the copolymers was determined by analyzing their SFM force distance curve at elevated temperatures. Previous analysis of both PET and PEN24 indicated that T gS is constant with film thickness. Under cold crystallization, we would expect the onset of crystallization to occur above the glass transition temperature, so we would expect that the surface crystallization temperature, T cS, and bulk crystallization temperature, T cB would occur above the respective glass transitions: T gS and the bulk glass transition temperature, T gB. Table 2 shows T gS of the copolymer films determined by SFM force distance curve compared with T cS by AFM, and T gB and T cB by DSC. All the T gS of the copolymers are smaller than their T gB, suggesting the existence of surface layer near the polymer-air interface wherein enhanced polymer chain mobility is manifest in reduced glass transition temperatures.18, 24-28, 35-38 Copolymers close the central compositions, for example, 10, 3, 1, and 13 exhibited T gS closer to the T gB for the same copolymers.
| Composition | Reaction time | T gS by FD curve | T cS by AFM | T gB by DSC | T cB by DSC | |
|---|---|---|---|---|---|---|
| PET/PEN | Minute | °C | °C | °C | °C | |
| PET | 100/0 | 0 | 48.1 | 70 | 71.1 | 130.0 |
| Copoly 6 | 90/10 | 5 | 48.7 | 70 | 77.8 | 140.9 |
| Copoly 4 | 90/10 | 60 | 47.0 | 70 | 72.9 | 137.6 |
| Copoly 10 | 75/25 | 60 | 71.9 | 95 | 80.4 | 176.9 |
| Copoly 3 | 50/50 | 5 | 74.7 | 90 | 87.3 | 182.8 |
| Copoly 1 | 50/50 | 60 | 79.5 | - | 88.9 | - |
| Copoly 13 | 25/75 | 60 | 102.2 | 135 | 105.0 | - |
| Copoly 7 | 10/90 | 60 | 86.5 | 115 | 108.3 | 191.5 |
| Copoly 9 | 10/90 | 5 | 78.4 | 100 | 108.1 | 177.9 |
| PEN | 0/100 | 0 | 85.4 | 115 | 112.0 | 201.0 |
- Note: The data for T cS (surface crystallization temperature) are for the thick films. The data for T cB (bulk crystallization temperature) are the maxima of the exotherm by DSC, hence onset temperatures are lower. DSC traces are presented in Figure S1, from which T cB and T gB (bulk crystallization and glass transition temperatures, respectively) are determined. T gS (surface glass transition temperature) is determined from AFM force-distance curves.
- Abbreviations: AFM, atomic force microscope; DSC, differential scanning calorimeter; FD, force-distance; PEN, poly(ethylene 2,6-naphthalate); PET, poly(ethylene terephthalate).
3.3 Surface morphology diagrams and trends in morphology
In this section, we consider groups of copolymers (PET-rich, PEN-rich and the 50:50 mixtures) in turn and examine the morphological variations seen with composition and with different degrees of randomness (transesterification time). The morphologies observed at the surface are summarized in surface morphology diagrams that give an overall “map” of the crystallization behaviors as a function of films' thickness and annealing temperature.
Although we cannot dismiss the possibility that there is some preferential surface segregation of different components, meaning that the surface region might have a different molecular weight and/or composition than the average of the whole sample, the trends observed strongly suggest that this is not a dominant effect (eg, composition segregation would serve to suppress changes observed as a function of composition), and for the purposes of this discussion we have assumed that there is no significant surface segregation.
3.3.1 PET-rich copolymers
The surface morphology of thin films of PET and PET-rich copolymers, as observed from the AFM imaging, as a function of annealing temperature are summarized as the surface morphology diagrams in Figure 1. Indices in the diagrams correspond with the example AFM images in Figure 2.
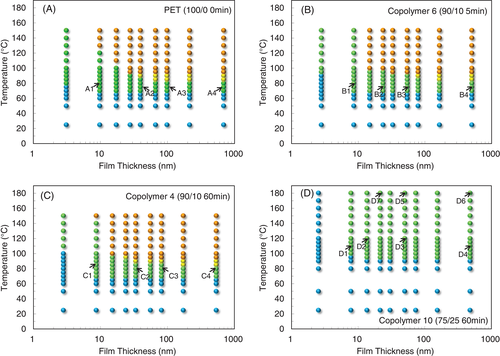
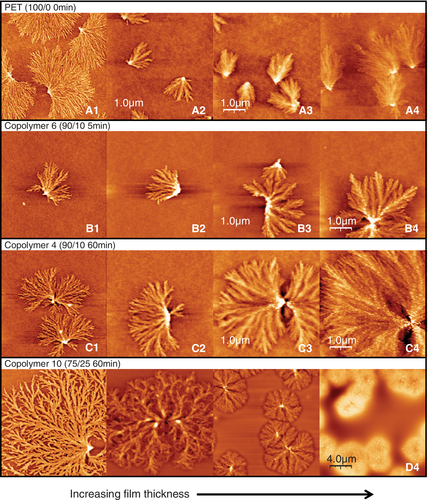
Figure 1A represents the surface morphology diagram of homopolymer PET. As thick films are annealed at increasing temperatures, the originally amorphous, featureless, surface first produces surface crystals (eg, at 70°C, see Figure 2, A4). These surface crystals are thought to emerge and develop within the limited-depth surface layer where the more mobile material occurs due to the lower T g at the surface: an Avrami macro kinetic analysis concluded their crystal dimension is two-dimensional.18 Subsequently, as the film is annealed at temperatures higher than T cB, the characteristic surface crystalline morphology is no longer observed, but is replaced by the, much rougher, characteristic bulk crystalline morphology (Figure S2). The surface crystals are thought to be broken (or obscured by the, now much rougher, surface) or reintegrated (by an Ostwald ripening-type of process) by the forming bulk crystals once the bulk polymer beneath the surface layer becomes mobile. The surface crystalline region is shown in Figure 1A to have a 15°C temperature range in between the amorphous and bulk crystalline regions. If the film thickness is smaller than ca.70 nm, morphological T cB is greatly increased. Images from A1 to A4 in Figure 1A show the thickness dependence of the crystalline morphology of PET thin films. The details of the crystallization of PET films are reported in our previous works.18, 24
The crystallization behavior of copolymer 6 (PET/PEN = 90/10, 5 minute reaction), Figure 1B is basically analogous to PET, although repression of bulk crystallization is still observed in layers that are slightly thicker, and the onset of surface crystallization in the thinnest films occurs at a higher temperature. Thus, crystallization of copolymer 6 is deduced to be more difficult in very thin films (less than ca. 10 nm), whereas thicker films exhibit similar behavior to PET. The AFM images of surface crystals of copolymer 6 are shown from B1 to B4 in Figure 2. These crystalline morphologies are strongly influenced by the major component, PET, resulting in the PET-like fan-shape crystals, although the frequency of branching seems to be slightly greater than that of homopolymer PET.
Copolymer 4 (PET/PEN = 90/10, 60 minute reaction) showed similar propensity in crystalline morphology (Figure 2, C1-C4) and a similar surface morphology diagram (Figure 1C), although there is some increase in lamellar branching and emerging bristle-like protrusions on the lamellar surface in thick films (Figure 2, white spots on the surface crystals in C3 and C4).
In this range of PET/PEN composition (from 100/0 to 90/10), it seems that the copolymer would never lose crystallizability at any degree of transesterification, because the quantity of major component PET units is sufficient to overcome the existence of heterogeneous PEN units, by rejecting PEN units from the primary lamellae body, and/or skipping or including PEN units inside of lamellae as crystalline defects. The incorporation of PEN units might account for the increased branching in copolymer 6 and copolymer 4, as PEN has been shown to be more highly branched,24 but we cannot eliminate the possibility that a change in interfacial properties due rejection of PEN units onto the surface of the developing crystal might also encourage branching.
In the case of copolymer 10 (PET/PEN = 75/25, 60 minute reacted), which has a higher degree of randomness B (1.00) and shorter sequence length L T (5.1) than copolymer 4, it is expected that crystallization would be restricted to some extent, and indeed, Figure 1D, T cS was observed at 95°C, which is 25°C higher than that of PET. For this short sequence length material there was no bulk crystallization observed with the AFM, such that the surface crystalline morphology was sustained even until 180°C. The thinnest film (2.6 nm) did not show surface crystals even at 180°C. As shown in images from D1 to D4 in Figure 2, the crystalline morphology of copolymer 10 is dramatically different from that of PET. In thick films such as D4 (477 nm), lumps of crystal developed with rather spherulitic appearance, whereas fine branches developed in the thinner films of D2 (30 nm) and D1 (7.8 nm). The branching frequency became even higher than copolymer 6 and 4 (90/10 composition), forming a complex morphology distinct from that of PET. L T of copolymer 10 is less than half (5.1) that of copolymer 4, while L N is nearly the same (1.2). Because of the increased probability of the crystalizing chain next containing a heterogeneous PEN component, crystal formation involves a larger number of defects, resulting in plentiful anomalous branching and lamellar deformation.
3.3.2 PEN-rich copolymers
In many respects, the changes in behavior at the PET-rich end are reflected at the PEN-rich end of the composition range. The surface morphology diagrams of PEN-rich copolymers are presented in Figure 3. Although the shape of the diagram seems similar to that of PET, the T cS and T cB of PEN diagram (Figure 3A) are 45°C higher than that of PET and crystallization is repressed more in the thinnest films. Compared with PET, the primary morphological feature of PEN surface crystals is fine and high-dense branching in all growth directions as shown in Figure 4E1 to E4. In addition, if film thickness is larger than ca. 60 nm, fine bristle-like objects protrude vertically from the surface of the crystals (E3 and E4).
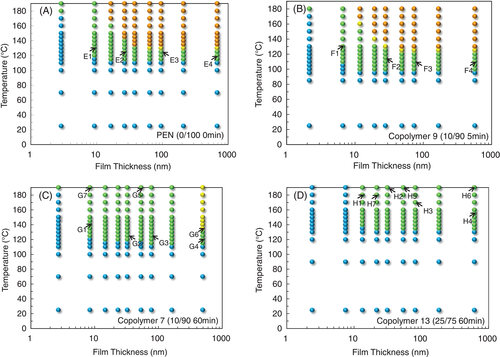
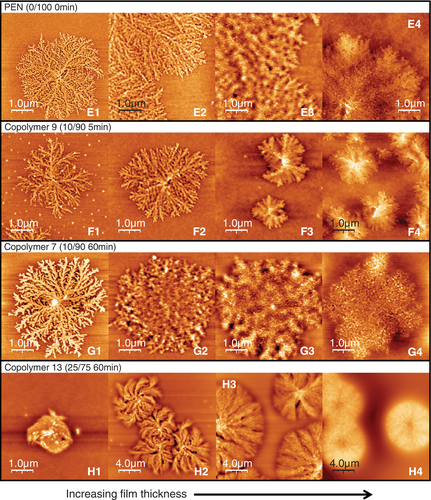
Figure 3B shows the crystal stability diagram of copolymer 9 (PET/PEN = 10/90, 5 minute reacted). At this PEN-rich end of the range, the T cS and T cB (in agreement with DSC measurements, Table 2) are reduced from the homopolymer (PEN) as discussed in Shinotsuka.20 The crystalline morphology of copolymer 9 is, however, basically similar to that of PEN (Figure 4F1-F4), without the bristle-like protrusions on the crystals of thick films (F4).
Copolymer 7 is a PEN-rich copolyester with the same composition as copolymer 9, but it has undergone a longer transesterification (PET/PEN = 10/90, 60 minute reacted), and therefore its sequence length L N is shorter (20). In the surface morphology diagram of copolymer 7 (Figure 3C), the T cS of thick films rebounds to around 115°C. Bulk crystallization was observed only for the thickest, 493 nm, film. Like copolymer 9, copolymer 7 exhibited a crystalline morphology (Figure 4G1-G4) similar to PEN, surface crystals from G2 (32.5 nm) to G4 (493 nm) are covered with thicker bristle-like protrusions than that of PEN crystals (E3 and E4). The width of branches in the crystals of copolymer 7 became larger than that of PEN. In particular, surface crystals on 8 nm thick film (G1) exhibited the typical morphology of diffusion-limited aggregation, which is associated with flat-on lamellar orientation.39-41
Copolymer 13 (PET/PEN = 25/75, 60 minute reacted), as expected for this shorter sequence length polymer, showed more limited range of crystallinity in the diagram (Figure 3D). T cS ascended to 135°C (20°C higher than PEN), whereas morphological T cB totally disappeared. DSC results in Table 2 showed no exotherm for T cB of copolymer 13, which is consistent with the AFM results. Thus, it was shown that even though the bulk crystallization is seriously hindered by the poor sequence matching in copolymer 13 (L N = 4.4, B = 0.91), surface crystallization is still possible presumably due to the enhanced molecular mobility at the surface35-38 which gives more opportunity for matching sequences to find one another. As the surface layer is a very small volume fraction in the bulky specimen for DSC measurement, the crystallization peaks would be too small to detect. This is thought to be similar to the case of copolymer 10 (PET/PEN = 75/25) with increased T cS and extinction of morphological T cB, although copolymer 10 gave a very small DSC exotherm. Also, the increase of T cS in copolymer 13 thin films is similar to the case of its PET-rich counterpart, copolymer 10. Films thinner than 7.5 nm did not crystallize at all in copolymer 13, so even surface crystallization is inhibited.
Images H1 to H4 of copolymer 13 in Figure 4 show a distinct morphology from the other PEN-rich copolymers. Spherulitic crystals appeared in the films of 613 nm thick (H4), similar to the PET-rich equivalent, copolymer 10. As the films become thinner, the lamellae tend to increasingly curve, but do not contain the bristle-like protrusions observed for other PEN-rich surface crystals. By the thinnest films (H1) the high curvature of the lamellae result in their impingement to themselves from an early stage of the crystallization. Branches visible in H3, H2, and H1 are not PEN-like fine branches.
3.3.3 PET/PEN = 50/50 copolymers
Figure 5A shows the surface morphology diagram of copolymer 3 (PET/PEN = 50/50, 5 minute reacted). The short reaction time ensures that the sequence lengths remain reasonably long (LT = 29 and LN = 25) and a TcS was observed at 90°C, between PET and PEN. Bulk crystallization was only observed in the thickest, 436 nm, film. The representative surface crystalline morphology of copolymer 3 is shown as images I1 to I4 in Figure 5. Just 5 minutes reaction produced finely branched surface crystals, which reflect both the morphology of PET-rich and PEN-rich systems. The primary nucleation rate of copolymer 3 was so small that the surface crystals were able to grow up to a diameter of several micrometer without any impingement. Surface crystals on the films thicker than 15 nm were covered with bristle-like protrusions (I2 and I3), which is characteristic of PEN-rich copolymers. As the LT and LN of copolymer 3 are very close one another, it is difficult to determine which component mainly contributes to crystal formation, and it might be an intermediate type comprising elements of both monomers.
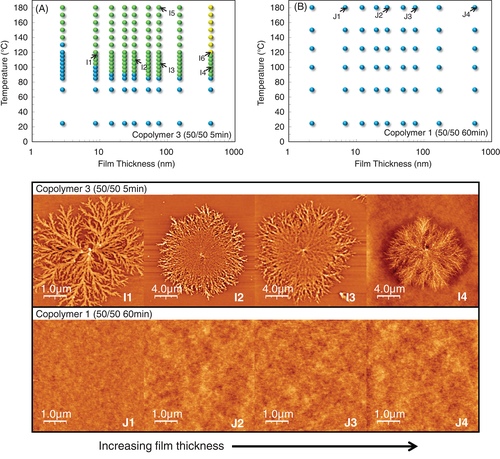
After the 50/50 copolymer was reacted for 60 minute (copolymer 1), no crystallization behavior at all was observed for annealing temperatures up to 180°C (Figure 5B). The L T and L N of copolymer 1 were 2.1 and 1.7, respectively, which seems to be too short to crystallize, even at the mobile surface. Images J1 to J4 in Figure 5 exhibit the amorphous surface of copolymer 1 with no crystalline morphology even at 180°C, suggesting that the randomness is large and the sequence length is small enough to inhibit crystalline nucleation perfectly, as supported by DSC results (Table 2). Kampert and Sauer42 demonstrated that as the transesterification progressed, PET/PEN = 50/50 blends changed to non-crystallizable random copolymer after 25 minute reaction at 285°C, which is a rather mild reaction condition compared to this work. Also, PET/PEN = 50/508 and PEN/PPT = 50/5011 systems completely lost its crystallizability after sufficient reaction period, indicating the formation of random copolyesters.
The observations of PET/PEN copolymers suggest that as the transesterification reaction progresses, crystallizability becomes inhibited due to the shortened sequence length and increased randomness, and at some point, the resulting copolymer entirely loses its ability to crystallize. The more mobile free-surface is, however, able to crystallize more readily than the bulk even for shorter sequence lengths, suggesting a kinetic limitation to crystallization of the more random copolymers. In this study, the necessary minimum sequence length for surface crystallization would be roughly estimated between 2.1 and 4.4 for at least one component, whereas randomness (B) is not critically influential. On the other hand, the shortest sequence length for bulk crystallization is thought to be between 4.4 and 5.1.20 According to the data reported by Jun et al,7 the critical sequence length necessary for bulk crystallization of PET/PEN copolymers is thought to be ca. 4, which is consistent with this study.
3.4 Surface morphology of highly random copolymers
In general, therefore we observe that surface crystallization occurs at lower annealing temperatures and this morphology is overtaken at higher annealing temperatures if bulk crystallization can occur. However, for highly random copolymers the surface crystalline morphology appears to be more resilient.
3.4.1 Morphology changes once bulk crystallization begins
The surface morphology of the copolymers with high randomness and short sequence length at temperatures substantially above TcS are presented in Figure 6. Image I5 (copolymer 3 [50/50, 5 min], 74.8 nm—180°C) showed surface crystals with clear grain boundaries: no bulk crystalline morphology was observed from the surface. The anneal was well above the TcB as measured by DSC (120°C), and at a film thickness of 74.8 nm one might expect enough bulk material to allow crystallization, as is observed for compositions closer to the homopolymers, so we expect that some bulk crystallization is occurring under the surface. This observation implies that for the 74.8 nm thick film, the surface crystals are robust enough not to be overcome by bulk crystals emerging beneath the surface crystalline layer, even at 60°C above the TcB. In contrast, once the film thickness is as great as 436 nm in the same polymer (I6), there is some change in morphology (bright dots in image I6) at 120°C, the TcB as measured by DSC: a suggestion that the crystallization in the bulk region of the film is influencing the morphology observed at the surface, because of the greater thickness of the bulk layer and hence greater effect on roughness, as previously reported.18, 24 These indications of the onset of bulk crystallization are observed particularly in the intergranular regions of the preceding surface crystallization. Similar behavior was observed in the case of copolymer 7 (G5 and G6). At greater film thickness, copolymer 7 apparently developed bulk crystals which can be seen at the grain boundaries of the surface crystals, as indicated in image G6.
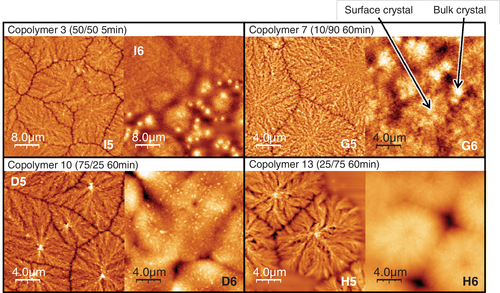
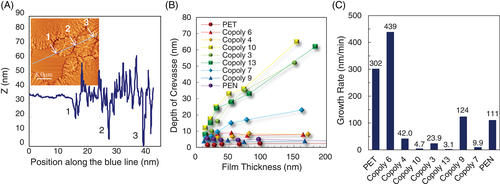
The emergence of bulk crystalline morphology is thought to depend on a balance between thickness of the surface layer and thickness of the bulk layer. Crystallization in the bulk layer will reorder the material causing undulations at the surface that can obscure the previously formed surface crystals from AFM imaging. The greater the thickness of the bulk layer, the greater this disruption will be, but conversely, the thicker the surface crystalline layer, the more robust it will be against being disrupted by underlying crystallization events. If the thickness of the surface crystalline layer is increased in copolymer 3 and 7, the tendency described above will become stronger than that of homopolymers. This speculation is supported by the measurement of depth of crevasses at the grain boundaries (Figure 7A,B) that is thought to be related with the thickness of the surface layer. The details will be described in the next section. These observations also lend weight to the hypothesis that the surface crystals remain after the onset of bulk crystallization and are just obscured in the micrographs, rather than the chains in the surface crystals reordering to become part of bulk crystalline lamellae in an Ostwald-ripening-like process.
The 75/25 and 25/75 copolymers 10 and 13 showed no bulk crystalline morphology in this study. The surface crystals on thin films of copolymer 10 and 13 (D5 and H5, 50 and 54 nm thick) still remained at 180 and 190°C. Even the thick films of these copolymers (D6 and H6, 477 and 613 nm thick) sustained the original spherulitic crystalline morphology even at 180 and 190°C. Although D6 and H6 are in some ways reminiscent of bulk crystals, they are the crystalline morphologies first generated from the amorphous surface at low temperatures, and stepwise increase in temperature showed no further crystallization event to renew the surface morphology.
3.4.2 Thickness of PET/PEN copolymer surface crystals
Figure 7A is an example measurement of the topographic line profile of the surface crystals of copolymer 3 (74.8 nm thick film, 130°C). The profile shows the depths of crevasses at the grain boundaries are very large, for example, the height gap between the bottom of a crevasse and amorphous surface level is measured to be as much as 35 nm. Likewise, the depth of crevasses of all the other copolymers and homopolymers was measured and summarized in Figure 7B. This suggests that copolymers 10, 13, and 3 have increasing depth of crevasses with the film thickness, whereas copolymers 6, 4, and 9, and homopolymers show a certain, smaller, constant value less than ca. 10 nm. We caution that, because of the effect of the width of the AFM tip, if the width of the crevasses increased, this could make the apparent depth seem greater. On the basis of the measurement of the depth of crevasses, the thicknesses of the surface crystals of copolymers 10, 13, and 3 are estimated to be much greater than the other copolymers and homopolymers. These measured thickness of crevasses, which are thought to represent the thickness of surface crystals, are consistent with the surface and bulk crystallization behavior reported here. For edge-on crystals, the thickness of the crystalline surface layer is not the same as the lamellar thickness which, on the basis of SAXS results, Lu et al14 and Patcheak et al43 reported is almost constant irrespective of the composition (the SAXS data show that the long period of PET/PEN copolymers enlarges in the mid-range of the composition, but this can be due to the greater amount of “rejected” interlamellar amorphous material in the mid-range of PET/PEN composition, which brings the greater gap between crystalline lamellae). The apparently thicker surface crystal layers could result from a slower crystal growth, giving more time for chains to be incorporated into the crystals, and hence allowing slightly less mobile chains further from the surface, (or material immediately next to the growing crystal which has been newly exposed to the surface), to be included in the crystal growth.
The greater crevasse depths are, broadly, associated with the more slowly growing crystals—growth rate shows a much stronger correlation to crevasse depth than composition, randomness, or block length. The linear growth rate of the surface crystals annealed above T cS was obtained for 100 nm thick films as shown in Figure 7C. There are significant differences of the growth rate in between highly reacted copolymers (copolymer 10, 13, and 7), and slightly reacted copolymers (copolymer 6 and 9) and homopolymers (PET and PEN). Copolymers 3 and 4 show intermediate growth rate. This is as we might expect: those polymers with long blocks of one monomer type will find matching blocks of monomer more quickly and the growth rate will be greater. All the growth rates were measured at temperatures between T gB and T cB (ie, at a temperature at which we expect only the observed surface crystallization).
Thus, as the crystallization becomes less probable as the sequence length shortens, the growth rate slows. For faster growth rates the crystal development occurs only within a very near-surface region which contains highly mobile material. When the crystal growth is slow, less mobile material from slightly deeper into the film can be incorporated, and also there is more time for chains to migrate, allowing for greater protrusion of crystals from the surface and deeper trenches between.
Based on these discussions, it is possible to deduce that copolymers 3, 7, 10, and 13 might have thicker crystalline layers at the surface than those of PET and PEN, which seal over any appearance of the bulk crystalline morphology at high temperatures. As the DSC results showed that copolymers 3, 7, and 10 are still able to bulk-crystallize, the bulk layer beneath the crystallized surface layer is thought to produce bulk crystallites at temperatures higher than T cB, but these underlying bulk crystallites are not observable with the AFM imaging.
3.5 Lamellar curvature of the surface crystals
PET/PEN copolymers with a significant major component are thought to preferentially crystallize with rejection of any heterogeneous minor component into the interlamellar amorphous, although we might expect some contamination of minor component into major component. This “contamination” of the crystal structure or the rejection of material at the growth front is expected to be reflected in the crystalline morphology.
The crystalline morphology of copolymers such as PET/PEI,9 ethylene/octene,44 and random polypropylene45 exhibit loosely organized crystals with vague boundaries. In the case of thiophene/selenophene copolymer,46 as the molecular sequence changes from blocky to random, the crystalline outline apparently vanished. This blurring of the boundary of the crystals may well be associated with constrained material rejected from the growth front of the crystal. This report is clearly different from the case of PET/PEN copolymers in this study, which exhibit distinct outlines at the crystalline boundary and detailed lamellar features against the amorphous surface even in the case of highly reacted copolymers. This suggests that the PET/PEN copolymers in this study have co-crystallized morphologies without large-scale rejection of a heterogeneous minor component into the amorphous but rather the minor component is included into the crystalline phase (there would be small-scale rejection take place rejecting nonsequence matched materials into the interlamellar amorphous or lamellar fold face, but a large-scale rejection resembling phase separation does not occur).
Images D7 and H7 in Figure 8 show examples of morphologies with highly curved lamellae winding both clockwise and anticlockwise. Copolymer 10 (D7: PET/PEN = 75/25, 60 minute reaction) and copolymer 13 (H7: PET/PEN = 25/75, 60 minute reaction), which both have high randomness and short sequence length, tend to exhibit the deformed lamellar morphology in films thinner than about 50 nm. These morphologies are reminiscent of the study on ultrathin films of poly(ε-caprolactone)/poly(vinyl chloride) (PCL/PVC),47 and poly(l-lactide)/poly(d-lactide) (PLLA/PDLA)39, 48, 49 blends, which produced lamellar curvatures of both handedness. PEN was observed to show curved crystals in very thin films24 in which crystallization is highly constrained, but otherwise such morphology was only observed in the highly random copolymers in the PET/PEN system.
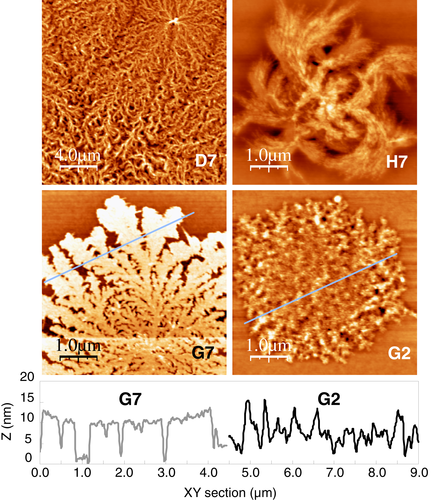
The curvature of the lamellar growth of copolymer 10 and 13 might be due to accumulated stress on the lamellar surface caused by altered unit cell parameters7, 14, 43 in crystals where there is significant co-crystallization because of short sequence lengths (75/25 and 25/75 composition) but nevertheless an imbalance of sequence lengths giving rise to stress where the minor components are incorporated. By contrast, the short sequence length, balanced composition films (copolymer 3) do not show such curvature. Turning of the growth direction can be attained at arbitrary points where stress on the lamellar surface becomes large, in a similar manner to the helical lamellar twisting in the spherulites of polyesters.50, 51 Electron diffraction measurement of PCL/PVC blend thin films indicated that the c axis is tilted against the lamellar fold surface while a and b axes are parallel to the substrate, suggesting that the chain tilting produces stress on the lamellar surface giving the curvature in the growth direction.47 In the case of PLLA/PDLA blend system,39 the curvature of the crystal growth is attributed to the unbalanced mechanical stress caused by the unequally supplied PLLA and PDLA at the growth front. It was demonstrated that the growth direction of the PLLA/PDLA crystal curvature depends on crystallization temperature, film thickness, and composition of the blends, that is not fully understood presently.39
3.6 Flat-on and edge-on lamellae of the surface crystals
Based on selected area electron diffraction analysis, it has been reported that some polymers such as isotactic poly(1-butene),52 isotactic polystyrene,53 and polyamide 654 produce flat-on single crystals when the film thickness is very small. In this study, it was observed that there is a particular film thickness range less than around 10 to 15 nm, in which surface crystals exhibit broad lamellae in the plane consistent with flat-on lamellar morphology. Images G7 and G2 in Figure 8 show line profiles of the topographic cross sections of surface crystals of copolymer 7 (PET/PEN = 10/90, 60 minute reaction). The 8.4 nm thick film (G7) exhibits a constant lamellar height suggesting it is a flat-on crystal with the fold surface parallel to the substrate. As the annealing temperature increased stepwise, and the growth front moved away from the nucleus of the dendritic crystallite, the lamellar width and thickness dilated gradually, presumably reflecting the easier migration of molecules to the growth front. The morphological outlines of the surface crystal in G7 clearly exhibited seaweed-like diffusion-limited aggregation,39-41 which is characteristic of flat-on lamellar crystals.
On the other hand, if film thickness becomes sufficiently large, it has been reported that some polymers tend to produce edge-on lamellar orientation.54-56 The profile of the lamellae of copolymer 7 generated on 32.5 nm thick film (G2) does not show a constant height but many irregular protruded ridges suggesting it is stacks of edge-on lamellae. In this study, all the crystals of homopolymers and copolymers generated on films thicker than around 15 to 20 nm showed edge-on stacked lamellae.
On the basis of the morphological consideration, it is thought that PET/PEN copolymer surface crystals basically consist of lamellar crystals whose orientation is influenced by film thickness. Ma et al57 reported a possible explanation for the switching of the lamellar orientation. According to their Monte Carlo simulation, slippery substrates induce surface assisted nucleation resulting in edge-on lamellae, whereas sticky substrates induce self-seeded nucleation resulting in flat-on lamellae. The observed results in this study imply that the interface between bulk and surface layers is slippery because films thicker than ca. 10 nm produce edge-on crystals, whereas the surface of the silicon substrate seems sticky because films thinner than ca. 10 nm preferentially induces flat-on orientation. The substrate surface is anticipated to have affinity with polyester molecules, which can be observed in the results of crystallization behavior of ultrathin films (thinner than 10 nm) in their increased T cS and morphology (Figures 1, 3, and 5). In contrast, the interface between the surface and bulk layer is anticipated to be slippery because this is the boundary where mobile rubbery chains creep on the less mobile bulk layer toward the crystallizing growth front. This is consistent with our previous study on calculation of average thickness of the surface layer in PET films of 13.6 nm.18 For instance, judging from the morphological features and thickness of the film, the AFM images in Figure 5 show that I1 might be flat-on, whereas image I2, I3, and I4 seems to be edge-on orientation.
The lamellar orientation of the surface crystals of PET/PEN copolymers have not been examined by a diffraction method such as selected area electron diffraction or grazing incidence X-ray diffraction, hence it is necessary to confirm the lamellar orientation directly for more detailed discussions in the future.
3.7 Spherulitic surface crystals in highly reacted copolymers
In the case of copolymer 10, 13, 3, and 7, the thickness of the surface crystal is thought to increase as shown in Figure 7B, allowing more growth of the crystals into the depth of the surface layer giving rise to a less constrained, more spherulitic-like morphology.
Figure 9 shows line profiles of surface crystals of copolymer 10 and 13. When the film thickness of copolymer 10 is smaller than ca. 200 nm, for example, 73 nm thick in Figure 9A, it produced surface crystals whose central nucleus is the highest point, whereas thick films such as 477 nm developed spherulitic crystals protruding about 130 nm height from the amorphous film surface with a central hollow of about 50 nm depth (Figure 9A). As shown in Figure 9, the height of the nuclei on 73 and 477 nm thick films of copolymer 10 are not very different from one another. If the primary nucleation produces nuclei with a constant height from the amorphous surface in both 73 and 477 nm thick films, and the subsequent secondary crystal growth produces surrounding crystalline entity whose thickness depends on the thickness of the surface layer of each film, a developed crystal on 73 nm thick film will have a protruded central nucleus, whereas 477 thick film develops an apparent hollow in the center of a spherulitic thick crystal. A similar observation is made for copolymer 13 (Figure 9B). The unique surface crystals with a protrusion or a hollow in the center, developed on the films of copolymer 10 and 13, resemble the surface crystals of poly(l-lactide).58
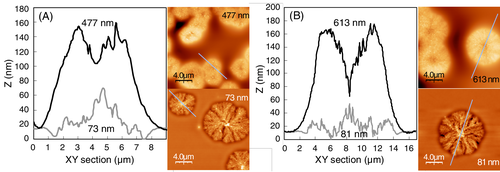
Obviously, the protrusion of the crystal nuclei becomes smaller if the film thickness becomes smaller than around 40 nm. Thus, the crystal nuclei with a constant height discussed above is not observed in the very thin films.
4 CONCLUSIONS
- A full, systematic study of a series of PET/PEN copolymer thin films with various composition, sequence length and randomness, and thickness showed diversified crystallizability and unique morphologies. The morphology of the surface crystals is basically categorized into PET-like (copolymers 6, 4, and 10), PEN-like (copolymers 9, 7, and 13), and the intermediate of the two types (copolymer 3).
- SFM force-distance curve measurements detected the T gS of the copolymers up to several tens of degrees below their T gB obtained by DSC. The difference between T gS and T gB became small in the shorter sequence length copolymers 10, 13, 3, and 7, that might give rise to the observed apparent thickening of the surface layer. This apparent thickening was evidenced by increased crevice depth at the impingement lines between crystallites, and also the more spherulitic-like morphologies that moved from having a protruding central nucleation point for films with thinner surface layer to a hollow at the central nucleation point for films with thicker surface layer.
- The morphological T cS of the thicker films was found to be several degrees lower than the T cB by DSC, with the onset temperature of crystallization raised for the thinnest films to a degree that depended on copolymer composition and randomness. Surface crystals in films thinner than ca. 100 nm showed significantly increased thermal stability. The surface morphologies showed no bulk crystalline morphologies in all the thicknesses of copolymers 10 (75/25, 60 minute) and 13 (25/75, 60 minute), and in films less than 400 nm thick of copolymers 3 (50/50, 5 minute) and 7 (10/90, 60 minute) films, which is either because no bulk crystallization is occurring (no T cB by DSC for copolymer 13, and for very thin films in other polymers all bulk crystallization may be inhibited) or because, for some compositions, thick surface crystals conceal the appearance of the bulk crystalline morphology.
- In most conditions the crystal lamellae show distinct edges, contrary to what has been observed in crystals in the literature that reject a lot of material at the growth front, lending support to the idea that co-crystallization is occurring in this, confined, surface crystallinity, and this is further supported by the observation that thin films (less than ca. 22 nm) of copolymers 10 and 13 produce surface crystals with a curved lamellae which is thought to be caused by changes in the unit cell parameters due to their poor sequence matching.
ACKNOWLEDGMENTS
The authors express our appreciation to the financial support by Oji Paper Co., Ltd. We thank Mr. Kimihiro Ogawa in Teijin Chemical Co., Ltd. for his kind offer of PEN pellets and its instructions. We acknowledge for Prof. Timothy D. W. Claridge at the Chemistry Department in the University of Oxford for his kind collaboration on 1H NMR analysis.


