Childhood Obesity and the Food Environment: A Population-Based Sample of Public School Children in New York City
Abstract
Objective
This study aimed to examine the relationship between proximity to healthy and unhealthy food outlets around children’s homes and their weight outcomes.
Methods
A total of 3,507,542 student-year observations of height and weight data from the 2009-2013 annual FitnessGram assessment of New York City public school students were used. BMI z scores were calculated, student obesity or obesity/overweight was determined using Centers for Disease Control and Prevention growth charts, and these data were combined with the locations of four food outlet types (fast-food restaurants, wait-service restaurants, corner stores, and supermarkets) to calculate distance to the nearest outlet. Associations between weight status outcomes and distance to these food outlet types were examined using neighborhood (census tract) fixed effects.
Results
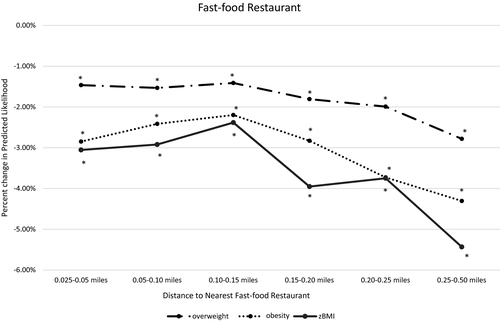
Living farther than 0.025 mile (about half of a city block) from the nearest fast-food restaurant was associated with lower obesity and obesity/overweight risk and lower BMI z scores. Results ranged from 2.5% to 4.4% decreased obesity. Beyond this distance, there were generally no impacts of the food environment and little to no impact of other food outlet types.
Conclusions
Proximity to fast-food restaurants was inversely related to childhood obesity, but no relationships beyond that were seen. These findings can help better inform policies focused on food access, which could, in turn, reduce childhood obesity.
Study Importance
What is already known?
- Many factors (biology, built environment, social environment) influence food intake.
- The food environment may play a role in shaping childhood obesity in the United States.
What does this study add?
- This study examines the relationship between the food environment and childhood obesity by using a large data set with detailed address information that more fully considers neighborhood selection and confounding.
How might these results change the direction of research?
- Data such as these may inform the development of future health policy.
Introduction
Childhood obesity has been on the rise since the 1980s and is now estimated to affect 18.5% of 2- to 19-year-olds in the United States (1). It is disproportionately higher in non-Hispanic black (19.5%) and Hispanic youth (21.9%) compared with their non-Hispanic white (14.7%) and non-Hispanic Asian counterparts (8.6%) (2). Maintaining a BMI within a healthy range potentially decreases the risk for chronic diseases, including cardiovascular disease, cancer, and stroke, as well as improves psychosocial health (2, 3). By 2030, if the obesity trend continues, it is estimated that the medical costs attributable to obesity will reach $48 to $66 billion each year in the United States (4).
The causes of and solutions to childhood obesity have not been clearly elucidated (5). Attention has been paid to the key role the food environment, including the location of food resources, may play in shaping the obesity epidemic (6, 7). Research suggests that the gradual weight gain seen in the US population can be attributed to increases in caloric intake, likely attributable to increased consumption of “empty calories” and decreased consumption of nutrient-dense foods (8-11). Many studies have linked fast-food consumption, in particular, to excess calorie intake and poor diet quality (12-16).
Generally, previous research investigating associations between objectively measured food environments (e.g., proximity to food outlets) and a child’s weight status have found few statistically significant associations. The few studies that did find statistically significant results support the current understanding of the relationship between the food environment and obesity, in that obesity is positively correlated with proximity to fast-food restaurants and inversely correlated with supermarkets. These studies have examined particular aspects of the food environment, that is, authors have looked at the effect of supermarkets or fast-food restaurants on weight outcome (17-23). Another key limitation of these studies is that only a few have examined the food environment around children’s homes (23, 24), including very small distances (of less than 0.1 mile) in urban areas (16, 17). Our prior work has found that, in New York City, public school children have enormous access to food outlets (both in terms of proximity to food outlets and the number of outlets available within walking distance), and that disparities exist (25).
Equally important, only a small number of studies have examined whether the relationship between access and child BMI is biased because of unmeasured neighborhood-level confounders or selection into particular neighborhoods (17-23). For example, some studies have used fixed-effects models at different levels to examine how variation in the food environment around homes affects weight outcomes (23, 26). Others have used an instrumental variable strategy (proximity and/or access to a highway) to address endogeneity when examining the effects of fast-food restaurant access on BMI (27-29). Overall, these studies have focused on fast-food access as opposed to broader aspects of the food environment.
Our study examines access to healthy and unhealthy food outlets around children’s homes and its relationship to children’s obesity, obesity/overweight, and BMI. We defined “unhealthy” outlets as fast-food restaurants and corner stores and “healthy” outlets as wait-service restaurants and supermarkets. Whereas healthy outlets also sell high-calorie, unhealthy foods and unhealthy outlets sell healthier foods, it was shown that the majority of corner stores had limited availability of healthy foods, and healthy food availability increased with store size overall (30). Importantly, youth consumers tend to purchase high-calorie foods in the stores we consider unhealthy outlets (31). We used a population-based sample of public school children in New York City and looked at very small distances (including those less than 0.1 mile around residences), with a primary estimation strategy using census tract fixed effects. This allowed us to compare only children who live within the same census tract and to examine small differences in distances to the nearest food outlet that are more likely to be driven by chance. The primary hypothesis is that children who live very close to unhealthy food outlets (e.g., fast-food outlets, corner stores) will have an increased weight status. In contrast, children who live very close to relatively healthier food outlets (e.g., wait-service restaurants, supermarkets) will have a decreased weight status.
Methods
Participants
Data were from the New York City Department of Education for the 2009-2013 school years, representing all children in the New York City public school system. Children living within 0.5 mile of New York City borders were excluded because of lack of complete food environment variables (data represented New York City only). Otherwise, children were excluded only for having missing data.
Weight status outcomes
Height and weight data came from the 2009-2013 FitnessGram, an annual, school-based, standardized assessment that measures the BMI of every public school child in kindergarten through 12th grade (32). Data collection takes place throughout the year, is done by the physical education teacher or school nurse, and previously was proven valid, in terms of both its testing method (33) and its rates of reporting across different races and ethnicities (34). From this data, the z score of the BMI (zBMI) was calculated and standardized by age (in months) and sex. Two binary outcomes were created for obesity (≥ 95th percentile of the zBMI) and obesity or overweight (≥ 85th percentile of the zBMI) based on the Centers for Disease Control and Prevention growth charts.
Home food environment variables
Four food retail outlet variables were derived from two data sources: (1) the New York City Department of Health and Mental Hygiene restaurant grading data, which were used to determine the locations of fast-food and wait-service restaurants, and (2) the New York State Department of Agriculture and Markets licensing and inspection data, which were used to determine the locations of supermarkets and corner stores. The four food outlet types were defined as follows: corner stores, stores with a floor area of less than 6,000 sq ft, representing 90.8% of all nonrestaurant food retail stores in New York City; supermarkets, stores with a floor area of more than 6,000 sq ft, representing 9.2% of all nonrestaurant food retail stores; fast-food restaurants, both national chain and nonchain fast-food restaurants without wait service as well as other restaurants that do not specify service type, representing 60.1% of all restaurants; and wait-service restaurants, both chain and nonchain restaurants with wait or table service, representing 39.9% of all restaurants. Per city and state regulations, restaurants are inspected annually, and retail food stores are inspected at least every 18 months. Mobile food outlets, such as street vendors and food trucks, are not captured in either data set. Other retail store types, such as pharmacies and dollar stores, are excluded because they represent a very small portion of the food environment. Our four categories represent 93% of the food outlets in the city. For each food outlet type, an indicator was created based on the presence of the nearest food outlet open at the beginning of the school year. Both the New York City Department of Health and Mental Hygiene and the New York State Department of Agriculture and Markets maintain archival data that record inspections conducted in previous years. We were able to obtain these data through Freedom of Information Law requests to create year-specific indicators for the food environment.
Based on our knowledge of the food environment in New York City and to allow for the possibility that small distances can make a meaningful impact on people’s food behavior, we created a set of mutually exclusive street network distances as small as feasible to allow us to explore statistically whether such small distances matter. These distances included: 0 to 0.025 mile (i.e., approximately 0-0.5 block in New York City), 0.025 to 0.05 mile (0.5-1 block), 0.05 to 0.1 mile (1-2 blocks), 0.1 to 0.15 mile (2-3 blocks), 0.15 to 0.2 mile (3-4 blocks), 0.2 to 0.25 mile (4-5 blocks), and 0.25 to 0.5 mile (5-10 blocks). We primarily chose 0.5 mile as the upper bound of our analysis because this is a reasonable walking distance, or approximately 10 minutes of walking, for people in New York City to access food without having to rely on alternative transportation methods. For example, public school students in kindergarten through second grade who live farther than 0.5 mile from their schools are eligible for transportation assistance. Children living within 0.5 mile from city borders are excluded from our analysis because these families may access food outside of the city border in Westchester and Nassau counties, and our restaurant data do not cover inspections in these areas. It is also noteworthy that relaxing such a constraint, for example, to 0.25 mile, has little impact on our sample size or the results. We used ArcGIS version 10.5 (Esri, Redlands, California) to calculate the street network distances between the geographic coordinates of children’s homes and the food outlets and SAS version 9.3 (SAS Institute, Inc., Cary, North Carolina) for euclidean distances.
Statistical analysis
We described the overall sample characteristics by presence of each food outlet within incremental and exclusive distances around each child’s home. We then examined the associations between a child’s weight status outcomes (obesity, obesity/overweight, and zBMI in three separate regressions) and each food outlet type using the mutually exclusive network distances. We included the binary outcomes obesity and obesity/overweight because they have clinical significance, whereas a continuous zBMI allowed us to examine smaller changes over time. All food types were included in the same model.
We used ordinary least squares regression for all of our models. Current literature has suggested that it performs as well as, if not better than, a logit/probit estimator for a dichotomous outcome under the circumstances that the outcome is usually not predicted at the extreme ends (35) (i.e., close to zero or one) and that the model estimates associations between the independent and outcome variables (36). Such an estimation strategy also allows a simpler interpretation of the results, particularly the coefficients.
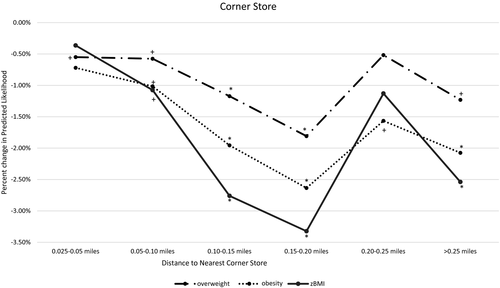
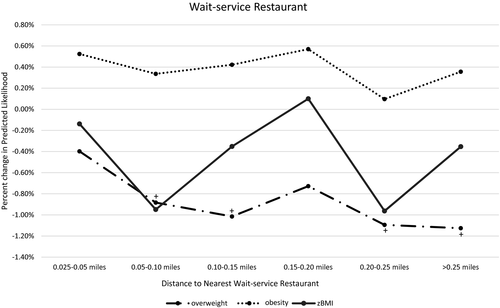
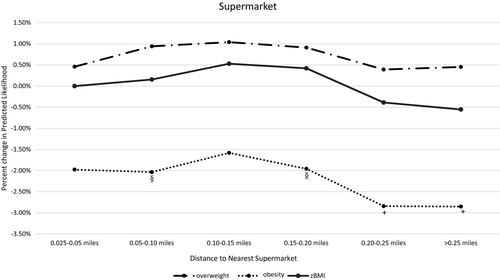
Our primary estimation strategy used census tract-level fixed effects, or the inclusion of a separate indicator/dummy variable for every tract (minus one excluded tract), which allowed us to compare only children within the same census tract (thereby controlling for unobserved selection into neighborhoods). We also adjusted for year, child characteristics, and housing characteristics along with robust SEs. Child characteristics included race/ethnicity (black, Hispanic, white, and Asian and other), age, grade, sex, poverty status (whether the child qualified for free or reduced-price lunch, generally defined as family income below 185% of the federal poverty line), whether the child was foreign born, whether the child received special education, and whether the child was classified as having limited English proficiency. Residential housing data came from New York City Real Property Assessment data. We included housing variables because they are potential confounders, and, even in the same neighborhood, housing characteristics can be associated with both proximity to food outlets and weight outcomes. These variables included indicators for housing type (one-family residence, two- to four-family residence, and five-family residence or higher, including condos, mixed-use buildings, other residential buildings, and nonresidential buildings) and an indicator for whether the child lived in public housing. In Figures 1-4, we present the results of the regressions as the percentage change in each outcome, calculated as the predicted mean of each outcome (e.g., the probability of having obesity, calculated using the Margins command in Stata software) minus the reference group’s mean (0-0.025 mile), divided by the reference group mean, and then multiplied by 100. We present the actual regression coefficients in Supporting Information Table S5, and we used Stata software version 15 (StataCorp LLC, College Station, Texas) for all analyses.
We also performed several supplementary sensitivity analyses, including (1) replacing street network distance with euclidean distance buffers; (2) separating regressions by grade (kindergarten to fifth grade and sixth to twelfth grade); (3) separating regressions by boroughs of New York City (i.e., counties: Bronx, Kings, New York, Queens, and Richmond); (4) removing the top 10% of children in our sample with the most access to commercial space around their homes because research has shown that retail activities are sometimes more strongly associated with obesity (37); (5) reclassifying restaurants without a specified service type into the wait-service category (as opposed to fast food); (6) breaking out nonrestaurant food retail stores into finer and smaller categories (bodegas < 2,000 sq ft in floor area, medium supermarkets 2,000-6,000 sq ft in floor area, and large supermarkets ≥ 6,000 sq ft in floor area); (7) accounting for a lower density of supermarkets (compared with other food outlet types) by setting the reference group to 0 to 0.05 mile instead of 0 to 0.025 mile; (8) comparing regression results with and without census tract fixed effects, (9) separating regressions on nonpoor and poor student samples; (10) adding clustered SEs at the student level (because a student could be observed multiple times, and this violates the assumption of independence); (11) introducing a time-lagged food exposure in years t-1 and t-2, respectively, for year t weight outcomes because the change in food environment might not have an effect on weight outcomes immediately or within the same year (this approach allowed us to continue using our preferred estimation strategy while also better using the longitudinal nature of the food environment data, potentially pointing to more than associations); and (12) examining effect sizes stratified by year, of all three outcomes, instead of the average effect that is presented in our main model.
Results
Our final analytic sample consisted of 3,507,542 student-year observations in 2,111 unique census tracts. In academic year (AY) 2012-2013, there were 1,052,807 children in traditional (not special education or charter) schools. Of these, 5.2% (n = 54,555) were excluded for missing residential address data, 4.2% (n = 44,366) were excluded for missing school address data, 10.1% (n = 106,307) were excluded for missing height or weight data, 0.4% (n = 4,430) were excluded for missing biologically plausible weight status data (1), 1.4% (n = 14,935) were excluded for missing home and school census tract information (the home or school addresses of these students could not be successfully recognized in the geocoding software developed by the New York City Department of City Planning), 2.1% (n = 22,600) were excluded for living within 0.5 mile of a New York City border, 3.4% (n = 35,977) were excluded for being in grades other than kindergarten through 12th grade (including prekindergarten, ungraded special education, home or hospital instruction, and alternative high school), and 3.3% (n = 34,445) were excluded for not having a fast-food restaurant within 0.5 mile from home (because such isolation is unusual and unrepresentative of New York City). In our sample of 1,188,658 students over 5 years (3,507,542 observations), 24% were observed only once and 20%, 16%, 18%, and 22% were observed two, three, four, and five times, respectively.
Supporting Information Tables S1 to S4 show the child characteristics of our sample from 2013 (we used data from 2013 to describe sample characteristics and full 2009-2013 data for the subsequent regressions). Children were predominantly classified as poor (84.1% qualified for free or reduced-price lunch). Approximately 19.5% of children had obesity (BMI ≥ 95th percentile), and 37.4% of children at least had obesity or overweight (BMI ≥ 85th percentile). Children were primarily Hispanic (40.4%), followed by black (25.9%), Asian and other (18.1%), and white (15.6%). Children lived in all five boroughs: Manhattan (11.5%), Bronx (21.5%), Brooklyn (32.4%), Queens (28.7%), and Staten Island (5.9%). Each of these boroughs is different in terms of its children, density, and food environment, and we differentially looked at results by borough in the sensitivity analysis. We also looked at the overall student characteristics by year, as shown in Supporting information Table S18, which suggest that the sample remained relatively stable in terms of its demographics and weight outcomes between AY 2009 and AY 2013.
Of the 65,491 children whose nearest fast-food restaurant was within 0.025 mile (about half a city block) from home, 38.1% were at least overweight, 50.5% were Hispanic, 85.1% were poor, and the majority of them resided in Manhattan and Brooklyn. Children whose nearest fast-food restaurant was within 0.25 to 0.5 mile from home were similar by race/ethnicity but more likely to live in the Bronx or Brooklyn (demographic data broken down by wait-service restaurants, corner stores, and supermarkets provided in Supporting Information Tables S2 to S4).
We found that children who lived within 0.025 mile of a fast-food restaurant had a probability of having obesity of 0.19, a probability of having obesity or overweight of 0.37, and a predicted zBMI of 0.57. Greater distances from home to fast-food restaurants in our sample were associated with lower risk of obesity (percentage change range = −4.4% to −2.5%), lower risk of obesity or overweight (percentage change range = −2.9% to −1.3%), and lower zBMI (percentage change range = −5.4% to −2.6%) (all P < 0.01; Figure 1, Supporting Information Table S5). Being farther away from corner stores was also associated with better weight outcomes but generally not until 0.05 to 0.1 mile away (Figure 2, Supporting Information Table S5). The findings for wait-service restaurants and supermarkets were mostly nonsignificant (Figures 3, 4, Supporting Information Table S5).
We also performed a series of sensitivity analyses. These analyses are presented in Supporting Information Tables S6 to S13, S16, and S17. Results from such analyses were generally consistent with our primary model; such analyses included replacing street network distance with euclidean distance (or “crow flies” distance) (Supporting Information Table S6), separating the sample by grade (Supporting Information Table S7), removing the top 10% decile of the students who lived near large areas of commercial activities (Supporting Information Table S9), using alternative food categories (Supporting Information Table S10), and accounting for a relatively lower density of supermarkets (Supporting Information Table S11), as well as stratifying by year (Supporting Information Tables S19 to S21). An analysis by borough returned somewhat mixed results (Supporting Information Table S8), and future work should continue to examine these differences. In Supporting Information Table S12, in which census tract fixed effects were removed, results were more muted for fast-food restaurants but were larger and more likely to be significant for corner stores. When we estimated regressions separating poor and nonpoor students (Supporting Information Table S13), we found that the results were more likely to be driven by poor students. However, coefficients for fast-food restaurants showed a similar magnitude for nonpoor students, and the effect of corner stores was potentially even more prominent among nonpoor students. It is worth noting that with clustered SEs at the student level (Supporting Information Table S17), the results remained consistent with our main model, as did introducing a time lag of food exposure of 1 or 2 years (Supporting Information Table S16).
On a separate note, because our estimation strategy relies on differences within tracts, we present in Supporting Information Table S14 data showing that when comparing the SD within tracts with the city average, meaningful variations still existed. It is also worth noting that we looked at the correlation in food outlet measurements over the years in Supporting Information Table S15, with very high year-to-year correlations (pairwise correlation coefficients at 0.87 or higher) and the multiyear correlations not dropping much lower. Considering such slow changes in the food environment over time, implementing a panel data approach was not feasible. Describing the food environment generally, in AY 2013, the mean distances to the nearest fast-food restaurant, corner store, wait-service restaurant, and supermarket from students’ homes were 641, 710, 1,095, and 1,535 feet, respectively (25).
Discussion
With our sample of more than 3.5 million child-year observations from 2009 to 2013 in the New York City public school system, we examined associations between the nearest food outlets (i.e., fast-food outlets, wait-service restaurants, corner stores, and supermarkets) to children’s homes and their weight outcomes (obesity, obesity/overweight, and zBMI). Overall, those living very close (less than 0.025 mile) to fast-food restaurants had a higher likelihood of having obesity or obesity/overweight and a higher predicted zBMI than those living farther away (in the case of fast food, a 3% difference in obesity between those who lived very close versus just half a block farther away). Somewhat similar results were found for corner stores, with consistent results seen for smaller stores (< 2,000 sq ft) and greater distances associated with better weight outcomes. Wait-service restaurants and supermarkets were not consistently associated with obesity. That we did not find significant results for wait-service restaurants may be due to the fact that children and adolescents were shown to frequent those types of outlets nearly three times less than they do fast-food restaurants (38). Beyond these very small differences in the two food retail types, the food environment was not found to impact weight status. Of particular note is that supermarkets (a major prior policy focus) were not found to be associated with obesity. Results did differ overall by borough, and future work must disentangle why and determine what might be most representative of other urban areas.
A large number of studies of mixed quality exist on the relationship between the food environment and childhood obesity (22). A recent review investigating neighborhood food environments and obesity found that most studies used cross-sectional designs and that the relationships between food environments and weight status were mostly null (22). Furthermore, very few studies contended with endogeneity, and those that did focused on restaurants, mostly fast-food restaurants (23-25). Our study adds to existing literature by examining multiple food outlet types around each child’s home. Additionally, we partially addressed endogeneity with census tract fixed effects, which very few studies are able to do (and has thus far only been done for fast-food restaurants).
This work has multiple implications for policy. First, our work implies that for children, food outlets traditionally considered unhealthy are more influential aspects of the food environment than healthy food. Most policies, in contrast, focus on outlets considered to sell healthier foods, namely supermarkets. This has resulted in policies that target increases in such stores, which sell food generally considered to be healthier. New York City launched the Food Retail Expansion to Support Health program in 2009 to promote the creation of supermarkets in underserved and low-income communities through zoning and financial incentives (39). Across the United States, the federally sponsored Healthy Food Financing Initiative has been implemented to address a lack of access to fresh, healthy foods in lower-income communities. In 2015, one such initiative allotted $2 million to the Ohio Department of Job and Family Services to oversee the statewide Healthy Food for Ohio program (40). In California, the state passed the California Healthy Food Financing Initiative to fund partnerships supporting new fresh, healthy food stores in both urban and rural communities (40).
Our study implies that a shift in policies is warranted and that the focus might do well to pivot to outlets selling less healthy items. At the same time, it is worth noting that policies restricting food access are more difficult to garner support for politically. However, Los Angeles and London both introduced regulations banning new fast-food restaurants in fast food–dense areas. These municipalities were able to implement policies to restrict the availability of less healthy foods, although they were challenged along the way. In Los Angeles, the 1-year ordinance enacted in 2008 was the first to consider health concerns and eating behavior based on food environment when regulating restaurant locations (41). The London Plan (2017) similarly targeted the density of fast-food restaurants, focusing specifically on preventing an overconcentration of these eateries in low-income boroughs and decreasing their proximity to primary and secondary schools (42).
However, the overall impact of the food environment measured in our study is quite limited to New York City. As a result, policy makers should understand that policies must be well targeted, and even those policies that are well targeted will have a small, but potentially important, incremental impact on childhood obesity.
There are some limitations to this work, including that the sample was limited to New York City public school children (in 2014, almost 90% of school-aged children in New York City were enrolled in public school) (43, 44) and that not all students had their BMI measured. However, the measurement rates for the period of our study were quite high (almost 90% of all students) compared with those from earlier years of the program (32). Future work should examine the cumulative role of the food environment (over time) and the influence of the school food environment, which others showed to be a potentially important measure influencing childhood BMI (26). We also note that we lacked data on food prices in our models, which are beyond the scope of our administrative data but an important factor for future work to consider because prices may impact food purchasing behavior. We found some small but statistically significant impacts and framed them as being small throughout. It is important to point out, again, that with our sample size, even small effects can be statistically significant, and we must be cautious in interpretation. Additionally, although tract fixed effects in our models controlled for unobserved differences across tracts, they did not control for within-tract variances. These variances were, however, possibly quite small, given that census tract is a relatively small geographic unit. We also lacked information on sibling status within the same household. Finally, we must remember that we are not randomly assigning children to live varying differences from food outlets. Although we believe we make significant strides toward this difficult-to-achieve, if not impossible, ideal study design, results still must be viewed with appropriate caution.
Conclusion
Our findings suggest that policy efforts to create a healthy food environment in proximity to home can have small but potentially meaningful health implications for at least a subset of children who live very close to such establishments. However, the relatively muted findings on the role of the food environment, at least measured by one aspect of access, show that for urban areas, we need to continue to look beyond a single solution and toward a suite of policy solutions to better impact obesity.
Acknowledgments
The authors acknowledge the contributions of Courtney Abrams, Olivia Martinez, and Tisheya Ward.


