Lithospermum erythrorhizon Root and its Naphthoquinones Repress SREBP1c and Activate PGC1α Through AMPKα
Funding agencies: This study was fully funded by Amway Corporation.
Disclosure: All Authors are employees of Amway Research and Development.
Author contributions: RAV conceived, designed, and conducted experiments; analyzed data; and wrote the manuscript. AR and JR contributed to the design, conduct, and data analysis of experiments. KG conducted experiments and analyzed data. All authors reviewed and approved the final manuscript.
Abstract
Objective
To examine specific molecular mechanisms involved in modulating hepatic lipogenesis and mitochondria biogenesis signals by Lithospermum erythrorhizon (gromwell) root extract.
Methods
Stable cell lines with luciferase reporter constructs were generated to examine sterol regulatory element binding protein 1c (SREBP1c) and peroxisome proliferator-activated receptor gamma, coactivator 1 (PGC1) α promoter activity and estrogen-related receptor (ERR) α response element activity. Gene expression of SREBP1c, stearoyl coenzyme A desaturase 1, and PGC1α was measured by using reverse transcription polymerase chain reaction. Lipogenesis was measured in human hepatoma cells with Nile red staining and flow cytometry. Phosphorylation of AMP-activated protein kinase (AMPK) α was determined by using ELISA and Western blot.
Results
Gromwell root extract and its naphthoquinones dose-dependently repressed high glucose and liver X receptor α induction of SREBP1c promoter activity and gene expression. Hepatic lipogenesis was repressed, and PGC1α promoter and gene expression and ERRα response element activity were increased by gromwell root extract. Gromwell root extract, shikonin, and α-methyl-n-butyrylshikonin increased AMPKα phosphorylation, and inhibition of AMPK blunted the repression in SREBP1c promoter activity by gromwell root extract and its naphthoquinones.
Conclusions
Data suggest that gromwell root extract and its naphthoquinones repress lipogenesis by increasing the phosphorylated state of AMPKα and stimulating mitochondrial biogenesis signals.
Introduction
Chronic excess energy intake and subsequent lipogenesis, from both dietary fats and carbohydrates, are significant factors contributing to metabolic dysfunction associated with nonalcoholic fatty liver disease, hepatic steatosis, insulin resistance, diabetes, and obesity (1-3). Elevated circulating glucose, insulin, and hepatic de novo lipogenesis are common features of these metabolic dysfunctions and diseases. The balance of energy within cells is coordinated by nutrient sensors that control the shuttling of carbons toward storage or utilization pathways, and many of these are transcription factors that regulate hepatic de novo lipogenesis (4). These transcription factors are controlled at the promoter level of transcription and post-translation by kinases. Liver X receptor (LXR) α, sterol regulatory element binding protein 1c (SREBP1c), and carbohydrate response element binding protein (ChREBP) are three major transcription factors that coordinate hepatic de novo lipogenesis (4). LXRα is activated directly by glucose and glycolytic metabolites, leading to increased gene expression of both SREBP1c and ChREBP by binding to LXR response elements on their promoters and some of their gene targets (5-7). SREBP1c is particularly important in regulating fatty acid and triglyceride synthesis genes by binding to their promoters and turning on gene expression (8, 9). Glucose also directly activates ChREBP by stimulating its expression, leading to the activation of both glycolytic and lipogenic genes by binding to ChRE present on their promoters (9, 10).
The peroxisome proliferator-activated receptor gamma coactivator 1 (PGC1) family of transcriptional coactivators and the estrogen-related receptor (ERR) α control mitochondria energy metabolism in various tissues (11-13). Individually, they are not highly robust in regulating gene expression; however, together they become potent gene modulators as coactivators/corepressors at the promoter site of target genes. The PGC1 family comprises PGC1α, PGC1β, and PGC1-related coactivator, which share structural features and function and have the capacity to regulate mitochondrial biogenesis. However, they differ in the type of signals that trigger their mitochondrial biogenic activity. PGC1α, as well as ERRα, are induced by signals that occur during elevated energy needs like exercise or fasting, whereas PGC1β is believed to be more involved in the maintenance of basal mitochondrial activity (11). Together the PGC1α/ERRα axis controls the promoter activity of genes that are involved in a vast network of mitochondria processes (14).
AMP-activated protein kinase (AMPK) is a major sensor of cellular AMP, ADP, and ATP levels and controls cellular glucose and lipid metabolism and ATP synthesis through the phosphorylation of serine/threonine residues (15-17). AMPK is activated by metabolic signals (or stressors) that deplete or accelerate ATP consumption. After activation, AMPK inhibits anabolic, ATP-consuming pathways like fatty acid and triglyceride synthesis and increases catabolic, ATP-generating pathways, specifically, mitochondrial fatty acid oxidation. This regulatory control of global metabolism is governed, in part, by AMPK directly phosphorylating LXRα, SREBP1c, and the PGC1α/ERRα axis (18-20).
The root of Lithospermum erythrorhizon Sieb. et Zucc. (common name: gromwell root) has an extensive traditional history in Asia and Europe as a medicinal agent for various skin conditions and injuries. Naphthoquinones, like shikonin, are the major phytochemical components in gromwell root (21). Shikonin has been reported to have numerous pharmacological properties, such as acting as an anti-inflammatory and anticancer agent (22, 23). Recently, naphthoquinones found in gromwell root have been reported to modulate lipid and glucose metabolism in mice with diet-induced obesity (DIO), which was associated with reduced expression of lipogenesis genes (24, 25). Shikonin reduced plasma glucose levels in a diabetic rat model and increased glucose uptake and oxygen consumption in differentiated L6 myotubes (26). Therefore, the objective of this study was to identify the specific molecular mechanisms involved in modulating hepatic lipogenesis and mitochondria biogenesis signals by L erythrorhizon (gromwell) root extract.
Methods
Materials and reagents
Supercritical carbon dioxide (CO2) extraction of gromwell root was performed by Flavex Naturextrakte GmbH (Rehlingen, Germany). Shikonin, G418, bovine serum albumin (BSA), docosahexaenoic acid, tris(hydroxymethyl)aminomethane (Tris), sodium chloride, EDTA, sodium fluoride, tetrasodium pyrophosphate, sodium orthovanadate, IGEPAL, glycerol, dimethyl sulfoxide (DMSO), Nile red, and phenylmethylsulfonyl fluoride (PMSF) were from Sigma Corporation (St Louis, Missouri). Tokyo Chemical Industry (Tokyo, Japan) provided α-methyl-n-butyrylshikonin (MBS), and acetylshikonin, hydroxyisovalerylshikonin, and β, β-dimethylacrylshikonin were purchased from Nacalai Tesque, Inc. (Kyoto, Japan). Hygromycin was from Calbiochem (Ann Arbor, Michigan). T0901317, dorsomorphin dihydrochloride (compound C), and A769662 were from Tocris (Minneapolis, Minnesota). Vectors pGL4.17 [luc2/Neo], pGL4.14 [luc2/Hygro], and pGL4.26 [luc2/minP/Hygro] and FuGENE 6 were purchased from Promega Inc. (Madison, Wisconsin). The plasmid containing the human SREBP1c promoter was purchased from Switchgear Inc. (Cat# S708922; Carlsbad, California). Restriction enzymes were from New England Biolabs (Ipswich, Massachusetts). Oligos and Pierce BCA protein assay kits were from Thermo Fisher Scientific (Waltham, Massachusetts). The following antibodies were sourced from Cell Signaling Technology Inc. (Danvers, Massachusetts): phospho-AMPKα (T172; Cat# 2535), AMPKα (Cat# 2793), α-Tubulin (Cat# 3873), mouse IgG (Cat# 7076), and rabbit IgG (Cat# 7074).
Plasmid construct
The SREBP1c promoter was removed from the Switchgear pLS by using KpnI and HindIII sites and subcloned into pGL4.17 [luc2/Neo]. One kilobase of the human PGC1α promoter was amplified via polymerase chain reaction (PCR). The primers used for the amplification had a KpnI site in the forward primer: AAAGGGGTACCCTGATCTGAGCAGAGCAGCA and a Xho I site in the reverse primer: AAAGGCTCGAGCCAGCCCCTTACTGAGAGTG. After confirming the amplification product sequence, the PGC1α promoter construct was subcloned into pGL4.14 [luc2/Hygro]. Synthetic oligos forward and reverse were synthesized with six repeats of the ERRα response element (TCAAGGTCA) with KpnI and HindIII at the 5' and 3' ends, respectively. The two complementary oligos were mixed, denatured by boiling, and then annealed by gradual cooling to room temperature. The double-stranded oligo was then subcloned into pGL4.26 [luc2/minP/Hygro] within the KpnI and HindIII sites.
Cell culture and stable cell lines
Human hepatoma (HepG2) cells, Chinese hamster ovary (CHO) cells, human pancreatic (PANC-1) cells, and human umbilical vein endothelial cells (HUVECs) were purchased from ATCC (Manassas, Virginia). All cell lines were cultured in media containing penicillin/streptomycin (100 U/100 µg/mL) and amphotericin B (250 µg/mL) (Fisher Scientific, Pittsburgh, Pennsylvania) and incubated at 37°C/5% CO2. HepG2 and PANC-1 cells were grown in DMEM containing either 25 mM or 5 mM glucose, respectively, and supplemented with 10% fetal bovine serum (FBS). CHO cells were grown in F-12K media, supplemented with 10% FBS. HUVECs were grown in F-12K media, supplemented with 10% FBS, 0.1 mg/mL heparin and 0.05 mg/mL endothelial cell growth supplement from ATCC (Manassas, Virginia).
A stable cell line for the human SREBP1c promoter assay was created by transfecting HepG2 cells with the pGL4.17 [luc2/Neo] SREBP1c promoter construct using FuGENE 6 according to the manufacturer's instructions, and monoclonal cell lines were selected by using G418 (1 mg/mL). Single monoclonal colonies were evaluated for responsiveness to a known activator (T0901317, 10 µM) and a known repressor of the SREBP1c promoter (docosahexaenoic acid, 250 µM).
Stable cell lines for the PGC1α promoter and the ERRα response element were created by transfecting CHO cells with pGL4.14 [luc2/Hygro] PGC1α promoter or pGL4.26 [luc2/minP/Hygro] ERRα response element constructs using FuGENE 6 according to the manufacturer's instructions, and monoclonal cell lines were selected by using hygromycin (500 μg/mL). Single monoclonal colonies were evaluated for responsiveness to resveratrol (20 μM), a known activator of the PGC1α promoter and ERRα response element.
Luciferase reporter assays
Stably transfected cells were plated in white-walled, clear-bottom, 96-well plates and incubated overnight in cell line-specific media. The media were then replaced with serum free media and incubated with gromwell root extract or naphthoquinones for 18 hours. All treatments were dissolved in 100% DMSO, with final treatments and controls (vehicle control) containing 0.1% DMSO. Luciferase activity was quantified with a luciferase assay kit (Biotium, Inc., Hayward, California) by using a M5 microplate reader (Molecular Device Co., Sunnyvale, California.
RNA extraction and quantitative reverse transcription PCR
HepG2 cells were seeded at 4 × 10⁵ cells/well in 12-well culture plates and grown for 24 hours. HUVECs were seeded at 8 × 10⁵ in six-well plates and allowed to grow overnight. The media were then replaced with media without serum and incubated with gromwell root extract or naphthoquinones for 18 hours. All treatments were dissolved in 100% DMSO, with final treatments and controls (vehicle control) containing 0.1% DMSO. Following treatment, cells were rinsed with Dulbecco's phosphate-buffered saline (PBS) (Lonza, Walkerville, Maryland), and total RNA was isolated with an RNA isolation kit from Qiagen (Germantown, Maryland). Total RNA was quantified by using the A260 value, diluted to 1 µg per reaction and reverse transcribed using the iScript cDNA synthesis kit (Bio-Rad, Hercules, California). The quantitative PCR (qPCR) reactions were conducted by using primers for SREBP1c (Thermo Fisher Scientific), stearoyl coenzyme A desaturase 1 (SCD1), PGC1α, and hypoxanthine-guanine phosphoribosyltransferase 1 (Qiagen). Real-time qPCR reactions were completed by using SsoFast EvaGreen qPCR mix on a CFX96 real-time thermocycler (Bio-Rad), with reaction conditions as follows: 95°C for 30 seconds; 40 cycles of 58°C for 5 seconds; and 95°C for 5 seconds. Fluorescence was measured following the completion of each cycle. Fold change was calculated by using the 2−ΔΔCt method.
Nile red staining of neutral lipids
HepG2 cells were seeded at 5 × 10⁵ cells/well in 12-well culture plates and grown for 48 hours. Cells were then treated with gromwell root extract for 18 hours in serum free media. Gromwell root extract was dissolved in 100% DMSO, with final treatment and control (vehicle control) containing 0.1% DMSO. Following treatment, cells were rinsed in PBS twice and fixed with 4% paraformaldehyde for 10 minutes at room temperature. Cells were then rinsed in PBS twice and stained with 1 µg/mL Nile red for 30 minutes, rinsed twice in PBS, and collected by 0.25% trypsin addition. FACSCalibur flow cytometry and CellQuest Pro, version 6.0 (Becton Dickinson, Franklin Lakes, New Jersey) analysis were conducted to quantitate neutral lipid fluorescence intensity (excitation: 488 and emission: 564-606 nM).
AMPKα ELISA and Western blot
The PANC-1 cell line was used in the evaluation of AMPK activation (phosphorylated AMPKα). This cell line was chosen because we found it to be more responsive to metformin, an AMPK activator, than HepG2 cells (JF Rebhun, unpublished data 2017) and because PANC-1 cells have been used to study AMPK activation (27, 28). PANC-1 cells were seeded at 2 × 10⁵ cells/well in 24-well plates for enzyme-linked immunosorbent assay (ELISA) or at 1 × 10⁶ cells/well in 6-well plates for Western blot and allowed to grow for 24 hours. Media were replaced with DMEM without serum and incubated an additional 24 hours, then treated with gromwell root extract or its naphthoquinones for 4 hours. All treatments were dissolved in 100% DMSO, with final treatments and controls (vehicle control) containing 0.1% DMSO. For ELISA, cells were rinsed twice with ice-cold PBS and lysed with 80 µL of the recommended lysis buffer for phospho-AMPK1α (T183) quantitation, per the manufacturer's instructions (RnD Systems, Minneapolis, Minnesota, Cat#. DYC3528). For Western blot analysis, cells were rinsed twice with ice-cold Dulbecco's PBS and lysed with 250 µL of lysis buffer (10 mM Tris, 100 mM sodium chloride, 1 mM EDTA, 1 mM sodium fluoride, 20 mM tetrasodium pyrophosphate, 2 mM sodium orthovanadate, 1% IGEPAL, 10% glycerol, and 1 mM PMSF at pH 7.5). Lysates were cleared with a 3-minute, 13,000g spin. Proteins were denatured by sample buffer and 40 µg was loaded per lane and separated via sodium dodecyl sulfate polyacrylamide gel electrophoresis (SDS-PAGE). Proteins were transferred to polyvinylidene fluoride membrane and probed with anti-phospho-AMPKα, AMPKα, and α-Tubulin. Horseradish peroxidase-linked secondary antibodies were used with Clarity Western ECL reagents (Bio-Rad) to visualize proteins.
Cellular viability (water-soluble tetrazolium salt-1 assay)
HepG2 cells were seeded at 3.5 × 10⁴ cells/well in 96-well, flat-bottom transparent plates and grown for 24 hours. The media were replaced with media without serum and incubated with gromwell root extract (5, 10, and 20 µg/mL), shikonin (1, 10, and 20 µM), or MBS (10, 20, and 50 µM), followed by 18 hours of incubation. All treatments were dissolved in 100% DMSO, with final treatments and controls (vehicle control) containing 0.1% DMSO. Following treatment, 10 μL of 10 × water-soluble tetrazolium salt-1 reagent (4-[3-(4-iodophenyl)-2-(4-nitrophenyl)-2H-5-tetrazolio]-1,3-benzene disulfonate) (Roche, Mannheim, Germany) was added and incubated for 4 hours, and absorbance was read at 450 nm and 650 nm on a M5 microplate reader (Molecular Device Co.).
Statistical analyses
Quantitative data are presented as means ± SEM. Comparisons between groups were made using one-way analysis of variance (ANOVA) with Tukey's, Dunnett's, or Fisher's least significant difference multiple comparisons test with GraphPad Prism version 6.00 for Windows (GraphPad Software, La Jolla, California). A significant effect was defined as P < 0.05.
Results
Repression of high glucose-induced SREBP1c promoter activity and gene expression and lipogenesis
We first examined the effect of 5 mM versus 25 mM glucose on basal SREBP1c promoter activity and found that 25 mM glucose media increased activity by 41 ± 0.02%; therefore, we used 25 mM glucose for SREBP1c induction experiments. Figure 1 shows the effect of the gromwell root extract and its naphthoquinones on SREBP1c promoter activity. Gromwell root extract, shikonin, and MBS significantly repressed SREBP1c promoter activity in a dose-dependent manner (Figure 1A-1C), whereas β, β-dimethylacrylshikonin, β-hydroxyisovalerylshikonin, and acetylshikonin had minimal to no effect at 50 µM (data not shown). AMPK activation with A769662 significantly repressed promoter activity (Figure 1A). Interestingly, naphthoquinone abundance in the gromwell root extract did not correlate with potency; shikonin was 0.93% of the gromwell root extract, yet it was the most potent, whereas acetylshikonin was 9.2% and had no activity (Supporting Information Figure S1). Cell viability after treatment with gromwell root extract, shikonin, and MBS was ≥ 87% of control at all doses tested (data not shown). Based on potency, only shikonin and MBS naphthoquinones were further evaluated.
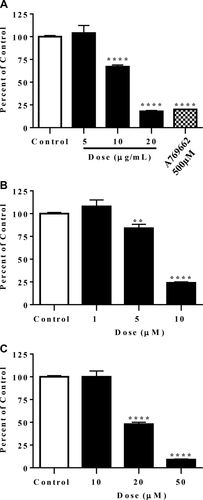
Gromwell root extract, shikonin, and MBS repressed SREBP1c promoter induction in HepG2 cells. Cells stably transfected with a luciferase reporter vector under the control of the full-length human SREBP1c promoter were treated for 18 hours, followed by quantification of luciferase activity. (A) Gromwell root extract and A769662 (500 µM). (B) Shikonin. (C) MBS. Data are means ± SEM from six independent experiments run in triplicate. **P < 0.01, ****P < 0.001 compared to control using one-way ANOVA with Dunnett's multiple comparisons test.
Repression of SREBP1c promoter activity by gromwell root extract, shikonin, and MBS was verified by a significant decrease in SREBP1c gene expression and a target gene, SCD1 (Figure 2A-2C). Repression of SCD1 paralleled that of SREBP1c, and the effects were near maximal at the lowest efficacious dose observed in the promoter assay.
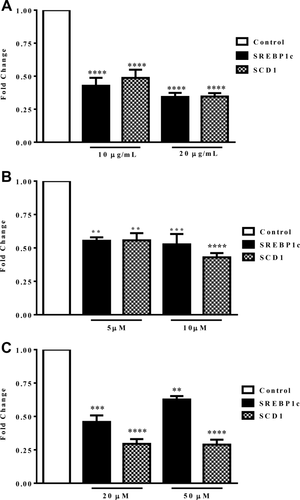
Effect of (A) gromwell root extract, (B) shikonin, and (C) MBS on SREBP1c and SCD1 gene expression. HepG2 cells were treated for 18 hours, followed by qPCR. Data are expressed as means ± SEM fold change from three independent experiments run in duplicate. **P < 0.01, ***P < 0.001, ****P < 0.001 compared to control using one-way ANOVA with Dunnett's multiple comparisons test.
Hepatic lipogenesis was examined in HepG2 cells with Nile red staining and fluorescence intensity measured by flow cytometry. Figure 3 illustrates that gromwell root extract significantly and dose-dependently reduced lipogenesis in HepG2 cells.
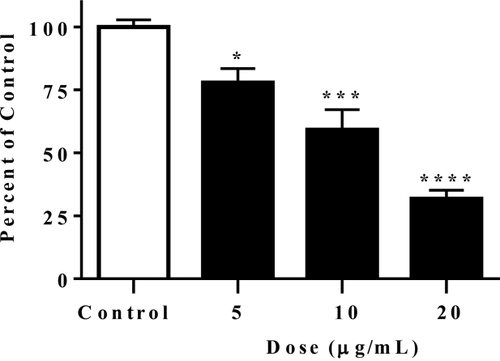
Gromwell root extract reduced lipogenesis in HepG2 cells. Cells were treated for 18 hours, then stained with 1 µg/mL Nile red for 30 minutes, followed by flow cytometry analysis of fluorescence. Data are means ± SEM from four independent experiments. *P < 0.05, ***P < 0.001, ****P < 0.0001 compared to control using one-way ANOVA with Dunnett's multiple comparisons test.
Inhibition of LXRα-induced SREBP1c promoter activity
We next examined whether gromwell root extract, shikonin, and MBS could inhibit LXRα agonist-induced SREBP1c promoter activity. HepG2 cells were cotreated with T0901317 (10 µM) and gromwell root extract, shikonin, or MBS. T0901317 increased SREBP1c promoter activity by 225 ± 10%, and gromwell root extract and its naphthoquinones significantly and dose-dependently inhibited the induction by T0901317 (Figure 4A-4C). AMPK activation with A769662 also effectively blocked T0901317 induction of SREBP1c promoter (Figure 4D).
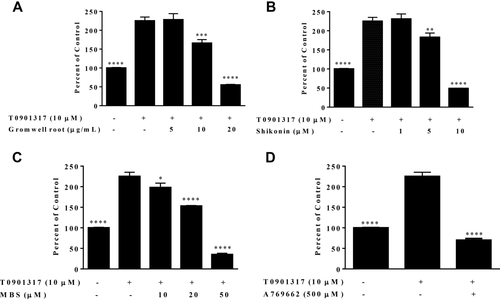
(A) Gromwell root extract, (B) shikonin, (C) MBS, and (D) A769662 block LXRα agonist (T0901317) induced SREBP1c promoter activity in HepG2 cells. Cells stably transfected with a luciferase reporter vector under the control of the full-length human SREBP1c promoter were cotreated with T0901317 (10 µM) for 18 hours, followed by quantification of luciferase activity. Data are means ± SEM from three independent experiments run in triplicate. *P < 0.05, **P < 0.01, ***P < 0.001, ****P < 0.0001 compared to T0901317 using one-way ANOVA with Dunnett's multiple comparisons test.
Gromwell root extract and its naphthoquinones increased phosphorylated AMPKα levels
Figure 5 illustrates that the gromwell root extract, shikonin, and MBS significantly increased phosphorylated AMPKα levels as measured by ELISA and Western blot. A direct AMPK activator, A769662, and metformin, an indirect activator (increases AMP/ATP ratio), increased AMPKα phosphorylation. Western blot analysis revealed that the increase in AMPKα phosphorylation resulted in a large upward shift in the phospho-AMPKα:AMPKα ratio (Figure 5B-5C). Gromwell root extract and shikonin had the largest ratio increase, followed by metformin, MBS, and A769662.
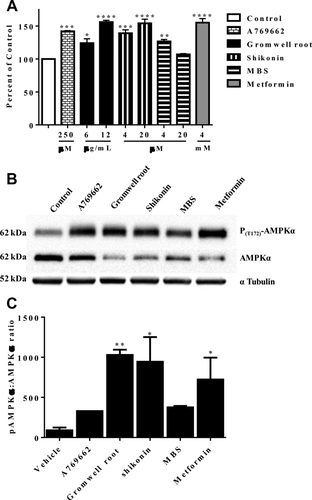
Gromwell root extract, shikonin, and MBS increased the phosphorylation of AMPKα. PANC-1 cells were treated with A769662, gromwell root extract, shikonin, MBS, and metformin for 4 hours. (A) AMPKα phosphorylation (T183) was quantitated by ELISA. Data are means ± SEM from two independent experiments run in duplicate. *P < 0.05, **P < 0.01, ***P < 0.001, ****P < 0.001 compared to control using one-way ANOVA with Dunnett's multiple comparisons test. (B) Phosphorylation of endogenous AMPKα (phospho-AMPKα) at T172 was determined by immunoblotting cell lysates with a phospho-specific antibody after treatment with A769662 (250 µM), gromwell root extract (20 µg/mL), shikonin (20 µM), MBS (20 µM), and metformin (4 mM). An anti-AMPKα antibody was used to evaluate levels of total AMPKα and an anti-α-tubulin antibody was used to confirm equal protein loading. (C) Densitometric analysis of the phospho-AMPKα:AMPKα ratio. Data are expressed as means ± SEM from two independent Western blot experiments. *P < 0.05, **P < 0.01 compared to control using one-way ANOVA with Fisher's least significant difference.
Gromwell root extract increased PGC1α promoter activity and gene expression and activated ERRα response element
To verify that AMPKα activation by gromwell led to activation of mitochondria biogenesis signals, we examined its effect on the PGC1α promoter and ERRα response element in reporter assays. Figure 6 illustrates that the PGC1α promoter and ERRα response element activity were significantly and dose-dependently increased by gromwell root extract. To confirm that the increased PGC1α promoter activity led to changes in gene expression, PGC1α mRNA levels were measured in HepG2 cells and in HUVECs (a frequently used model to study PGC1α gene expression and mitochondria biogenesis) (29-31). PGC1α gene expression was dose-dependently increased in both HepG2 cells (Figure 7A-7C) and HUVECs (Figure 7D-7 F), which mirrored the promoter activity data.
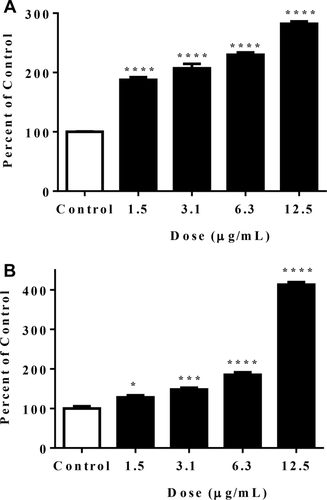
Gromwell root extract increased (A) PGC1α promoter and (B) ERRα response element activity. CHO cells stably transfected with a luciferase reporter vector, under the control of the full-length human PGC1α promoter or six repeats of the ERRα response element, were treated for 18 hours with gromwell root extract, followed by quantification of luciferase activity. Data are expressed as means ± SEM from three independent experiments run in triplicate. *P < 0.05, ***P < 0.001, ****P < 0.001 compared to control using one-way ANOVA with Dunnett's multiple comparisons test.
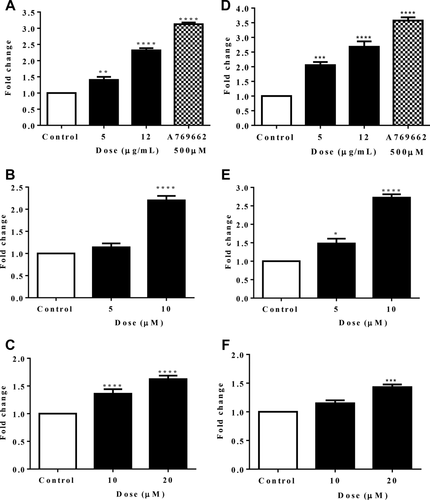
Gromwell root extract, shikonin, and MBS increased PGC1α gene expression in HepG2 cells and HUVECs. Both HepG2 cells and HUVECs were treated with gromwell root extract and naphthoquinones for 18 hours, followed by qPCR. HepG2 cells: (A) gromwell root extract and A769662 (500 µM), (B) shikonin, and (C) MBS. HUVECs: (D) gromwell root extract and A769662 (500 µM), (E) shikonin, and (F) MBS. Data are expressed as means ± SEM fold change from three independent experiments run in duplicate. *P < 0.05, **P < 0.01, ***P < 0.001, ****P < 0.001 compared to control using one-way ANOVA with Dunnett's multiple comparisons test.
Inhibition of AMPK blocked repression of SREBP1c promoter activity
To examine whether pharmacologically inhibiting AMPK would modulate the effects on SREBP1c promoter activity, compound C (CC) (1 µM) was cotreated with gromwell root extract, shikonin, and MBS. The repression of SREBP1c promoter activity was significantly blunted when cotreated with CC (Figure 8). CC alone had no effect on SREBP1c promoter activity (data not shown). These data indicated that the activation of AMPK was a significant driver in the repression of SREBP1c promoter activity.
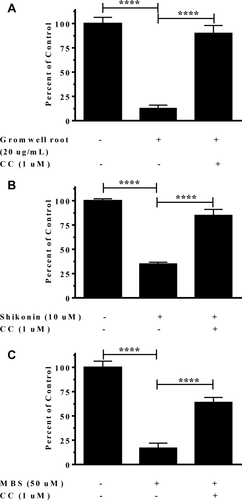
Repression of SREBP1c promoter induction with (A) gromwell root extract, (B) shikonin, and (C) MBS was blocked by inhibiting AMPK. HepG2 cells stably transfected with a luciferase reporter vector under the control of the full-length human SREBP1c promoter were cotreated with CC (1 µM) for 18 hours, followed by quantification of luciferase activity. Data are means ± SEM from three independent experiments run in triplicate. ****P < 0.0001 using one-way ANOVA with Tukey's multiple comparisons test.
Discussion
Gromwell (L erythrorhizon) root has been used in traditional medicines for thousands of years and was first recorded by the Greek physician and philosopher Hippocrates (fourth and fifth centuries BC) to treat skin ulcers (21). Shikonin has been the most studied naphthoquinone and has been reported to have anti-infection, anti-inflammatory, antioxidant, and anticancer benefits (23). We report for the first time that a CO2 extraction of gromwell root, and the naphthoquinones shikonin and MBS, repressed SREBP1c promoter activity and gene expression and lipogenesis in HepG2 cells under stimulated de novo lipogenesis conditions. Gromwell root extract, shikonin, and MBS increased AMPKα phosphorylation and mitochondria biogenesis signals, and the repression of SREBP1c promoter activity was blunted by AMPK inhibition. These data suggest that AMPKα phosphorylation is a mechanism of action.
AMPK and its regulatory control of metabolism, as well as its impact on assorted metabolic disorders, has attracted broad interest as a therapeutic target (32). Meta-analyses of metformin on cardiovascular and cancer risks have shown this naturally derived diabetic drug and AMPK activator significantly reduces these risks in populations with diabetes (33, 34). More recently, activators of AMPK and autophagy have been evaluated for the treatment of Parkinson and Alzheimer disease (35, 36). Li et al. reported that the AMPKα subunit physically binds to both the precursor and nuclear forms of SREBP1c (20), which would result in a reduction in SREBP1c promoter activity and gene expression, and its target genes. We show that gromwell root and its naphthoquinones increased the phosphorylated state of AMPKα with a reciprocal reduction in AMPKα, leading to a large increase in the phospho-AMPKα:AMPKα ratio. Gromwell and shikonin affected AMPKα in ways similar to those of metformin, possibly suggesting that similar mechanisms are involved in activating AMPKα, whereas MBS effects were similar to those of A769662. In addition, the activation of the PGC1α promoter and the ERRα response element further demonstrates that gromwell root extract and its naphthoquinones activate AMPKα, leading to repression in hepatic lipogenesis and stimulation of mitochondrial biogenesis signals.
The dose response repression in SREBP1c promoter activity was not fully reflected in the repression of SREBP1c and SCD1 gene expression, because the lowest effective dose on the promoter activity had the maximal effect on gene expression. There are likely additional regulating factors controlling the SREBP1c promoter activity, like modulation of high glucose (or glycolytic metabolites)-induced LXRα activity (or upstream targets). We found that gromwell root extract, shikonin, and MBS blocked T0901317-induced SREBP1c promoter activity. The LXRα blocking effect seemed to be dependent on the nutrient status of cells, because this effect was blocked or blunted under no glucose or 1 mM glucose conditions, respectively (RA Velliquette, unpublished data, 2016). This is likely because the window of AMPK activation is reduced under low nutrient status (i.e., high levels of phosphorylated AMPKα); therefore, the cells are in a state of energy generation and not storage. The phosphorylation of SREBP1c by AMPKα likely blocks any activation of SREBP1c and/or might directly phosphorylate LXRα or its DNA binding domain and dominate the repressive effect on the SREBP1c promoter (37).
These data mechanistically align with the in vivo reports that gromwell root naphthoquinones reduce body weight gain and metabolic dysfunction related to DIO (24, 25). In the study by Bettaieb et al., shikonin reduced body weight gain and metabolic dysfunction in the liver without changing energy intake (24), suggesting that the activation of catabolic and repression of anabolic pathways may be a fundamental mechanism. Gwon et al. reported that acetylshikonin from gromwell root prevented DIO by inhibiting adipogenesis (25). In 3T3-L1 cells, shikonin has been reported to inhibit differentiation into mature adipocytes (38) and stimulate glucose uptake (39). Recently, shikonin, β-hydroxyisovalerylshikonin, isobutyrylshikonin, and acetylshikonin have been reported to reduce triglyceride synthesis in mature 3T3-L1 adipocytes by increasing AMPK phosphorylation and precursor SREBP1c phosphorylation (40). Although reduced adipogenesis is also a valid and viable mechanism, we did not identify acetylshikonin or the other naphthoquinones tested (β, β-dimethylacrylshikonin, β-hydroxyisovalerylshikonin) as potent repressors of SREBP1c promoter activity in HepG2. This might suggest that structural specificity, cell type and media conditions, or potency contributed to the differences between our study and the 3T3-L1 in vitro studies. It is likely that there are multiple mechanisms involved in preventing the DIO or diabetic phenotypes with naphthoquinones, and AMPKα may play a key role in hepatic de novo lipogenesis and energy expenditure aspects.
Conclusion
Gromwell root extract, shikonin, and MBS repressed high glucose- and LXRα-induced hepatic SREBP1c by increasing the phosphorylated state of AMPKα, which led to a repression in hepatic de novo lipogenesis. AMPK targets involved in mitochondria biogenesis, PGC1α, and the ERRα response element were also stimulated. Gromwell root extract, shikonin, and MBS might be potential model botanical entities for the prevention and/or treatment of metabolic dysfunctions that occur with conditions of excess hepatic lipogenesis and repressed mitochondria capacity, such as hepatic steatosis, insulin resistance, diabetes, and obesity.
Acknowledgments
The authors thank Dr. Karl-Werner Quirin at Flavex Naturextrakte GmbH (Rehlingen, Germany) for providing the gromwell root extract and the high-performance liquid chromatography fingerprint of the naphthoquinones shown in Supporting Information Figure S1.


