Trout Responses to Stocking Rates and River Discharge within a Southeastern U.S. Hydropeaking Tailwater
Abstract
Freshwater fish populations often exist in systems characterized by novel ecological processes resulting from human alteration. Salmonid populations embedded within coldwater sections of warmwater rivers are spatially constrained by habitat availability. Tailwater fish contend with fluctuating river discharges and density-dependent processes associated with fish stocking and exploitation. Salmonid populations sustained through stocking versus natural reproduction may respond differently to changes in hydrologic patterns (e.g., hydropeaking) as well as declines in fish abundance. We assessed differences between stocked (Rainbow Trout Oncorhynchus mykiss) and naturalized (Brown Trout Salmo trutta) trout populations in Greers Ferry tailwater, Arkansas, regarding (1) spatial and temporal patterns of mean length, electrofishing catch rates, and relative condition following reduced number of stocked Rainbow Trout and (2) evidence that hydrologic characteristics and fish stocking intensity influenced relative condition. A 56% reduction in Rainbow Trout stocking did not result in systemwide change in mean length or relative abundance for Rainbow Trout or Brown Trout over the 16-year study period. Hydrologic variability, where river discharge spanned both reduced and elevated levels, positively influenced condition of both Rainbow Trout and Brown Trout. Assessment of survival of stocked Rainbow Trout may aid in further refining the timing and amount of stocking needed to sustain the population at a desired abundance. Further, assessing the influence of stocking fewer but perhaps larger (in terms of mean length) fish to meet management goals may be warranted. The persistent differences in relative abundance among river sections can inform management actions directed at Brown Trout, including harvest regulations. Such regulations may aid in reaching desired management goals, including abundance and mean length targets not observed after reduced stocking.
Human alteration of riverine environments necessitates that fisheries managers work in systems with novel and often bounded ecosystem processes (Moyle 2014). Tailwaters, defined here as the area below impoundments characterized by hydrologic and thermal processes not persistent under unaltered river conditions, are one example of novel ecosystems that are managed to meet human needs, including for electric power production and recreational fisheries. Competing needs among resource users (i.e., power producers and anglers) often exist within tailwater environments. Specifically, hydrologic and thermal regimes within tailwater environments may be bounded by dam operations for flood control and by power generation schedules. Operations resulting in consistent fluctuation in river discharge may hinder or assist fish populations based on life history characteristics (Mims and Olden 2012; Dibble et al. 2015). Fisheries that are established in tailwaters are often dependent on continued stockings to supplement limited or nonexistent recruitment. Responses of naturally recruiting and stocked fish to river discharge variation or stocking level may depend on density-dependent mechanisms specific to each system (e.g., availability of food resources to sustain stocked and wild fish). As such, fisheries managers require an understanding of population-specific characteristics and responses to system management (i.e., dam operations or stocking regimes) to predict population changes.
Rainbow Trout Oncorhynchus mykiss and Brown Trout Salmo trutta have been established within tailwater environments to provide recreational fisheries (Swink 1983). Such fisheries often serve as mitigation measures to compensate for reduced or eliminated native fish populations following dam construction. Tailwater fisheries can occur in areas with limited or nonexistent natural reproduction (Swink 1983) and may be outside the natural ranges of trout or other salmonid species (Fausch 2008). For instance, tailwater salmonid fisheries are prevalent in the Southeast, where main-stem river impoundments are in place to meet flood-control and regional electric power demand (Baker and Sammons 2021). In Arkansas, tailwater salmonid fisheries are maintained through extensive stocking, natural reproduction, and regulations (e.g., harvest regulations and special regulation areas; Flinders and Magoulick 2017; AGFC 2021). For example, the White River system in Arkansas has three main-stem impoundments and two impoundments in tributaries that support the largest salmonid fisheries in the state (Pender and Kwak 2002). Approximately 106,000 trout anglers participate in Arkansas salmonid fisheries each year (USFWS and USCB 2011). Forty-three percent were resident trout anglers, and 57% were nonresident trout anglers. All anglers together spent about US$496 million in 2011, and a recent phone survey suggested that trout anglers accounted for approximately $180 million of the total angler expenditures (Responsive Management 2016). Tailwater salmonid fisheries continue to provide substantial economic benefit to local and regional economies and necessitate informed management actions to maintain desired fishery characteristics (i.e., length structure, abundances, and distribution within tailwater environments).
Management of salmonid fisheries in some tailwaters is made difficult due to the availability and distribution of habitat, hydrologic variation within and among years, density-dependent mechanisms, and species interactions (Dibble et al. 2015; Korman et al. 2016; Yard et al. 2016; Korman et al. 2017). For instance, suitable habitat conditions may vary with distance downstream of a dam given transitions to warmwater environments. As such, fish populations may have a limited amount of physical habitat (e.g., suitable substrate) to carry out life history stages, including reproduction and recruitment. Variation in habitat may induce spatial structure to population characteristics along a tailwater that can necessitate management strategies that vary spatially (i.e., spatial differences in harvest strategies). River discharge patterns influence population demographics (McKinney et al. 2001; Dibble et al. 2015; Dreves et al. 2016). For instance, increased magnitude of annual river discharges may result in greater growth of Brown Trout (Dreves et al. 2016), but effects may be seasonal or life stage dependent and may not translate to other salmonid species (i.e., Rainbow Trout; Dibble et al. 2015; Dunnigan and Terrazas 2021). Food resources and metabolic conditions may be dependent on seasonal fluctuations in river discharge, and the density of conspecifics may limit growth (Krause et al. 2005; Johnson et al. 2006). Hasegawa (2016) suggested that interference competition between Rainbow Trout and Brown Trout existed among small size-classes (i.e., young of year) in stream enclosures, with Brown Trout possessing a competitive advantage over Rainbow Trout. Stocking is oftentimes used to continuously supplement or maintain salmonid populations in tailwaters. However, naturalized populations do occur and may coexist with a stocked population. Vincent (1987) observed increased numbers of wild salmonids following cessation of stocking catchable-size Rainbow Trout in the Madison River, Montana. Meyer et al. (2012), however, observed no negative influence of stocking catchable-size Rainbow Trout on wild Rainbow Trout population demographics in Idaho. Stocking practices must consider the potential interactions between stocked and naturalized populations.
System-level management of tailwater environments, including changes in stocking practices and hydrologic patterns, may manifest to population-level effects. Population responses to changing fish densities and hydrologic conditions may be species-specific and may differ among stocked and naturalized populations. Long-term evaluations of tailwater fisheries in southeastern U.S. tailwaters can provide understanding regarding how salmonid populations may respond to changes in stocking practices and river discharge stemming from angler desires and climate patterns (i.e., precipitation and flooding). This information can be used to improve population characteristics to meet management targets for specific tailwater fisheries. For example, the lower Saluda River trout fishery in North Carolina experienced improved growth of Rainbow Trout and Brown Trout and the presence of natural recruitment after dam operation changes for the Lake Murray Dam (Ahle and Bettinger 2020). The improvements to the populations reported after implementing recommended minimum flows for April–May (28.3 m3/s) and June–March (19.8 m3/s) subsequently prompted changes to the fishing regulations.
We assessed changes in length, relative abundance, and relative condition of two trout populations stemming from changes in stocking practices as well as river discharge patterns. We described and contrasted stocked Rainbow Trout and naturalized Brown Trout populations regarding (1) spatial and temporal patterns in total lengths and electrofishing catch rates and (2) the relationships of hydrologic characteristics and stocking intensity to relative condition. Predictions included that following a reduction in stocked numbers of Rainbow Trout, overall catch would decline and mean length would increase. We predicted that stocked Rainbow Trout relative condition would decrease during years with elevated river discharge, whereas naturalized Brown Trout relative condition would not exhibit a significant response given their life-long exposure to river discharge patterns.
METHODS
Study area
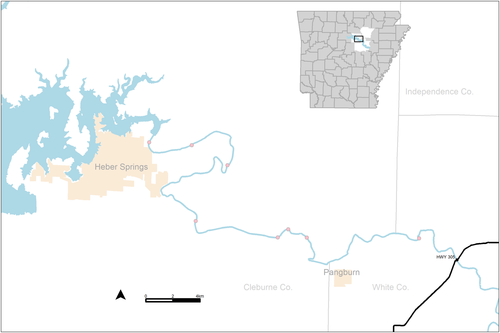
The Greers Ferry tailwater section of the Little Red River begins at Greers Ferry dam in north-central Arkansas (Cleburne County near Heber Springs, Arkansas) and extends approximately 48 km downstream (Figure 1). Hypolimnetic releases from Greers Ferry reservoir result in a mean water temperature of 8.4°C approximately 3 km from the dam, with increases in water temperature downstream (mean = 9.9°C approximately 7 km downstream of the dam; Johnson et al. 2006). Variation in river discharge is largely controlled through water releases for electric power production and flood control. Mean annual river discharge is 49 m3/s (SD = 17). The tailwater receives a minimum discharge of 0.57 m3/s established to maintain water temperatures below 20°C and maintain dissolved oxygen levels above 6 ppm within the system. Fluvial geomorphic features (i.e., riffle, run, pools) are prominent throughout the tailwater dependent on river discharge. The invertebrate community consists of amphipods, isopods, gastropods, Ephemeroptera, and Trichoptera (Johnson et al. 2006). The fish community is largely comprised of stocked Rainbow Trout (38% of catch) and naturalized Brown Trout (52% of catch; based on 2002 to 2019 catch data, Arkansas Game and Fish Commission [AGFC], unpublished data). Limited numbers of additional fishes are present in the tailwater, including species from the Centrarchidae and Percidae families. Dense stands of water milfoil Myriophyllum sp. are prevalent throughout the tailwater (Johnson et al. 2006).
Fish data collection
We obtained fish sampling data taken via annual sampling of the Greers Ferry tailwater by AGFC. Rainbow Trout and Brown Trout sampling occurred each October from 2002 to 2019 at eight river sections along the length of the Greers Ferry tailwater (Figure 1). River sections included areas known locally as JFK Park (farthest upstream), Beech Island, John's Pocket, Moss Dam, Gum Springs, Mossy Shoals, Rainbow Island, and Ramsey Access (farthest downstream; Figure 1). Nighttime electrofishing occurred with a single 6.1-m fiberglass boat equipped with a dual-anode array, a bow-mounted cathode dropper, flood lights, a Honda GX340 generator, and a 5.0 GPP control box (Smith-Root, Vancouver, Washington; high range and 100% power). The target amperage was ~2 A, but low water conductivities typically limited current to ~1 A. A single netter depressed a foot-pedal activation switch to initiate sampling. A minimum of three electrofishing runs of approximately 10 min each occurred in each river section each year. Sampling occurred during low-flow conditions with either no discharge or minimum discharge (i.e., 0.57 m3/s). A second boat and crew processed collected fish following each electrofishing run. Crews identified fish to species and measured (millimeters total length [TL]), weighed (g), and released all individuals upstream from the beginning of the sample.
Stocking and river discharge data collection
We obtained Rainbow Trout stocking data from AGFC. Stocking records indicated that Rainbow Trout were stocked annually throughout the Greers Ferry tailwater and stockings occurred throughout each year. The maximum number of catchable-sized (~254 mm TL) Rainbow Trout stocked during this study was 376,908 individuals (in 2002). The maximum number of fingerling (~75–100 mm TL) Rainbow Trout stocked during this study was 70,040 individuals (in 2011). The maximum number of yearling (~279 mm TL) Rainbow Trout stocked during this study was 34,245 individuals (in 2012). Stocking of catchable-sized Rainbow Trout occurred annually. However, fingerlings and yearling stockings occurred intermittently among years. Stocking intensity of catchable-sized Rainbow Trout was incrementally reduced beginning in 2006 amid concerns that overstocking possibly limited growth of Brown Trout. Mean stocking levels were 349,446 fish (SD = 19,314) from 2002 to 2006 (stocking level A), 260,747 fish (SD = 12,695) from 2007 to 2015 (stocking level B), and 154,384 fish (SD = 64,770) from 2016 to 2019 (stocking level C).
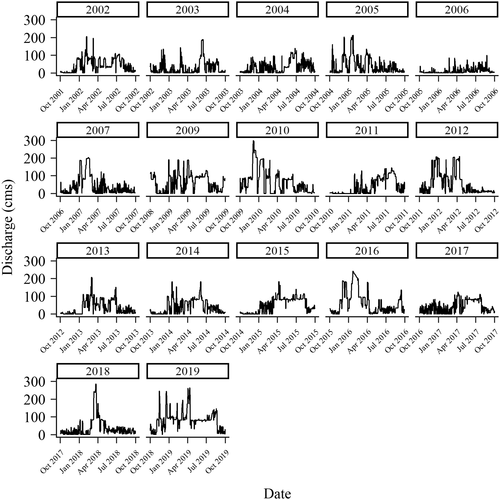
We obtained river discharge data for the Greers Ferry tailwater from gauging stations operated by the U.S. Army Corps of Engineers and U.S. Geological Survey located at the dam spillway and just below Greers Ferry Dam (~0.10 km; Figure 2). We obtained discharge estimates every hour from 2002 to 2019 to assess subdaily variation in discharge patterns (e.g., number and magnitude of hydropeaking events within a day; Zimmerman et al. 2010; Bevelhimer et al. 2015; Spurgeon et al. 2016). We organized discharge data based on water year (i.e., October 1 to September 30) to align fish sampling data in early October with river discharge patterns experienced by fish the prior 12 months. We calculated discharge variables describing the five components of a river's flow regime (i.e., duration, rate of change, magnitude, frequency, and timing) for each year (Table 1).
| Variable name | Scale | Variable description | Hypothesized influence |
|---|---|---|---|
| MA7 | D | Ratio of 20th percentile to 80th percentile of daily discharge for a year | Higher ratio (i.e., less variability in discharge) will result in more stable conditions and increase trout condition (Dibble et al. 2015). |
| FL1 | D | Low discharge pulse count (<25%) | Periods of disturbance (i.e., extreme low or high discharge) will decrease trout condition. |
| HL1 | D | High discharge pulse count (>75%) | Periods of disturbance (i.e., extreme low or high discharge) will decrease trout condition. |
| DL5 | D | Annual 90-d low discharge | Prolonged periods of low discharge will increase trout condition. |
| DH5 | D | Annual 90-d high discharge | Prolonged periods of high discharge will decrease trout condition. |
| CV | S | Coefficient of variation in discharge in 24-h period | Increased variation in discharge relative to average conditions in a 24-h period will decrease trout condition (Dibble et al. 2015). |
| Standard range | S | Range in daily discharge divided by 24-h mean discharge | Increased variation in discharge magnitude relative to average conditions in a 24-h period will decrease trout condition. |
| Base | S | The mean count of base discharge conditions, where base discharge is 0.57 m3/s | Increases in the number of periods of base discharge will result in increased trout condition. |
Statistical analysis
We assessed differences in mean length (mm TL) between sampled species, among stocking periods, and among river sections with generalized linear models. We used an information theoretic approach to assess the relative support among six candidate models using Akaike information criterion corrected for small sample size (AICc; Burnham and Anderson 2002). The six candidate models consisted of single- and multiple-variable models with species, river section, and stocking period, as well as interactions, used to describe changes in mean fish length.
We assessed relative abundance using catch per unit effort for Rainbow Trout and Brown Trout for each river section and year combination from 2002 to 2019. We used electrofishing time (in seconds) as the measure of effort. We divided the number of fish caught for each species by electrofishing time (i.e., the time that electricity was applied to the water) for each electrofishing run and river section combination. We standardized catch per unit effort as the number of fish caught per hour. We assessed differences in relative abundance between species, among stocking levels, and among river sections with generalized linear models. We assessed the relative support using AICc among six candidate models that were the same structure as those used to assess mean length data.
We assessed relative condition (Kn; Le Cren 1951) of individual Rainbow Trout and Brown Trout for each sample year (i.e., 2002 to 2019). We used length and weight data from 2002 to 2019 for each species to create the length–weight regressions and estimate population-specific standard weights. We used generalized linear mixed-effects models to assess relationships between annual estimates of fish condition and stocking levels, relative abundance, and hydrologic conditions. We used river section as the random effect, and all models were created with a random intercept for river section. We assessed the relative support among 21 candidate models using AICc (Burnham and Anderson 2002; Table 2). Candidate models were treated as hypotheses regarding how river discharge and stocking period influenced Rainbow Trout and Brown Trout condition. Models were constructed with and without the influence of species to assess whether Rainbow Trout and Brown Trout responses differed. We conducted all statistical analyses in Program R (R Core Team 2020; linear mixed-effects models constructed using lme4 package, Bates et al. 2015).
| Model | Model predictors |
|---|---|
| Model 1 | |
| Model 2 | |
| Model 3 | |
| Model 4 | |
| Model 5 | |
| Model 6 | |
| Model 7 | |
| Model 8 | |
| Model 9 | |
| Model 10 | |
| Model 11 | |
| Model 12 | |
| Model 13 | |
| Model 14 | |
| Model 15 | |
| Model 16 | |
| Model 17 | |
| Model 18 | |
| Model 19 | |
| Model 20 | |
| Model 21 |
RESULTS
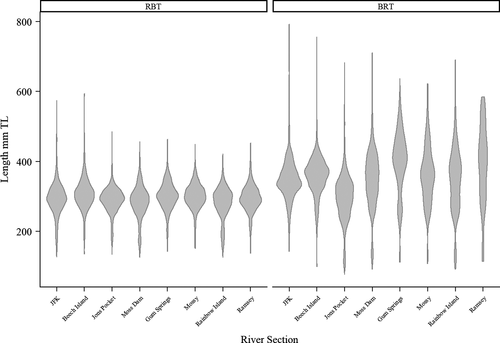
Total collections from 2002 to 2019 included 9,557 Rainbow Trout and 13,125 Brown Trout. Rainbow Trout were generally smaller in length compared with Brown Trout. Mean length of Rainbow Trout was 294 mm TL (SD = 45; minimum length = 126 mm TL; maximum length = 594 mm TL), while mean length of Brown Trout was 336 mm TL (SD = 79; minimum length = 77 mm TL; maximum length = 792 mm TL) irrespective of river section or stocking period. The distribution of lengths for Brown Trout was wider compared with Rainbow Trout among river sections (Figure 3). The most supported candidate model describing fish length included an interaction among species, river section, and stocking period (Table 3). Although generally larger than Rainbow Trout, Brown Trout length was more variable among river sections compared with Rainbow Trout (Figure 4). The Jon's Pocket river section exhibited the smallest sizes of Brown Trout along the tailwater. (Figure 4). There existed evidence of changes in fish length among stocking periods dependent on river section (Supplement 1 provided in the online version of this article). Rainbow Trout were longer (~35 mm TL) at JFK Park after reduced stocking level. Further, Brown Trout were longer at JFK Park (~28 mm TL) and Beech Island (~16 mm TL) after the initial reduced stocking level. Overall, differences in mean length among stocking periods were evident but did not show a monotonically increasing or decreasing trend anywhere in the tailwater (Figure 4).
| Model | K | AICc | ΔAICc | AICc wt | Cum wt | LL |
|---|---|---|---|---|---|---|
| Length | ||||||
| Species × section × stock_period | 49 | 239,249 | 0 | 1 | 1 | −119,575 |
| Species × section | 17 | 239,964 | 715 | 0 | 1 | −119,965 |
| Species × stock_period | 7 | 242,281 | 3,032 | 0 | 1 | −121,134 |
| Species | 3 | 242,512 | 3,263 | 0 | 1 | −121,253 |
| Section + stock_period | 11 | 243,578 | 4,329 | 0 | 1 | −121,778 |
| Stock_period | 4 | 244,530 | 5,281 | 0 | 1 | −122,261 |
| Catch | ||||||
| Species × section × stock_period | 49 | 2,868 | 0 | |||
| Species × section | 17 | 2,963 | 95 | 1 | 1 | −1,373 |
| Section + stock_period | 11 | 3,140 | 272 | 0 | 1 | −1,463 |
| Species × stock_period | 7 | 3,215 | 347 | 0 | 1 | −1,558 |
| Species | 3 | 3,218 | 350 | 0 | 1 | −1,600 |
| Stock_period | 4 | 3,222 | 354 | 0 | 1 | −1,607 |
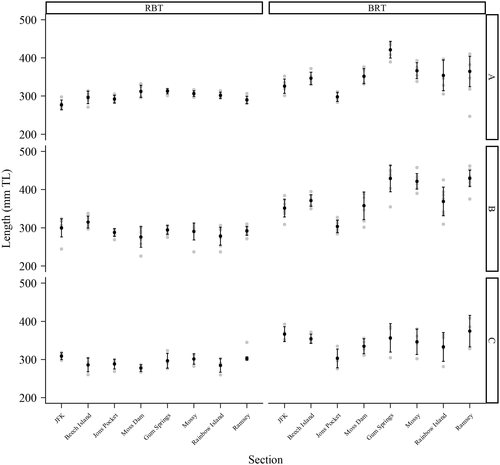
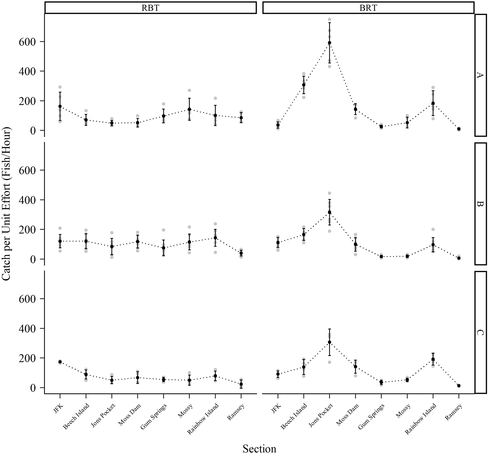
Mean relative abundance of Rainbow Trout was 94 fish/h (SD = 57; minimum relative abundance = 5 fish/h; maximum relative abundance = 292 fish/h), while mean relative abundance of Brown Trout was 126 fish/h (SD = 139; minimum relative abundance = 1 fish/h; maximum relative abundance = 750 fish/h). The most supported candidate model describing relative abundance included an interaction among species, river section, and stocking period (Table 4). Relative abundance of Brown Trout at Jon's Pocket was 399 fish/h (SD = 166) compared with 65 fish/h (SD = 42 fish/h) for Rainbow Trout irrespective of stocking period. In contrast, mean relative abundance of Brown Trout at JFK Park was 85 fish/h (SD = 42) compared with 146 fish/h (SD = 62) for Rainbow Trout irrespective of stocking period. There was not strong support given overlapping confidence intervals for a decline in relative abundance of Rainbow Trout or Brown Trout among river sections with declines in stocking level (Figure 5; Supplement 2 provided in the online version of this article). There was, however, some decline in relative abundance of Brown Trout at Jon's Pocket when comparing stocking period A with stocking periods B and C (Supplement 2 provided in the online version of this article).
| Model | K | AICc | ΔAICc | AICc wt | Cum wt | LL |
|---|---|---|---|---|---|---|
| Model 1 | 5 | −30,336 | 0 | 0.89 | 0.89 | 15,173 |
| Model 21 | 5 | −30,332 | 4 | 0.11 | 1 | 15,171 |
| Model 6 | 7 | −30,236 | 99 | 0 | 1 | 15,125 |
| Model 9 | 7 | −30,147 | 188 | 0 | 1 | 15,081 |
| Model 2 | 7 | −30,078 | 258 | 0 | 1 | 15,046 |
| Model 4 | 7 | −30,060 | 276 | 0 | 1 | 15,037 |
| Model 16 | 5 | −30,045 | 291 | 0 | 1 | 15,027 |
Mean relative condition varied across river sections and years for Rainbow Trout and Brown Trout. The mean relative condition of Rainbow Trout was least (mean = 0.87; SD = 0.18) in 2019 and greatest (mean = 1.06; SD = 0.15) in 2006. The mean relative condition of Brown Trout was least in 2019 (mean = 0.87; SD = 0.21) and greatest in 2004 (mean = 1.04; SD = 0.11), 2010 (mean = 1.04; SD = 0.13), and 2013 (mean = 1.04; SD = 0.10).
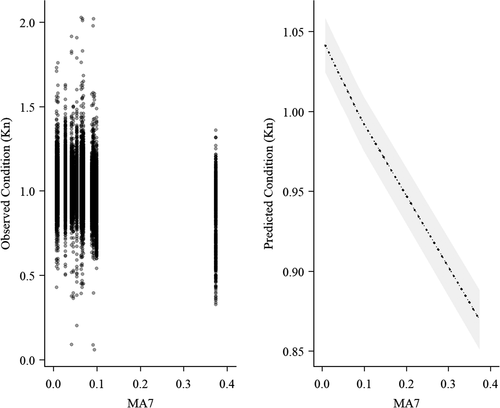
The top two models suggested that relative condition was influenced by the ratio of flow magnitudes (MA7, ratio of 20th percentile to 80th percentile of daily discharge for a year; Table 4). As the ratio of 20th percentile to 80th percentile discharges within a year increased (flow was less variable), relative condition decreased for both Rainbow Trout and Brown Trout (Figure 6). The relative condition for both trout species was least in 2019 when the 20th percentile discharge was 37.64 m3/s and the 80th percentile discharge was 99.81 m3/s. For Rainbow Trout, relative condition was greatest in 2006 when the 20th percentile discharge was 0.57 m3/s (at base flow) and the 80th percentile discharge was 20.89 m3/s. For Brown Trout, relative condition was greatest when the 20th percentile discharge was 3.54 m3/s and the 80th percentile discharge was 80.03 m3/s across 2004, 2010, and 2013.
DISCUSSION
Spatial and temporal patterns of length and relative abundance existed for Rainbow Trout and Brown Trout within the Greers Ferry tailwater. Such patterns likely reflected underlying demographic processes between a stocked and naturalized population as well as distribution of habitat. Consistent length distributions among river sections and through time for Rainbow Trout is indicative of a put-and-take fishery dependent on stocking catchable-size individuals (Pope and Willis 1994). Despite decreased stocking levels, a widespread increase in the length distribution of Rainbow Trout did not occur, likely resulting from a combination of harvest and environmental influences on survival and growth (Weiland and Hayward 1997; Dibble et al. 2015). In contrast to Rainbow Trout, the length distribution of Brown Trout was consistently wider and indicative of successful reproduction and recruitment and a combination of greater survival and continued growth of adults. Naturalized populations that are sustained through in situ reproduction and recruitment contain greater length distributions resulting from greater survival and growth to larger sizes compared with stocked populations (Bettinger and Bettoli 2002, 2004).
Relative abundances of Rainbow Trout and Brown Trout differed among river sections and, we speculate, may reflect distributions of habitat and movement behavior. There was consistent and elevated abundances of Brown Trout in river sections where habitat that facilitates reproduction and recruitment (e.g., clean gravel and cobble substrate in riffle and run areas) for Brown Trout existed (i.e., Jon's Pocket) compared with river sections where such habitat is limited (i.e., Ramsey Access). Resident Brown Trout moved little outside the spawning period in Beaver Dam tailwater along the White River in Arkansas (Quinn and Kwak 2011) and in the Clinch River in Tennessee (Bettinger and Bettoli 2004). Thus, the dependence on in situ habitat along the river for reproduction and recruitment and possible restricted movement patterns may partly drive the variation in Brown Trout relative abundances seen in Greers Ferry tailwater. In contrast, newly stocked Rainbow Trout have moved beyond stocking locations in tailwater environments (Bettinger and Bettoli 2002, 2004; Baker and Sammons 2021). Relative abundances were more consistent for Rainbow Trout compared with Brown Trout along Greers Ferry tailwater. As such, diffusion of some released individuals may be occurring following consistent stocking events. Reductions in relative abundances of Rainbow Trout in locations with greater relative abundances of Brown Trout suggested differences in habitat selection or competitive interactions (Gatz et al. 1987; Weber and Fausch 2003).
Reductions in Rainbow Trout stocking did not result in systemwide and persistent changes in relative abundance or changes in mean length for Rainbow Trout or Brown Trout over the 16-year study. The lack of support for systemwide responses may partially be due to the low persistence of stocked Rainbow Trout and the abundance of established Brown Trout. Low survival of stocked individuals due to harvest, environmental constraints (e.g., river discharge or food availability), or behavior have been suggested to limit long-term persistence of stocked Rainbow Trout (Bettinger and Bettoli 2002, 2004; O'Rouke 2014). Baker and Sammons (2021) suggested that 30% (out of 92 individuals) of stocked Rainbow Trout survived approximately 5 weeks poststocking. Further, Meyer et al. (2012) suggested that poor competitive ability of stocked Rainbow Trout was a factor with no discernable effect occurring on wild Rainbow Trout population-level metrics. As such, limited longevity of stocked Rainbow Trout and their potentially weak competitive ability may have reduced population-level responses for both species following reductions in Rainbow Trout stocking. Further, the abundance of Brown Trout in Greers Ferry tailwater may limit the efficacy of reduced stocking density of Rainbow Trout with the intent to increase trout growth in the system. The density of Brown Trout within Greers Ferry tailwater is perceived to be relatively high given the size of the system compared with other tailwaters within the state (e.g., similar catch rates compared with the White River system which is >100 mi in length; AGFC, unpublished data). As such, the baseline number of naturally produced trout within the system may limit food sources and habitat availability before Rainbow Trout stocking. Previous work suggested that the diet across multiple size-classes of Brown Trout in Greers Ferry tailwater was predominately isopods (Johnson et al. 2006; Johnson et al. 2007). The paucity of available forage fish in the system may have limited piscivory (Johnson et al. 2006). However, predation on smaller conspecifics and stocked trout of appropriate size likely occurred when available. The potential low persistence of stocked Rainbow Trout and the existence of an abundant naturalized population of Brown Trout may limit the effect size of reducing stocking intensity given the potential restricted food base within Greers Ferry tailwater.
Patterns associated with river discharge influenced condition of both Rainbow Trout and Brown Trout within the Greers Ferry tailwater. Measures of discharge variability, specifically the ratio of the 20th to 80th percentile discharges (i.e., MA7; Olden and Poff 2003), were associated with changes in condition. Our results suggested that condition decreased as MA7 increased from persistent elevated discharges within a year. Elevated discharges throughout the water year may create an energetically expensive environment given the demands placed on fish to hold position and the perceived paucity of available food items within Greers Ferry tailwater (Johnson et al. 2006). In contrast, elevated MA7 values also could occur with consistent low river discharges. The bounded nature of the hydrograph within the Greers Ferry tailwater (i.e., minimum and maximum discharge levels) may limit such consistent low-discharge periods, and such periods were not experienced during this study. Variation in discharge associated with hydropeaking is suggested to decrease system productivity (Cushman 1985). Models with variables associated with hydropeaking discharges were not as well supported within our model set. Hydropeaking flows may still result in a myriad of influences on the abiotic and biotic conditions within the Greers Ferry tailwater that would not have been captured solely assessing relative condition at an annual temporal scale. Regardless, hydrological conditions within tailwater fisheries do appear to elicit population-level responses for both stocked as well as naturalized populations.
The temporal and spatial patterns in mean length and relative abundance of Rainbow Trout and Brown Trout could be used to direct management strategies for each species. Multiple constraints on successful recruitment of stocked fish exist and managers of put-grow-take trout fisheries may consider the role of density dependence and food availability in limiting survival and growth of stocked populations (O'Rouke 2014; Flinders and Magoulick 2017). Implementing incremental changes in the number of Rainbow Trout stocked did not result in readily apparent changes in relative abundance or mean length in this study. Assessment of survival of stocked Rainbow Trout may aid in further refining the timing and amount of stocking needed to sustain the population at a desired abundance. Further, assessing the influence of stocking fewer but perhaps larger (in terms of mean length) Rainbow Trout to meet management goals may be warranted (Branigan et al. 2021). Spatial variation in abundance of Brown Trout could be used to direct harvest rates along the river as angling pressure has historically not been distributed evenly along the Greers Ferry tailwater (Bowman et al. 1994). Directing harvest at areas of elevated abundance may illicit changes in population characteristics through time (Carline et al. 1991) that were not achieved through reductions in stocking.
ACKNOWLEDGMENTS
The Nebraska Cooperative Fish and Wildlife Research Unit is jointly supported by a cooperative agreement among the U.S. Geological Survey, the Nebraska Game and Parks Commission, the University of Nebraska, the U.S. Fish and Wildlife Service, and the Wildlife Management Institute. Any use of trade, firm, or product names is for descriptive purposes only and does not imply endorsement by the U.S. Government. There is no conflict of interest declared in this article.


