Feasibility study of subject-specific, brain specific-absorption-rate maps retrieved from MRI data
Abstract
Introduction
Specific absorption rate (SAR) is crucial for monitoring radiofrequency power absorption during MRI. Although local SAR distribution is usually calculated through numerical simulations, they are impractical during exams, limiting real-time patient-specific SAR assessment. This study confirms the feasibility of deriving in vivo, subject-specific, image-based SAR and 10-g SAR maps directly from MRI data.
Methods
Complex B1+ maps were derived by combining a B1+ product (XFL) magnitude sequence with balanced steady-state free precession phase. Anatomical information and tissue masking were obtained from a T1 magnetization-prepared rapid gradient echo sequence. Electrical conductivity maps were generated from balanced steady-state free precession phase. Whole-brain SAR maps were created from MRI data acquired at 3 T using a 32-channel head coil on 2 healthy volunteers. A correction factor was applied to account for underestimation due to reliance on measurable B1+ data. Numerical simulations compared image-based SAR with simulation-based SAR distributions.
Results
A multi-slice image-based brain SAR map was obtained in 12 min (9-min acquisition, 3-min SAR reconstruction). In vitro experiments validated B1+ distribution and electrical conductivity values. Calculated electrical conductivities for in vitro and in vivo experiments were within reference ranges. Image-based SAR and 10-g SAR maps showed a distribution similar to simulation-based maps (r = 0.5) after correction.
Conclusions
This study shows the feasibility of inline, subject-specific SAR and 10-g SAR maps from standard brain clinical sequences. Image-based SAR maps can be a practical alternative during MRI exams when simulations are not feasible.
1 INTRODUCTION
The induced electric field (E-field) from the radiofrequency (RF) magnetic field (B1) deposits RF power into the tissues under examination, leading to a temperature increase that may potentially damage tissue.1 The specific absorption rate (SAR, W/kg) measures the RF power absorbed by the tissue. Monitoring SAR is mandatory to avoid tissue damage for all patients, especially for vulnerable patients such as pediatric, elderly, and patients with implants.
To prevent potential burns, clinical MRI scanners operate under the so-called normal operating mode SAR limits, which, for volume RF transmit coils, restrict the average whole-body SAR to be at most 2 W/kg and the average head SAR to be at most 3.2 W/kg for neurological examinations.2 To ensure scanning under these limits, MRI scanners monitor the SAR average of the region under examination and adjust the B1 peak for a given sequence, considering the RF calibration and the patient's height and weight.3 SAR is proportional to the electrical conductivity and the square of the local electric-field amplitude, which can create a deviation between the local area of examination (local SAR) and the SAR average. Field strength plays a role in the SAR distribution, given that RF inhomogeneity increases with field strength. The RF coil characteristics and configuration significantly affect the electromagnetic distribution, with multichannel transmit arrays presenting a more complex distribution than volume coils. The patient's build and posture, their position with respect to the RF coils, and the patient's tissue electrical properties (conductivity and permittivity) play a role in the local SAR distribution, as tissue heterogeneity and geometric complexity vary across the body. Thus, the average SAR value potentially overlooks regions within the patient, commonly known as hotspots, where the local SAR values could exceed safety limits, increasing the risk of burns.4, 5 Although the SAR safety standards2 provide local SAR limits for local coils, they do not account for volume coils, assuming that compliance with whole-body SAR limits ensures safety. Subject-specific local SAR assessments may offer more precise risk evaluations, reducing unnecessary safety margins and addressing the potential for local SAR hotspots even when whole-body SAR limits are met.
Numerical simulations are commonly used to estimate SAR and hotspots.6-11 Simulations enable the estimation of voxel-wise, high-resolution, electric-field, and SAR maps over extensive body coverage. Simulations require detailed RF body coil characteristics, loading, and tuning conditions, in addition to the creation of a three-dimensional (3D) model of the patient's body and the examined tissues' electrical properties values (conductivity and permittivity). The local SAR distribution for a given patient can be determined with voxel-level precision using simulations that utilize tools for automatic tissue segmentation and 3D model generation,12 whereas the tissues' electrical properties can be estimated based on values reported in the literature.13, 14 However, numerical simulations are often computationally intensive; computational time can range from tens of minutes to hours, depending on the model's mesh resolution, the number of discretization cells, the use of GPU acceleration, and the type of solver used (FEM, FDTD).15 Recent work has aimed to address these computational limitations. For instance, fast electromagnetic simulation tools using accelerated integral equation methods have been developed to enable more efficient SAR calculations.16 These approaches nevertheless require detailed knowledge of the RF coil characteristics, including coil design configuration and RF port locations—information that remains challenging to obtain. Alternatively, for parallel transmit systems, deep learning approaches at 7 T have emerged for rapid SAR estimation by predicting SAR from measured B1+ maps17—another potential approach for reducing computational demands. However, they still require extensive training data, are still being validated for clinical implementation, and face challenges in handling patient-specific variations in tissue properties and positioning. In addition, variations in tissue properties compared with the literature database can affect the SAR estimation, making local SAR assessment through simulations during an MRI exam impractical.
The limited information provided by the average SAR and the impracticality of performing numerical simulations during MRI scans mean that vulnerable patients often undergo MRI examinations without local SAR monitoring. Therefore, as per safety guidelines,18, 19 it is crucial to develop methods that allow the characterization of local SAR and hotspots during MRI exams using MRI data. The resulting maps must agree with those from numerical simulations, enabling the assessment of the patient's electrical properties and E-field distribution within clinically feasible timeframes. This process involves characterizing the distribution of the complex B1 field, which allows for the retrieval of both the E-field and the electrical properties within tissue.
The E-field can be estimated by applying an approximation of Ampere's law to the complex B1+ field.20 Although no MRI sequence can simultaneously estimate the magnitude and phase of the B1+ field, the field can be approximated by combining the magnitude retrieved from a B1+ mapping method21-24 with the phase from MR sequences with minimal B0 components.20 Although direct assessment of the B1+ field phase is not feasible, the transceive phase assumption suggests that, for circularly polarized fields, using a quadrature body coil for both transmission and reception with a polarization switch, or using a multichannel receiver coil with intensity non-uniformity correction,25 the phase of sequences without significant B0 components can be approximated as twice the B1+ phase.26 Examples of such sequences include fast spin echo and balanced steady-state free precession (bSSFP) sequences.27 Furthermore, tissue electrical properties can also be estimated using the B1+ field. Electrical properties tomography (EPT) is an emerging MR-based method that uses the magnitude and the phase of the B1+ field to estimate electrical permittivity and conductivity.26, 28 Direct methods like Helmholtz-EPT enable the rapid reconstruction of electrical conductivity.28
The use of the B1+ field to retrieve image-based SAR maps has been previously proposed.29-33 This work aims to investigate the feasibility of acquiring in vivo image–based SAR maps that are equivalent to simulation-based SAR maps in the brain and are suitable for clinical use within practical scan times. To achieve this, a sequence protocol and workflow are proposed to retrieve volumetric electrical conductivity, SAR, and SAR averaged over 10 g (10 g-SAR) within 12 min. The retrieved image–based SAR maps are then compared with simulation-based SAR maps.
2 METHODS
Data were acquired on a Siemens Skyra 3T scanner (Siemens Healthineers, Germany) with a 32-channel head receiver coil for both in vitro and in vivo experiments. Image-based SAR and 10-g SAR maps were acquired in vivo, and the distribution was compared with simulation-based SAR maps obtained through numerical simulations. In vitro comparison of image-based and simulation-based B1+ distribution was performed using a homogeneous spherical phantom, whereas electrical conductivity values were evaluated using a heterogeneous phantom with multiple saline concentrations.
2.1 MRI sequence protocol
All sequences implemented for electrical conductivity, B1+, and SAR maps are readily available for clinical use. A multislice two-dimensional (2D) B1 mapping product (XFL24) sequence was used for obtaining B1+ magnitude, and a multislice 2D bSSFP sequence was used for acquiring the B1+ phase. The bSSFP phase was acquired with the Surface Coil Intensity Correction filter (Prescan Normalize) to ensure that bSSFP phase corresponds to twice the transmit phase.25 A T1-weighted magnetization-prepared rapid gradient echo (MPRAGE) sequence was used to obtain anatomical information for tissue segmentation and create a virtual model for electromagnetic simulations. The total scan time was 9 min and 17 s. Sequence parameters are summarized in Table 1. To ensure correct voxel positioning for SAR analysis, all acquired images were interpolated to match the orientation and resolution of the 2D bSSFP sequence using a custom-made code (processing time = 28 s, Apple M3, 14 Cores, 4.05 GHz).
| Sequence | Repetition time (ms) | Flip angle (°) | Echo time (ms) | Voxel size (mm) | Image size | Scan time (min:s) | |
|---|---|---|---|---|---|---|---|
| Anatomical reference | MPRAGEa | 2300 | 9 | 2.94 | (1.2, 1.2, 1.2) | (192, 192, 208) | 4:06 |
| SAR analysis | bSSFP | 200 | 25 | 2.36 | (2.3, 2.3, 2.5) | (128, 128, 35) | 4:54 |
| XFL | 8190 | 8 | 1.97 | (4, 5) | (64, 64, 30) | 0:27 |
- Abbreviations: bSSFP, balanced steady-state free precession; MPRAGE, magnetization-prepared gradient echo; SAR, specific absorption rate; XFL, B1+ product.
- a MPRAGE and the XFL sequence were interpolated to match the bSSFP parameters.
2.2 Simulation-based SAR estimation
Simulation-based SAR maps were retrieved using electromagnetic simulations. A high-pass 3T (128 MHz) birdcage quadrature transmitter coil with characteristics similar to the scanner-embedded birdcage coil was used to characterize ground-truth simulation-based B1+ and SAR distributions using the Sim4Life finite difference time domain (FDTD) solver (Zurich MedTech, Switzerland). The coil consisted of a 16-leg body coil (diameter = 713 mm, height = 450 mm) with a cylindrical shield (diameter = 752 mm, height = 1500 mm). The coil conductors and shields were simulated as perfect electric conductors. The coil was tuned to the Larmor frequency using the ASTM phantom as a reference load. The coils were supplied via two ports spaced 90° apart in standard circular polarization mode. All simulation-based maps were interpolated to match the orientation and resolution of the 2D bSSFP sequence. All simulations were performed using only head models truncated at the neck.
2.3 Electrical conductivity based on EPT
Electrical conductivity was retrieved using a phase-based Helmholtz-EPT approach with EPTlib v0.4.034 applying a cuboid-shaped Savitzky–Golay filter of size (5) to the bSSFP phase. To anatomically adapt the filter, the T1 MPRAGE images were used as reference with a weight parameter of 0.05. Additionally, the EPTlib postprocessing filter was applied using the reference image and a cubic-shaped filter of size (10) with weight parameter of 0.1.
2.4 Image-based SAR estimation
Image-based SAR maps were calculated using the B1+ information retrieved from MRI. Figure 1 illustrates the workflow for estimating image-based SAR maps. First, the T1 MPRAGE was used for skull stripping and segmentation of white matter, gray matter, and cerebrospinal fluid (CSF) tissues using FSL.35-37 Second, electrical conductivity was obtained via a phase-based Helmholtz-EPT approach, and the mean values per segmented tissue were used to create a piecewise constant conductivity map to reduce noise artifacts. Third, the E-field was approximated according to Ampere's law computing the derivatives of B1+ with an anatomically adapted Savitzky–Golay filter with ellipsoid shape and filter size of (4) and using the mean EPT electrical conductivity map and the electrical permittivity map from literature.14 Finally, the image-based SAR map was calculated assuming a tissue density of 1000 kg/m3. A Gaussian filter (σ: 0.4) was applied to minimize overestimation due to noise propagation, followed by outlier removal. The Gaussian filter parameters were determined through empirical testing to reduce noise while preserving the SAR distribution features. The outlier removal threshold of mean + 9 standard deviations (SDs) was chosen based on statistical analysis to eliminate extreme artifacts while retaining legitimate high SAR values that could indicate actual hotspots. The code for SAR mapping is publicly available at https://github.com/DrJAMM/Image_Based_Subject_Specific_SAR. The total processing time was 3 min and 47 s (Windows virtual environment on Apple M3 processor, 4 CPUs, 4.05 GHz).
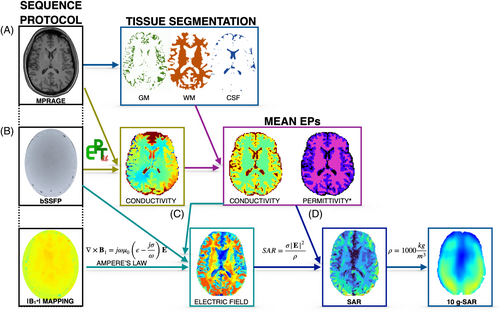
SAR maps calculated using only the B1+ component and excluding the B1− and B1z result in an underestimation; to correct for this, a tissue-specific correction factor was applied. This factor, which represents the ratio between SAR calculated with the complete E-field and SAR calculated with the E-field derived from B1+, was determined using an extensive set of anatomical models.33 For the image-based SAR maps, the correction factors were 3.08 for gray matter, 1.79 for white matter, and 2.59 for CSF.
2.5 10-g SAR estimation
Local heating within a small tissue volume can be estimated using 10-g SAR.38 To create these maps following the IEC 60601-2-33:2022 standard and ICNIRP Guidelines,2, 39 the image-based and simulation-based SAR maps were averaged over 10-g cubes, assuming a tissue density of 1000 kg/m3, and computed using a custom MATLAB program. When approaching the tissue–air boundary, the cube volume was adjusted to include only tissue until the necessary 10-g mass was achieved. Similarly to the image-based SAR maps, the underestimation observed in the image-based 10-g SAR maps was corrected using a 10-g SAR tissue-specific correction factor.33 The correction factors were calculated using the 10-g SAR derived from the whole E-field and the 10-g SAR derived from the E-field calculated using only B1+ in a data set of simulated cases involving different anatomies and electrical properties.33 The retrieved correction factors were 2.11 for gray matter, 2.06 for white matter, and 1.95 for CSF.
2.6 Data acquisition
2.6.1 In vitro phantom analysis
Before the SAR estimation, the image-based B1+ mapping information and phase-based Helmholtz-EPT electrical conductivity values were compared with reference values in two phantom experiments.
The magnitude of the image-based B1+ maps was compared with simulation-based B1+ maps using a homogeneous Siemens Spherical Phantom D165 (10496625).40 A spherical phantom with similar characteristics to the imaged phantom was modeled in Sim4Life with the electromagnetic properties of distilled water at room temperature (20°C) and a frequency of 128 MHz (electrical conductivity = 0.01 S/m, relative electrical permittivity = 80).
A six-compartment water-based phantom was constructed for electrical conductivity mapping analysis. Each compartment consisted of 50-mL conical vials filled with different concentrations of saline solution (NaCl) to achieve electrical conductivity values ranging from approximately 0.1 S/m to 0.7 S/m at room temperature (20°C).41, 42 The vials were arranged in a 1350-mL cylindrical container filled with distilled water. Image-based conductivity maps were compared with measurements using a dielectric assessment kit probe (DAK; SPEAG, Zürich, Switzerland) at room temperature (20°C) and a frequency of 128 MHz.
2.6.2 In silico analysis
To validate the proposed image-based SAR reconstruction method with a known ground truth, B1+ maps on the Duke virtual model were simulated and used for Helmholtz-EPT conductivity reconstruction and SAR estimation. The model's tissue voxel map provided white matter, gray matter, and CSF tissue segmentation and served as the anatomical filter in both EPT and SAR analyses. The reconstructed conductivity and B1+-based SAR maps were compared with the simulated SAR maps obtained with the full B1 field. For the in vivo generated models, the simulated B1+ field was used as an input to the image-based methodology pipeline to compare B1+-based SAR maps with the simulation-based SAR maps obtained with the full B1 vector.
2.6.3 In vivo analysis
Whole-brain coverage 2D images were acquired for 2 healthy volunteers (1 female, 34 years, 54 kg; and 1 male 45 years, 77 kg) with informed consent under protocol number 02–729 approved by COMIRB ethics board. The image-based SAR maps were obtained following the workflow summarized in Figure 1 and compared with simulation-based SAR maps. A subject-specific anatomical head model was generated using Sim4Life surface generation and automatic tissue segmentation from the T1 MPRAGE images (total model generation time = 18 min). For the simulation-based SAR maps, the tissues other than white matter, gray matter, and CSF were assigned the tissue properties of fat.
2.6.4 Data analysis
A mean absolute percentage error (MAPE) analysis was performed to compare the B1+ magnitude between the image-based and the simulation-based maps. The comparison was performed by dividing the maps into concentric regions (center, middle, outer) to assess spatial variations in agreement per slice. Correlation coefficients were also calculated. Both image-based and simulation-based SAR maps were normalized to their maximum values after Z-score outlier removal (values >9 SD from mean). This normalization was only for comparative analysis This approach avoids sensitivity to local variations while comparing SAR patterns. To compare the values obtained with the image-based method with those from the simulation-based method, mean and SD values were calculated for both in vitro and in vivo experiments. Furthermore, for the in vivo analysis, a Pearson correlation was performed to assess the correlation between image-based and simulation-based SAR and 10-g SAR value. A threshold of p < 0.05 was used to determine statistical significance.
3 RESULTS
3.1 In vitro phantom analysis
Figure 2A,B displays the B1+ magnitude and phase distribution plots for both the image-based and simulation-based methods applied to the spherical water phantom. Qualitative B1+ maps are also presented. The image-based maps show a broader spread of B1+ values compared with the simulation-based maps. This spread may be due to noise and artifacts in the image-based acquisition or due to limitations in the simulation, such as inaccuracies in the RF source's geometry, position, or supply. Despite this, the mean [SD] magnitude values were 0.63 [0.8] a.u. for the image-based method and 0.69 [0.3] a.u. for the simulation-based method, with a bias of +0.06 a.u. The mean [SD] phase values were 1.45 [0.13] rad for the image-based method and 1.52 [0.04] rad for the simulation-based method, with a bias of +0.07 rad.
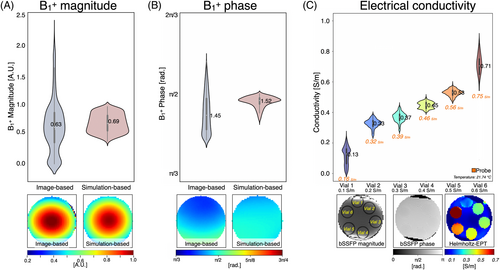
Figure 2 displays the distribution plot of the image-based electrical conductivity obtained using the phase-based Helmholtz-EPT approach for each vial, along with the labeled bSSFP magnitude and phase images. The mean reconstructed conductivity values showed good agreement with probe measurements. The measured values were Vial 1 = 0.13 [0.06] S/m (probe: 0.16 S/m), Vial 2 = 0.33 [0.07] S/m (probe: 0.32 S/m), Vial 3 = 0.37 [0.08] S/m (probe: 0.39 S/m), Vial 4 = 0.45 [0.09] S/m (probe: 0.46 S/m), Vial 5 = 0.53 [0.09] S/m (probe: 0.56 S/m), and Vial 6 = 0.71 [0.11] S/m (probe: 0.75 S/m). The differences between reconstructed and probe measurements remained below 0.04 S/m for all vials. The SDs ranged from [0.06–0.11] S/m across the measured range.
3.2 In silico analysis
Figure 3 shows single-slice reconstructed conductivity maps. The mean [SD] reconstructed electrical conductivity was 0.58 [0.11] S/m for gray matter, 0.36 [0.08] S/m for white matter, and 1.69 [0.45] S/m for CSF. In comparison, the database values were 0.59 S/m for gray matter, 0.34 S/m for white matter, and 2.14 S/m for CSF. The reconstructed values show close agreement with the database, although a slight underestimation is observed in CSF (1.69 S/m vs. 2.14 S/m).
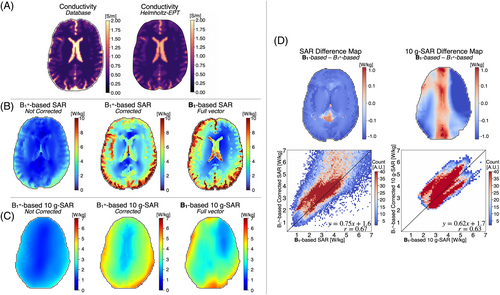
Figure 3 present the single-slice SAR and 10-g SAR maps reconstructed from the simulated B1+ maps, both before and after applying the correction factor, alongside the full vector B1-based SAR map. Figure 3 displays the difference map between the B1-based and corrected SAR and 10-g SAR maps, as well as a 2D heatmap. Overall, the B1+-based corrected SAR values were slightly underestimated compared with the B1-based SAR, particularly in the CSF region. Nonetheless, the correlation coefficient r = 0.67 and r = 0.63 between the B1+-corrected and the B1-based SAR and 10-g SAR, respectively, indicate a moderate positive linear relationship.
3.3 In vivo analysis
Figure 4 shows single-slice maps for the 2 volunteers, including image-based B1+ phase, image-based Helmholtz-EPT electrical conductivity, uncorrected and corrected image-based SAR, and simulation-based SAR. The mean [SD] values of Helmholtz-EPT electrical conductivity for gray matter were 0.89 [0.35] S/m (Volunteer 1) and 0.55 [0.22] S/m (Volunteer 2); for white matter, they were 0.49 [0.12] S/m (Volunteer 1) and 0.44 [0.16] S/m (Volunteer 2); and for CSF, they were 1.63 [0.89] S/m (Volunteer 1) and 1.67 [0.7] S/m (Volunteer 2). In contrast, the electrical conductivity values from the database are 0.59 S/m for gray matter, 0.34 S/m for white matter, and 2.14 S/M for CSF. Regarding the SAR maps, both the uncorrected and corrected image-based SAR maps align closely with the simulation-based SAR maps for both volunteers. Certain regions such as near the ventricles or the anterior portion of the brain differ from the simulation-based SAR maps, likely due to noise amplification, image artifacts, or inaccuracies in the E-field estimation process, where signal contamination across tissue boundaries can occur that may not be corrected despite the use of the anatomical filter.
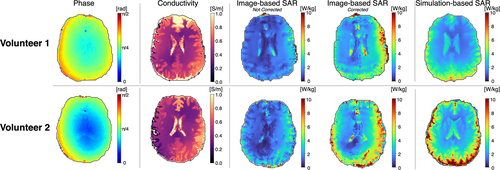
Figure 5 shows single-slice B1+ magnitude maps obtained from image-based and simulation-based methods for both volunteers, alongside 2D heatmaps comparing the two methods on a voxel-wise basis. Both volunteers exhibited the best agreement in central regions (Volunteer 1: MAPE = 3.04%, Volunteer 2: MAPE = 2.48%), with agreement gradually decreasing toward the outer regions (Volunteer 1: MAPE = 6.63%, Volunteer 2: MAPE = 5.16%). Volunteer 2 achieved better overall correlation (r = 0.836 vs. r = 0.618) and lower global MAPE (3.83% vs. 5.71%) compared with Volunteer 1, reflecting intersubject variability in B1+ mapping accuracy.
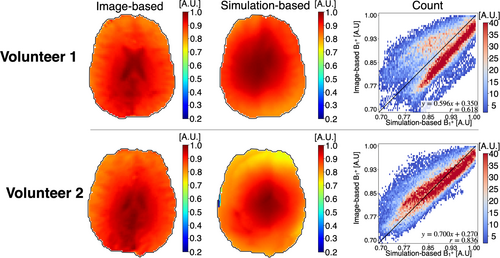
Figure 6 presents distribution plots for the image-based and simulation-based SAR. For both volunteers, corrected image-based SAR maps align more closely with the distribution of the simulation-based SAR maps than the uncorrected image-based SAR maps. Both the image-based and simulation-based SAR distributions are skewed to the right, indicating a nonnormal distribution. The skewness of the corrected image-based SAR is significantly higher compared with the simulation-based SAR for Volunteer 1 (4.3 vs. 1.0) and Volunteer 2 (2.1 vs. 1.2). Although this difference may be partially attributed to noise amplification during SAR computation, other factors such as B1+-field inhomogeneities and tissue interface effects could also contribute to the observed skewness. Nonetheless, the median [interquartile range] values for the corrected image-based and simulation-based SAR maps were similar, with 2.5 [1.9] W/kg and 2.6 [1.0] W/kg for Volunteer 1, and 2.3 [1.7] W/kg and 2.2 [1.5] W/kg for Volunteer 2, respectively. In contrast, the uncorrected image-based SAR maps had median [interquartile range] values of 1.2 [0.8] W/kg for Volunteer 1 and 1.1 [0.7] W/kg for Volunteer 2. Figure 6 features a 2D heatmap comparing the corrected SAR to the simulation-based SAR in a voxel-wise manner. Although image artifacts and noise affected the reconstruction of the image-based SAR, a Pearson correlation coefficient of r = 0.52 for Volunteer 1 and r = 0.50 for Volunteer 2 indicate a moderate positive correlation between the corrected image-based SAR and the simulation-based SAR, suggesting reasonable agreement between the two methods (p < 0.01).
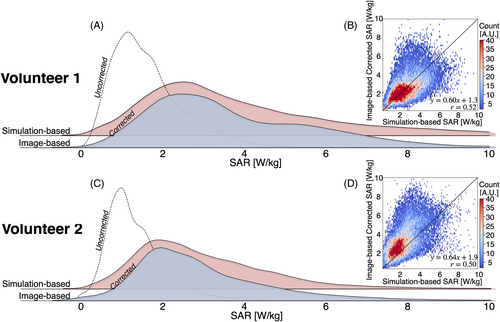
Figure 7 shows the 10-g SAR maps and their surface value projections in the center, back, right, and left views for the uncorrected and corrected image-based, as well as the simulation-based, SAR maps. For both volunteers, the corrected image-based maps demonstrate greater 10-g SAR values in the right and posterior regions of the brain. Similarly, the simulation-based maps also show high values in these regions, although the highest values were observed in the posterior part of the brain.
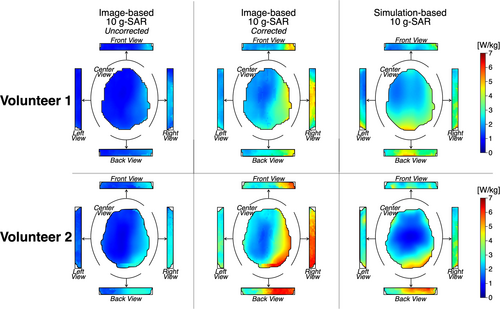
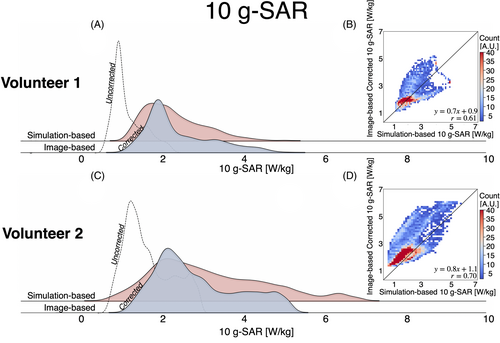
Figure 8 presents the 10-g SAR distribution plots for the image-based and simulation-based maps. Like the SAR maps, the corrected image-based 10-g SAR maps align more closely with the distribution of the simulation-based 10-g SAR maps than the uncorrected image-based 10-g SAR maps. The skewness of the corrected image-based 10-g SAR is 0.9, compared with 0.8 for the simulation-based SAR in Volunteer 1, and 0.97 and 0.90, respectively, in Volunteer 2. Nonetheless, the median [interquartile range] values for the corrected image-based and simulation-based 10-g SAR maps were similar (Volunteer 1: simulation-based = 2.1 [1.0] W/kg, image-based = 2.1 [1.1] W/kg; Volunteer 2: simulation-based = 2.1 [1.3] W/kg, image-based = 2.6 [1.6] W/kg). Figure 8 presents a 2D heatmap comparing voxel-wise the corrected 10-g SAR to the simulation-based 10-g SAR. Overall, the distributions showed a moderate correlation (r = 0.61 and r = 0.70). Although the 10-g SAR maps were strongly correlated in the 0–2-W/kg range, the correlation weakened for higher SAR values, suggesting a birdcage loading conditions discrepancy between the image-based and simulation-based SAR maps that affected the location of the 10-g SAR hotspot location. Nevertheless, both methods were significantly correlated (p < 0.05). For Volunteer 1, the peak 10-g SAR values were 5.22 W/kg (image-based) and 5.04 W/kg (simulation-based), whereas for Volunteer 2, the peak 10-g SAR values were 6.11 W/kg (image-based) and 6.15 W/kg (simulation-based).
The difference between SAR maps retrieved from the simulation-based and corrected image-based methods are shown in Figure 9. When comparing the simulation-based map to the image-based map, the image-based SAR method yielded lower SAR values in the lateral right region of the brain, and greater values were observed in the posterior lateral left region. The greatest discrepancy was observed around the ventricles. Figure 9 shows the difference comparison for the two methods for the 10-g SAR maps. A similar trend was observed to the SAR maps. Similar patterns were observed in SAR (Figure 9) and 10-g SAR (Figure 9) maps calculated using the simulated B1+ field as input. When comparing the simulation-based map to the image-based and B1+-based maps, lower values were observed in the lateral right region of the brain and greater values in the posterior lateral left region.
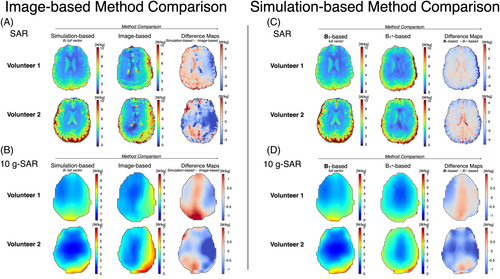
Table S1 summarizes the mean [SD] electrical conductivity and SAR values, as well as the range (min–max) for the 10-g SAR maps for gray matter, white matter, and CSF for the central slice. When comparing the corrected image-based values with simulation-based values, higher mean SAR values were observed for the simulation-based data. However, mean SAR values per tissue were not significantly different (p = 0.137).
4 DISCUSSION
This work demonstrates the feasibility of obtaining image-based, subject-specific SAR maps that present a similar distribution to simulation-based maps in the brain. Using only clinically available MR sequences, this method introduces a method for analyzing SAR distribution during MRI examinations. The image-based SAR maps are based on characterizing the B1+ distribution to retrieve the tissues' electrical conductivity and the E-field. Specifically, the B1+ magnitude is obtained via a custom B1+ sequence,24 and the B1+ phase is acquired with a 2D bSSFP sequence. The proposed image-based SAR maps were evaluated in vivo on 2 healthy volunteers at 3 T.
Numerical simulations provide high-resolution SAR mapping, but they require prior knowledge of the RF coil and the patient characteristics. Simulations are also time-consuming and computationally intensive, limiting their clinical practicality. Consequently, vulnerable patients often undergo MRI without real-time local SAR evaluation. The proposed image-based SAR method overcomes this by using only existing MRI sequences that characterize the B1+ field. A sequence protocol that acquires multislice B1+ magnitude and phase information in under 9 min was used. Multislice reconstruction of the electrical conductivity, E-field, SAR, and 10-g SAR maps took approximately 3 min, demonstrating the feasibility of inline, subject-specific SAR maps and evaluation during MRI examinations in 12 min.
The proposed method includes subject-specific electrical properties mapping rapidly derived using the Helmholtz-EPT method applied to the phase of the B1+ field with an anatomical filter to mitigate erroneous estimations at the boundaries. In this study, only the electrical conductivity was retrieved via EPT, whereas electrical permittivity was sourced from the literature. Current EPT methods allow accurate characterization of electrical conductivity, although retrieving electrical permittivity via EPT remains an active area of research.44 The reconstructed conductivity values using the six-compartment phantom validation differed from probe measurements by less than 0.04 S/m, providing reliability of the EPT-based conductivity mapping approach. Similarly, the retrieved electrical conductivity values in vivo were within range of the reference values.14, 41, 42
Several methods have also explored retrieving SAR maps from B1 fields.20, 29, 30, 45-47 To obtain a complete SAR distribution, knowledge of all components of the B1 field is necessary. However, because MRI can only characterize the B1+ distribution, neglecting the B1− and B1z components may lead to underestimation of SAR values.29 Previous work has suggested using a tissue-based correction factor to compensate for the SAR underestimation when using only B1+.33 The proposed correction factor was implemented by calculating the ratio of SAR maps derived from the whole E-field to those derived from the E-field using only B1+. In this study, the image-based SAR maps were corrected using this correction factor. The corrected image-based SAR maps showed a similar distribution to the simulation-based SAR maps. The greatest SAR differences were observed at the ventricles. Although slice profile imperfections in the XFL sequence using high flip angles may contribute to these differences,43 similar patterns were observed in silico in the present work with smaller flip angles. Boundary errors may also affect the conductivity reconstruction,48, 49 which can be mitigated using anatomical filters.50 In this work, the E-field calculation used two specialized filters: a standard preprocessing filter for smoothing, followed by an anatomical Savitzky–Golay filter that adapts to tissue boundaries for computing gradients. The standard preprocessing filter, which is not anatomically shaped, may induce cross-tissue contamination that may not be fully corrected by the subsequent anatomical filter. In regions with sharp transitions, such as the ventricles, these effects could potentially lead to inaccuracies in the E-field reconstruction and, therefore, in the estimated SAR.
This study also included an estimation of SAR averaged over a 10-g body volume as recommended by regulatory guidelines.2, 51, 52 Although averaged SAR is not directly linked to temperature increases,53 it helps predict worst-case scenarios and assess safety margins. Postprocessing filtering and data thresholding had a substantial effect on the 10-g SAR maps, reducing the number of voxels analyzed and potentially removing hotspots at the surface of the brain. Although this issue could be addressed by modifying the 10-g SAR reconstruction method, comparing different average SAR methods in the obtained maps is beyond the scope of this work. Nonetheless, the image-based 10-g SAR maps showed moderate correlation with the simulation-based 10-g SAR maps, and the maximum values observed in the 10-g SAR were consistent between the image-based and simulation-based methods.
Other SAR models that use MRI data have also been proposed.54 For instance, Gokyar et al. used a 3D neural network that input B1 and anatomical maps to derive SAR maps. Although the neural network-based reconstruction is faster than the imaged-based SAR method proposed here, it is also prone to errors that underestimate SAR in regions with expected high SAR values. Moreover, the neural network-based approach did not account for subject-specific electrical conductivity.
The subject-specific tissue distribution obtained through EPT remains important for identifying individual anatomical variations, such as tissue volumes and boundaries. This becomes especially relevant for patients whose tissue properties may deviate significantly from standard values due to medical conditions or age.8, 49, 55 Further analysis is necessary to determine how errors in EPT reconstruction affect the accuracy and reliability of SAR estimates.
The precise estimation of local SAR may not be critical for the general patient population at 1.5 T and 3 T. However, subject-specific SAR assessment could enable optimization of scanning protocols, potentially allowing higher image quality or reduced examination times while maintaining compliance with safety limits established by IEC 60601-2-33. Although numerical simulations are the preferred method for local SAR assessment, image-based SAR maps offer a viable method that can be readily applied in clinical settings for real-time decision making during MRI exams.
4.1 Limitations
This work has some limitations. First, the image-based SAR approach relied on a skull-stripping method, which excluded information from the skin and skull. This limits the evaluation to white matter, gray matter, and CSF. Future work is needed to determine whether this method can retrieve SAR information for these surrounding tissues, including a detailed comparison between image-based and simulation-based data for external tissues with accurate values.
Second, the proposed method relies on derivatives, which can significantly amplify the B1+/bSSFP image noise in certain regions. Although an anatomical image-based filter was used to mitigate noise, it reduced hotspot areas in the SAR and 10-g SAR maps. The remaining unfiltered noise caused some corrected areas to exhibit higher SAR values than the simulation, although the differences were not statistically significant. More effective filtering and denoising methods are needed to address this issue.
Third, the simulations used as ground truth in this study were based solely on a head model truncated at the neck, which may result in different loading conditions compared with models that include the shoulders or the entire torso.11 This truncation could affect the electromagnetic field distributions, as the absence of shoulders and torso alters the RF coil loading conditions. The different loadings might contribute to discrepancies between the simulation-based and image-based SAR maps. Additionally, the truncation creates artificial boundaries that affect the path of the induced currents, affecting the electromagnetic field distribution. Additionally, there is a frequency difference between the scanner's operating frequency (123 MHz) and the simulation frequency (128 MHz). Although simulations on a homogeneous cylindrical phantom confirmed minimal differences between these frequencies due to similar electromagnetic wavelengths, further investigation is needed to assess how image-based SAR maps differ from simulations under various loading conditions or to improve simulation accuracy by integrating the head model with a full-body model.11
Fourth and finally, the comparison between image-based SAR and simulation-based SAR assumed identical RF supply conditions, including geometry, position, and input ports. However, even minor variations in these parameters can significantly affect the B1+ field distribution. A more detailed evaluation of these input values is necessary for a more accurate comparison between image-based and simulation-based methods.
4.2 Future work
Future work will focus on (i) refining the protocol to retrieve volumetric magnitude and phase B1+ data with increased SNR and reduced profiling errors, (ii) reducing acquisition time, and (iii) improving filtering and denoising methods during data postprocessing. Further investigation will evaluate the relationship of the preprocessing along with the anatomical filters in the E-field computation when using only the B1+ component. Moreover, different methods will be explored to improve the underestimation for tissue boundaries with sharp transitions. An extended analysis will be conducted across various body types and sizes, assessing the feasibility of retrieving maps for patients with medical implants, and analyzing the maps on a wider range of field strengths. This work has primarily focused on MR safety at 3 T. The proposed method has potential applications for generating image-based SAR maps at higher field strengths, such as 7 T. Additionally, while the correction factors used herein effectively demonstrate the feasibility of image-based SAR mapping, alternative correction approaches will be investigated to optimize the balance between accuracy and computational efficiency. Finally, there is potential for applying the proposed image-based SAR method for application in MR-based RF ablation techniques and for optimizing sequence modifications to achieve subject-specific B1+ peak values.
5 CONCLUSION
This work demonstrates the feasibility of acquiring image-based, subject-specific SAR maps from clinically available sequences. The proposed approach acquires and estimates SAR maps in less than 12 min. Image-based SAR maps show a distribution like that of simulation-based SAR maps. Although numerical simulations remain the gold standard for local SAR assessment, when simulations are not feasible, image-based SAR maps provide a practical alternative that can be easily implemented in clinical practice for real-time decision making during MRI exams.
FUNDING INFORMATION
JAM would like to acknowledge support from NIST-PREP (Professional Research Experience Program), performed under the following financial assistance award 70NANB18H006 from U.S. Department of Commerce, National Institute of Standards and Technology. This paper has been developed based on the results obtained during the 18HLT05 QUIERO Project. This project has received funding from the EMPIR Programme, co-financed by the Participating States and from the European Union's Horizon 2020 Research and Innovation Programme.
CONFLICT OF INTEREST
Certain commercial equipment, instruments, software, or materials are identified in this paper in order to specify the experimental procedure adequately. Such identification is not intended to imply recommendation or endorsement by NIST, nor is it intended to imply that the materials or equipment identified are necessarily the best available for the purpose.
Open Research
DATA AVAILABILITY STATEMENT
The code used in this study was developed by the authors and is publicly available at: https://github.com/DrJAMM/Image_Based_Subject_Specific_SAR. The datasets generated and/or analyzed during the current study are available from the corresponding author on reasonable request.


