Exploring the need for a preload on the estimation of permeability, vessel radius, and relative cerebral blood volume in MR vascular fingerprinting–based dynamic susceptibility contrast perfusion imaging
Daniëlle van Dorth and Krishnapriya Venugopal contributed equally to this work.
Abstract
Purpose
Dynamic susceptibility contrast (DSC) MRI is commonly part of the clinical brain tumor imaging protocol. Usually, a preload of contrast agent is administered to minimize contrast-leakage T1 effects. However, recent studies have indicated that with adaptation of scan parameters (in particular, low flip angle), a preload is not required. For advanced approaches, like MR vascular fingerprinting (MRVF), which is based on combining gradient-echo and spin-echo readouts, excitation flip angles cannot easily be reduced, but postprocessing might alleviate leakage effects. In this study, the aim was to verify whether DSC-MRVF can be performed without preload.
Methods
A previously established simulation model was used to create a dictionary of DSC-MRVF signals resulting from a double-bolus injection with varying input values for permeability, vessel radius, and relative cerebral blood volume (rCBV). A sensitivity analysis based on a Cramer Rao Lower Bound approach was performed, from which the logarithmic ratio of standard deviations for parameter estimation was derived. A ratio above zero corresponded with a better determination without preload. Two brain tumor patients were included for validation.
Results
The results show that the standard deviation for determining permeability was lower without preload, whereas for determining rCBV, the opposite result was found. For vessel radius, the standard deviation was similar with and without preload. The in vivo data reasonably agreed with the simulation results.
Conclusion
This work has shown the potential of DSC-MRVF with a single bolus injection for determining vessel radius and permeability, although for rCBV, a preload is still advisable.
1 INTRODUCTION
Dynamic susceptibility contrast (DSC) MRI is used for a wide variety of clinical indications, such as stroke and brain tumor assessment. This MRI technique involves intravenous administration of contrast agent, which introduces changes in the MRI signal over time during the passage of contrast agent. This change in MRI signal can be measured with a gradient-echo (GRE; T2*-weighted) or spin-echo (SE; T2-weighted) sequence, which have a different sensitivity and specificity for particular vessel types.1 Whereas the GRE sequence is more sensitive over a broad range of vessel sizes, but mostly the macrovasculature, the SE sequence is less sensitive, although more specific for the microvasculature.1 The combination of both GRE and SE allows us to obtain information about the vascular architecture, which is exploited in vessel size imaging and has been investigated for brain tumor diagnosis and follow-up.2-4 This technique allows for combined measurement of cerebral blood volume (CBV), cerebral blood flow, and mean vessel size distribution without the need of longer scan times or additional contrast injection. More recently, a novel approach named MR vascular fingerprinting (MRVF) has been proposed. It uses a dictionary approach on multigradient and SE data for determining vascular properties.5 We subsequently extended MRVF to a dynamic approach using a hybrid echo-planar imaging (HEPI) sequence to measure dynamic changes in GRE and SE signals during the first passage of contrast agent.6 In our previous work, an adjusted simulation model from Pannetier et al.7 was used to create a dictionary of MR signals. The simulation was based on the signal evolution resulting from a preload of contrast agent followed by the actual bolus, as this agrees with standard clinical procedures in most institutes. However, recently this effort has been put into reducing the dose of contrast agent. For example, the study of Schmainda et al.8 demonstrated the feasibility of a single-bolus, low flip angle (FA), GRE-DSC-MRI protocol with good agreement with the traditional double-bolus DSC protocol. For DSC-MRVF, the effect of dosage reduction by avoiding a preload has not been demonstrated thus far. Moreover, reducing the FA in order to reduce T1 effects for MRVF with combined GRE and SE readouts is not feasible, although the postprocessing procedure is probably more resistant to leakage effects. Therefore, we aimed to perform a simulation study to compare the accuracy of DSC-MRVF with and without preload for determining the permeability, vessel radius, and relative CBV (rCBV).
2 METHODS
2.1 Setup of simulations
The DCE open-source simulation tool of Pannetier et al.,7 which is available on GitHub (https://github.com/NPann/MrVox2D), formed the basis of our experiments. The simulation model consisted of a single voxel that was represented by a two-dimensional (2D) volume of size 128 × 128. A certain fraction of the voxel, as defined by the rCBV, encompassed five blood vessels represented by infinitely long cylinders with radius R. The orientation of the vessel with respect to the main magnetic field was varied over the simulations, and the results were averaged. The amount of contrast agent that leaked out of the vessels into the surrounding extravascular space was defined by the permeability of the blood vessels. The surrounding extravascular space did not contain cells in the current simulation model. The supply of contrast agent was modeled by the arterial input function derived from Parker et al.9 with a peak concentration of 6 mM. The diffusion of contrast agent and water molecules was modeled by convolution of the magnetization distribution with a Gaussian kernel. For a small diffusion per timestep, minor changes were made to avoid discretization errors. The water molecules were allowed to diffuse freely throughout the 2D simulation space. The original simulation model7 was adapted for combined SE and GRE-DSC-MRI as acquired with the HEPI sequence.6 For this purpose, the sequence objects as played out on the scanner were entered into the simulation model, and the timings matched our in vivo scan protocol.6 This was done by deriving all the sequence objects from the plotter, which included not only the sequence timings (excitation time, repetition time, and echo times for GRE and SE) but also amplitudes of gradients and radiofrequency pulses and gradients, as well as the actual waveforms. In addition, some of the simulation parameters were changed with respect to the original settings of the simulation tool7: static magnetic field (B0) of 3 T, water diffusion coefficient of 1000 μm2 s−1, hematocrit value of 40%, oxygen saturation of 60%, and T1/T2 values of the vasculature of 1700/65 ms.10-12 The r1 and r2 relaxivities for Gadovist were defined as 5.0 and 7.1 s−1 mM−1.13 Using these input parameters, the magnetization distribution throughout the simulation volume was calculated for each timestep of 1 ms, from which the HEPI GRE and SE signals were derived.
2.2 Dictionary
A double contrast injection was simulated, in which the first bolus during which the signal was acquired could be seen as the preload for the second part of the acquisition (“second bolus”). The time between the two injections was 254 s. The DSC-MRI signals were created with varying input values for permeability (0–0.0060 s−1, total of 10 logarithmically spaced values), radius (5–139 μm, total of 25 logarithmically spaced values), and rCBV (0.5%–9.2%, total of 20 logarithmically spaced values). From these signals, two dictionaries were derived for the first and second bolus. In total, each dictionary consisted of 5000 atoms, where each of the atoms described the GRE and SE signal behavior for a unique combination of permeability, vessel radius, and rCBV.
2.3 Analysis of simulation data
The correlation between the time courses of every possible pair of atoms from the dictionary was calculated. Each atom consisted of both the GRE as well as SE signal time course, which were normalized to the baseline signal. To visualize the results, correlation plots were created, in which the correlation of a single atom (the central atom) with all the other atoms was studied. These correlation values were calculated for both the first and second bolus separately, to make a comparison between the first and second bolus. To allow for a more quantitative interpretation of the results, a sensitivity analysis was performed, which was based on the Cramer Rao Lower Bound (CRLB) approach.14, 15 The CRLB corresponds to the highest obtainable precision for a certain parameter and is often used for parameter estimation in MR experiments.16 In our analyses, the partial derivatives of the combined normalized GRE and SE signal with respect to the parameters (permeability, radius, rCBV) were computed by central differences in the dictionary. For each (non-border) atom in the dictionary, the Fisher inverse matrix was computed from these partial derivatives, the inversion of which could be used to obtain the variance of any unbiased estimator. Therefore, in the next step, the Fisher inverse matrix was inverted to obtain the CRLB-like matrix. From this matrix, the standard deviation for each of the parameters (permeability, radius, rCBV) was derived from the square root of the diagonal in the matrix. The results were visualized into multiple 2D plots summarizing the standard deviation for these parameters. In addition, the logarithmic difference of the standard deviation for the first and the second bolus was computed to assess the quantitative difference in standard deviation for determining the permeability, vessel radius, and rCBV.
2.4 In vivo experiments
This study was conducted with approval of the local institutional review board, and informed consent was obtained. Two adult patients with a glioma tumor were scanned on a 3T GE scanner. HEPI-DSC scans were acquired both during the first and second injection of 7.5 mL Gadovist, followed by a saline flush. The scan parameters for the HEPI sequence were as follows: echo time (GRE) = 17.2 ms, echo time (SE) = 70 ms, repetition time = 1500 ms, voxel size = 2.3 × 2.3 × 3 mm3, slice gap = 6 mm, and 15 slices. The DSC data were matched to the dictionary based on previous work,6, 17 with an additional weighting factor applied to account for the differences in signal-to-noise ratio between SE and GRE.
3 RESULTS
3.1 Dictionary
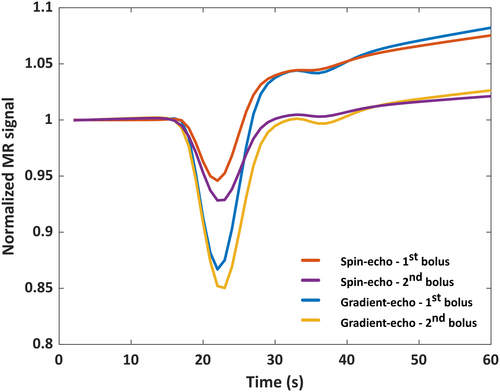
An example of the GRE and SE part for a single atom (permeability = 0.3*10−3 s−1, radius = 23 μm, and rCBV = 2%) of the normalized dictionaries is shown in Figure 1.
3.2 Analysis of simulation data
The correlation among all pairs of atoms gives a six-dimensional correlation volume for both the first and second bolus. In Figure 2 we plot different “slices” of this volume, where the correlation of the central atom (permeability = 0.8*10−3 s−1, radius = 23 μm and rCBV = 2%) with the other atoms is plotted. Note that lower correlation values imply a larger distance and hence an improved ability to distinguish these atoms. In Figure 2A,B, it can be seen that the correlation is lower and varies over the permeability values, whereas in Figure 2D,E, the correlation is quite homogenous and higher throughout the 2D plot. This implies that the atoms in the dictionary with different input values for the permeability could be better distinguished from the first bolus (i.e., without preload). On the other hand, for radius and rCBV, the correlation plots were less straightforward to interpret, because the results were overwhelmed by the effects of the permeability. However, from the correlation analysis we could conclude that there was only one local optimum (i.e., the further away from the central atom in each direction, the smaller the correlation values became). This means that the sensitivity analysis provides us with the (scaled) minimum variance of the unbiased estimator, because there is a unique unbiased estimator.
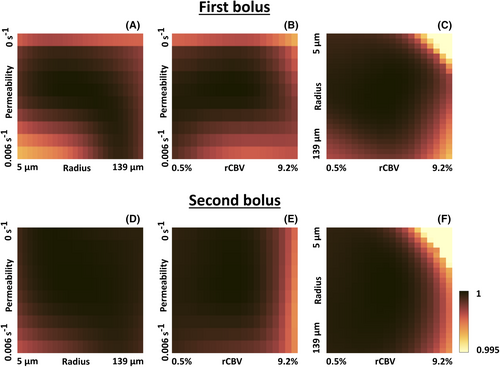
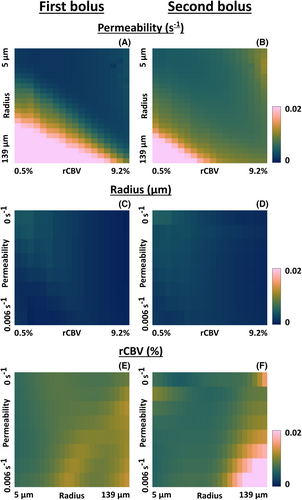
Figure 3 shows slices through the three-dimensional (scaled) CRLB volume of the different parameters. The analysis of the standard deviation confirmed the improved capacity to determine permeability using DSC-MRVF without preload (Figure 3A,B). Furthermore, the determination of the vessel radius was similar for the first and second bolus (Figure 3C,D). For the rCBV, the different atoms could be better distinguished using the second bolus signal curves (i.e. by DSC-MRVF with preload), as shown by the lower standard deviation in Figure 3F compared with Figure 3E, except for high permeability and vessel radius.
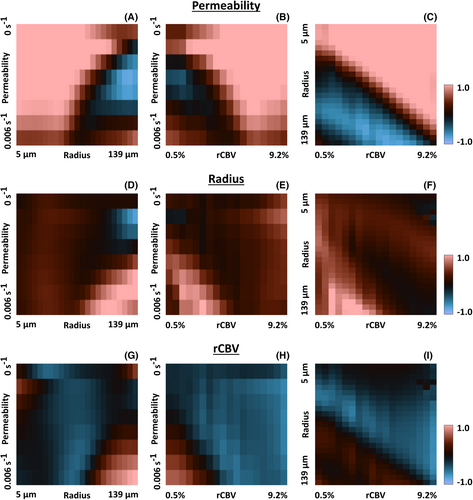
The standard deviation for the first and second bolus was compared by division. The logarithm was taken to ease the visualization (in this case, zero corresponds to an equal standard deviation for the first and second bolus). Figure 4A–C shows that when determining the permeability, most of the log ratios were above zero, meaning that the standard deviation was lower for the first compared with the second bolus. Only for large radii was there a higher standard deviation for the first bolus. When the vessel radius (Figure 4D–F) was the parameter of interest, the log ratio was close to or higher than zero for most atoms, which means that the standard deviation was slightly higher for the second bolus. For rCBV determination (Figure 4G–I), most log ratios were below zero, meaning the standard deviation was higher for the first bolus. This confirms the better determination of rCBV by including the preload for DSC-MRVF. However, for high radii, the standard deviation appeared higher for the second bolus.
3.3 In vivo analysis
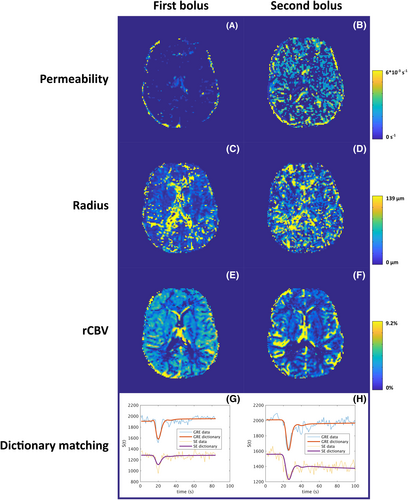
Example parametric maps for Patient 1 are shown in Figure 5 for both the first (A,C,E) and second (B,D,F) bolus. Figure 5G,H shows the in vivo data and the best match from the dictionary for a representative gray-matter voxel. For the permeability, slightly higher values were found throughout the brain for the second bolus. For radius, the values were similar, although the map seems less noisy for the first bolus. This agrees with the slightly higher standard deviation for determination of vessel radius from the second bolus in Figure 4D–F. For rCBV, the map derived from the second bolus displays more contrast compared with the first bolus, which agrees with the simulation results. The results for Patient 2 are shown in Figure S1.
3.4 Discussion and conclusion
This study aimed to compare the accuracy for DSC-MRVF with and without a preload of contrast agent. Because DSC experiments have proven to be possible without preload, it is also important for MRVF approaches to prove whether a preload is necessary. If a preload is necessary, this could be a hurdle for clinical adoption. The results based on simulations indicate the feasibility of using this technique without preload for determining permeability and vessel radius, whereas the rCBV could be determined more accurately when including a preload of contrast agent. The in vivo results appear to support the findings of the simulation study. However, for the permeability, more non-zero values are shown in the second bolus map, which could be explained by the limited amount of permeability values that were included in the dictionary. Moreover, the reduction in T1 effects for the second bolus makes the atoms with different permeability more difficult to distinguish. Overall, we did observe that those non-zero values were very close to zero.
For the permeability, these results are as expected, as a preload causes a DSC experiment to be less sensitive to leakage effects. However, by using DSC-MRVF, these effects are exploited to quantify the leakage during the dictionary-matching step. Importantly, the estimation of the mean vessel size was minimally affected by the absence of a preload. Not unexpectedly, for determination of the rCBV, a preload of contrast agent appears beneficial; however, for higher radii this was not the case. When looking closely at the dictionary atoms with high radii, we observe less T1 effects with increasing radii, which might be related to the field of view of the simulation voxel, which is adjusted based on the rCBV and vessel radius. Furthermore, we observe the expected lower sensitivity of SE to the high vessel radius, which might explain these findings. The previous study of Schmainda et al.8 reported reliable determination of rCBV by DSC-MRI (thus without the ability to measure vessel size or permeability) with a protocol that excluded a preload, by lowering the excitation FA to limit T1 effects and leakage correction to mitigate residual leakage effects. In addition, another study18 explored the possibility of a split-dose protocol, in which a single dose of contrast agent was divided over two injections (i.e., retaining a preload bolus). The study yielded accurate rCBV estimation for a variety of contrast dosage schemes, including the double-bolus protocol, the low-FA, single-dose protocol and split-dose protocols with one-fourth dose used for preload and three-fourths dose used for DSC or half dose used for preload and half dose used for DSC. However, the study of Semmineh et al.19 reported less robust rCBV estimations for the split-dose protocols compared with the single-dose, low-FA protocol. The advantage of MRVF for DSC-MRI is that this technique allows for leakage correction by including the vascular permeability into the simulations used for dictionary building. Therefore, the need for a low-FA or additional postprocessing including leakage correction is less obvious, although it is clear that for certain parts of parameter space, a preload would still be beneficial. Taking everything together, it appears that reducing the contrast agent dosage for DSC-MRVF is feasible albeit with a penalty on accuracy of rCBV. This is an important finding when considering clinical applications of DSC-MRVF.
This study has some limitations. First, this analysis assumes that our simulation model is accurate (i.e., that the model is a good representation of reality). As the simulations are based on a 2D model and assuming a homogenous extravascular space (i.e., no cells) with parallel vessels, this is clearly a simplification of reality. Furthermore, when the rCBV is changed, discrete voxels in the simulation grid become part of the vessels (i.e., a voxel is completely contained in the vessel). This discrete stepping is likely responsible for the “noise,” as observed in the rCBV direction, but this needs further confirmation. Another observation were some “unexpected” signal behaviors in the dictionary for small radii and large rCBV values, leading to “noise” in the top-right corner of Figure 4F,I. The cause of this behavior is unknown but could be due to simplifications of the DCE simulation in combination with unrealistic settings of these physiological parameters. In addition, the values of the standard deviation (square root of the diagonal in the CRLB plot) scale linearly with the noise level in the images, the value of which is set constant in all experiments but should be considered arbitrary (i.e., the CRLB values may be globally off by a scaling factor). Note that for our main comparison, looking at the ratio of the standard deviation for the first and second bolus, such scaling will be divided out of the reported measure; hence, the results of Figure 4 are not influenced by the noise level.
In conclusion, this work demonstrates the potential of performing DSC-MRVF without a preload (i.e., with only a single dose of contrast agent for determining vessel radius and permeability), although for rCBV this does not yet appear to provide equipoise. Future work will focus on a larger dictionary and include more patients with a glioma.
ACKNOWLEDGMENTS
This publication is part of the project “Vascular Signature Mapping of Brain Tumor Genotypes” (Project No. 17079) of the open technology research program of Applied and Engineering Sciences, which is (partly) financed by the Dutch Research Council (NOW) and the Medical Delta program “Cancer Diagnostics 3.0.”
FUNDING INFORMATION
Dutch Research Council (NWO); Project No. 17079.
CONFLICT OF INTEREST
Marion Smits received speaker fees (paid to the institution, no direct relation to the presented work) from GE Healthcare and AuntMinnie, and consultancy fees (paid to the institution, no direct relation to the presented work) from Bracco. Juan A. Hernandez Tamames receives research support from GE Healthcare. The group of Matthias van Osch receives research support from Philips in the form of access to the pulse programming environment and clinical science keys.


