Fluid suppression in amide proton transfer-weighted (APTw) CEST imaging: New theoretical insights and clinical benefits
Abstract
Purpose
Amide proton transfer-weighted (APTw) MRI at 3T provides a unique contrast for brain tumor imaging. However, APTw imaging suffers from hyperintensities in liquid compartments such as cystic or necrotic structures and provides a distorted APTw signal intensity. Recently, it has been shown that heuristically motivated fluid suppression can remove such artifacts and significantly improve the readability of APTw imaging.
Theory and Methods
In this work, we show that the fluid suppression can actually be understood by the known concept of spillover dilution, which itself can be derived from the Bloch-McConnell equations in comparison to the heuristic approach. Therefore, we derive a novel post-processing formula that efficiently removes fluid artifact, and explains previous approaches. We demonstrate the utility of this APTw assessment in silico, in vitro, and in vivo in brain tumor patients acquired at MR scanners from different vendors.
Results
Our results show a reduction of the CEST signals from fluid environments while keeping the APTw-CEST signal intensity almost unchanged for semi-solid tissue structures such as the contralateral normal appearing white matter. This further allows us to use the same color bar settings as for conventional APTw imaging.
Conclusion
Fluid suppression has considerable value in improving the readability of APTw maps in the neuro-oncological field. In this work, we derive a novel post-processing formula from the underlying Bloch-McConnell equations that efficiently removes fluid artifact, and explains previous approaches which justify the derivation of this metric from a theoretical point of view, to reassure the scientific and medical field about its use.
1 INTRODUCTION
Amide proton transfer-weighted (APTw) MRI is a CEST imaging technique with contrast correlation on the molecular level.1, 2 Despite its valuable clinical utility, especially in the neuro-oncology field,3-6 the APTw signal intensity is known to be influenced by other tissue parameters.2 For example, APTw images, computed with traditional magnetic transfer ratio asymmetry (MTRasym) metrics, often appear brighter in fluid compartments, such as in necrotic tissues or cysts when compared to semi-solid tissue.2 These artificial hyperintensities present a practical problem in their clinical interpretation and raise the question of the molecular origin of APTw imaging.
In 2018, Keupp and Togao came up with an efficient post-processing step that was able to suppress these artificially elevated APTw signal intensities.7 The major benefit of this fluid-suppression post-processing approach is that the correction can be calculated from the same CEST dataset without requiring additional information. Moreover, the fluid suppression yields nearly unchanged APTw values for semi-solid tissue compartments, which allows to directly compare fluid-suppressed MTRasym maps to conventional MTRasym maps using the same colormap limits. In addition, the proposed fluid suppression already showed valuable clinical results in tumor imaging.2, 8-10
A major drawback of the equation proposed by the authors is that they are heuristically motivated, as described in more detail below. This leads to problems of clear interpretation of the physical mechanisms underlying this method, which is difficult to justify for the future clinical translation of this novel APTw map. In this work, we show that fluid-suppression formulas can actually be understood by the known concept of spillover dilution, which itself can be derived from the Bloch-McConnell (BMC) equations.
In APTw-CEST, a selective RF irradiation pulse is applied to the amide proton pool, which yields to saturation that is transferred to the water pool by chemical exchange. The term RF spillover refers to the concomitant saturation of other nearby protons, in this case the water proton pool is partly directly saturated.11-13 Interestingly, this RF spillover leads not only to overlapping saturation effects, but also to a so-called spillover dilution of CEST effects. Thereby, the detectable CEST effect becomes effectively smaller due to the simultaneous occurring saturation of the water pool. This spillover dilution effect of CEST signals was first explained by Sun et al.14-16 who already proposed related corrections. Later studies presented further understanding of spillover dilution by spin lock theory or eigenspace theory, by which could be shown that an inverse metric efficiently removes spillover effects.17-19 These corrections were applied to the multi-Lorentzian pool fits at 3T and 7T, but have not yet found their way to standard APTw imaging based on MTRasym analysis. A possible explanation is that the spillover correction increases the CEST signal intensity of semi-solid tissue and, thus, the windowing and color map limits of the APTw images. This made it difficult to compare the APTw maps before and after spillover correction. On the contrary, the heuristic formula7 suppresses the signal intensity of the liquid component, maintaining similar color map limits of the MTRasym based APTw map.
As already mentioned, the correction of spillover dilution effects leads to the increase in the CEST signal intensities of semi-solid tissues: We show herein that the same concept can be used to decrease the CEST signal intensities of liquid environments. This also leads to nearly unchanged APTw values for semi-solid tissue and thus (i) solves the windowing and comparison problem, (ii) explains the mechanism of existing fluid-suppression formulas, and (iii) puts fluid suppression of CEST contrasts now on a solid theoretical basis.
We further demonstrate the benefits of our properly-derived fluid-suppression formula and comparison with the heuristic one and the conventional MTRasym evaluation in simulations and phantoms experiments, as well as in nine clinical datasets (eight brain tumor and one brain vasogenic edema) acquired at 3T in different clinical centers and with different MRI scanners.
2 THEORY
Most importantly, we can now translate the CEST effect of a liquid environment to a semi-solid tissue environment.
As this equation also transforms CEST effects of liquid areas to a tissue environment, it forms directly the searched- for fluid-suppression formula .
Both formulas have now additional weighting factors either or (2) that share the properties (i) that they are close to 1 for semi-solid tissue compartments ( = 0.5) allowing us to keep the same windowing and colormap, and (ii) must be small for liquid tissue types ( = 1). Hence, our proposed Equation (10) is expected to show similar features as the heuristic Equation (11), but is based on the BMC equations and, therefore, theoretically justified. In addition, ε should be close to 1.7 For this reason, ε was set to 1 for the phantom experiments, whereas in vivo it was set to 0.7 to have similar APTw signal intensity values in normal appearing white matter (NAWM) between MTRasym maps and heuristic fluid-suppressed MTRasym maps.
As mentioned in Equation (9) the can be chosen according to the tissue we want to transform our signals to. In this work we have chosen that for in vivo data will be that of the contralateral NAWM (cNAWM), because values along the various patients are similar ().
3 METHODS
3.1 Standardized pre-saturation using Pulseq-CEST
For all simulations, all phantom measurements, and five out of nine in vivo scans, we used the same standardized APTw CEST protocol APTw_001 as defined in the Pulseq-CEST library https://github.com/kherz/pulseq-cest-library/tree/mrm2023-fluid-supp-APTw, which follows the recommendation of the APTw consensus paper.2, 26 It consists of a pulse train of 36 sinc-gauss pulses with a pulse duration tp = 50 ms, delay time td = 5 ms, DC = 91%, Tprep = 1.975 s at a B1rms of 2 μT. It was repeated at 30 off-resonance frequency offsets in the range between −6 ppm and 6 ppm, and at −300 ppm for the unsaturated reference image. A recovery time of 3.5 s was placed before each pulse train saturation. The exact definition of the CEST sequence can be found here: https://github.com/kherz/pulseq-cest-library/tree/mrm2023-fluid-supp-APTw/seq-library/APTw_3T_001_2uT_36SincGauss_DC90_2s_braintumor.
3.2 In silico: Pulseq-CEST BMC simulation
CEST data were simulated using the Matlab BMC simulation integrated Pulseq-CEST tool version, which is available at https://github.com/kherz/pulseq-cest/tree/v1.1.0. Five different pool systems were simulated with the described sequence APTw_001; their parameters mimic healthy tissue, tumor tissue, and liquid cysts, the detailed parameters are given in Table 1 or are accessible in the Pulseq-CEST library https://github.com/kherz/pulseq-cest-library/tree/mrm2023-fluid-supp-APTw/sim-library/phantoms/l-arginin.
| Type | T1 [s] | T2 [ms] | [L-Arginine] | fs | MT | |
|---|---|---|---|---|---|---|
| Tube 1 | Cyst-like | 1.45 | 1000 | 20 mM | 3.6036 × 10−04 | No |
| Tube 2 | Cyst-like | 1.45 | 1000 | 27 mM | 4.8649 × 10−04 | No |
| Tube 3 | Tissue-like | 1.45 | 50 | 40 mM | 7.2072 × 10−04 | Yes |
| Tube 4 | Tumor-like | 1.45 | 50 | 60 mM | 11 × 10−04 | Yes |
| Tube 5 | Tumor-like | 1.45 | 50 | 70 mM | 13 × 10−04 | Yes |
- Note: Fixed parameters of the amide pool s are ks = 350 Hz, δs = 3.0 ppm, T1,s = 1 s, T2,s = 100 ms. MT pool parameters were (fMT = 0.035, T1,mt = 1 s, T2,mt = 40 μs, kmt = 30 Hz).Abbreviation: MT, magnetic transfer.
3.3 In vitro: Phantoms
To demonstrate the effect of fluid suppression experimentally, five 50 mL-falcon-tubes were prepared using L-arginine at different concentrations to provide the exchanging amide proton pool. To ensure an exchange rate of about 350 Hz,27 a pH-value of approximately 4.0 was titrated using hydrochloric acid (HCl) in a 0.9% sodium chloride (NaCl) solution.
Analog to the simulation, the five different tubes mimic healthy tissue (1x), tumor tissue (2x), and liquid cysts (2x). Since the tumor and reference tissue phantoms contain semi-solid compartments, 2% agarose was added to the heated model solution. The T1 relaxation time was adjusted to approximately 1500 ms by the addition of Gadovist in all phantom tubes. The detailed parameters are given in Table 2.
| Type | Gadovist [1 mM] | Agarose | [L-Arginine] | |
|---|---|---|---|---|
| Tube 1 | Cyst-like | 3.9 μL | 0% | 20 mM |
| Tube 2 | Cyst-like | 3.9 μL | 0% | 27 mM |
| Tube 3 | Tissue-like | 3.9 μL | 2% | 40 mM |
| Tube 4 | Tumor-like | 3.9 μL | 2% | 60 mM |
| Tube 5 | Tumor-like | 3.9 μL | 2% | 70 mM |
Phantom measurements were performed on a 3T scanner (Magnetom Prisma, SIEMENS Healthineers) with a 64-channel head and neck coil. APTw preparation was performed via the APTw_001 protocol before image acquisition using a 3D snapshot GRE.9 Readout parameters were: 220 × 180 × 60 mm3 with a matrix size 128 × 104 × 12, voxel size of 1.7 × 1.7 × 5 mm3, TE = 2 ms, TR = 4 ms, bandwidth = 700 Hz/pixel and a flip angle (FA) of 7°. With the snapshot readout the acquisition time per offset was TA = 6.1 s the total scan time was ˜3 min. For simultaneous B0-B1 mapping, the WASAB1 protocol10 (2 min) was performed with the same readout parameters as for the CEST measurements. For T1 mapping a saturation recovery sequence was used (1:15 min).
3.4 In vivo: Patients
All clinical data were acquired under approval of the local ethics committee (for more information see Declarations).
Five patients diagnosed with brain tumors were scanned with the APTw and WASAB1 protocols described in the previous session along three clinical sites (Erlangen University, University College London Hospitals, La Pitié Hospital) on three 3T scanners (2x MAGNETOM Prisma, 1x MAGNETOM Skyra, Siemens Healthineers), all with a 64-channel head and neck coil.
In addition, to test the consistency of our novel metric on other 3T scanners from other vendors, two pathological brain data sets (one brain tumor and one vasogenic edema) were acquired on a 3T Elition (Philips Healthcare) with a 32-channel head coil (Dent Neurologic Institute) and 2 other pathological brain data sets (pediatric brain tumors) were acquired on a 3T Discovery MR750 (GE HealthCare) with a 16-channel head and neck coil (Necker-Enfant Malades Hospital).
Philips and General Electric APTw data were acquired respectively using turbo spin echo (TSE) (TE = 8 ms, TR = 6000 ms, FA = 90°, matrix size = 128 × 104 × 10, voxel size of 1.8 × 1.8 × 6 mm3) and fast spin echo (FSE) (ETL = 20 ms, TR = 5000 ms, FA = 90°, matrix size = 128 × 96 × 10, acquired voxel size of 1.6 × 2.1 × 8 mm3) protocols with a 2 s saturation pulse of B1rms = 2 μT, 100% Duty Cycle. Data were acquired at following six offsets: ±2.7, ±3.5, ±4.3 ppm. For Philips B0 mapping, field maps were acquired by using MS fast field echo (FFE) sequence (number of echoes = 2, TE = 7 ms, ΔTE = 3 ms, TR = 450 ms, voxel size: 1.8 × 1.8 × 6 mm3, bandwidth = 440 Hz/pixel, FA = 80°) and for GE B0 mapping, a quantitative chemical shift-encoded (CSE) MRI was used (IDEAL-IQ).28
For the post-processing of the APTw and fluid-suppressed APTw maps, the software Olea Sphere 3.0 (Olea Medical, La Ciotat, France) was used. APTw raw data were manually skull-stripped, denoised with Principal-Component-Analysis-based filter29 and spatial filter,30 motion corrected with Elastix31 after intra-volumes histogram matching, normalized by M0 volume, and B0-corrected using B0 field map. For 3D snapshot GRE data, the B0 map was computed by the software using fast WASAB1 processing approach.32 For the comparability of the in vivo data from the different scanners, the same color bar was used for all APTw maps within the limits −1% to 5%.
In addition, for each patient a T1 weighted (before (T1w) and after contrast injection (Gd-T1w)), a T1- or T2-fluid-attenuated inversion recovery (FLAIR) and ADC maps were acquired.
3.5 Definition of for in vivo data
All in vivo data were evaluated using Eqs. (1), (4), (9), and (10) at 3.5 ppm. In Eqs. (9) and (10), we used , which is determined directly from the data to be = 0.352. As already written in the theory section, we made this choice because the cNAWM APTw values along the various patients are similar, contrary to the APTw values of the tumor (also contaminated by ssMT which is sensitive to the increase and variable content of macromolecules in the tumor).33 Surprisingly, cNAWM APTw values were similar for the three sequences (GRE, FSE, TSE), demonstrating the importance of the Consensus Paper for standardization of the APTw protocols.2
4 RESULTS
4.1 In silico
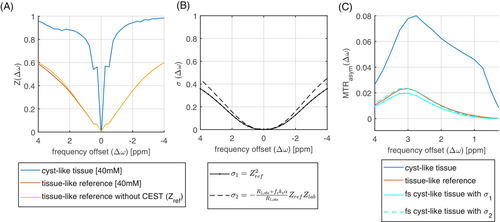
In a first experiment, we apply the newly derived formulas to a controlled Z-spectrum simulation. In Figure 1a), the same CEST pool is once simulated in a liquid/cyst-like environment (blue line) and once in a tissue environment (red line). From the Z-spectra, but also the MTRasym plots (Figure 1c) it is evident that the CEST effect is much larger in the liquid environment compared to the tissue environment. This is exactly the fluid hyperintensity artifact we want to resolve. When the spillover dilution factors (Figure 1b) are multiplied with the MTRasym of the liquid system, we get the fluid-suppressed MTRasym that is now close to the expected tissue MTRasym, the deviation decreases from +340% down to −16.7% using Equation (7); using Equation (8) even down to 0.6%. Important to note is that the simulation is a pulsed CEST experiment and the equations generalize to this setting.
4.2 In vitro
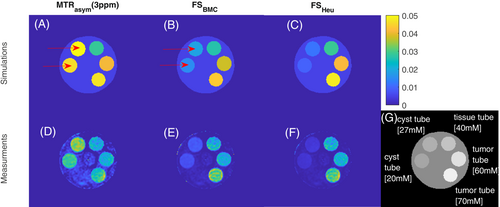
In the next experiment we go one step further. We designed a simulation and a set of phantoms to generate a worst case: the cyst-like tube generates higher CEST signals compared to tissue-like tubes and tumor-like tubes. In Figure 2, the fluid suppression was evaluated in simulation and a phantom measurement. Here, the MTRasym in the cyst-like tubes show the highest image contrast, despite having the lowest amide proton concentrations. After fluid suppression, the image contrast for the cyst-like tubes is clearly reduced, while the image contrast for the tissue-like tubes and both tumor-like tubes remains almost unchanged. Thereby, both the heuristic and the spillover-based fluid suppression show similar behavior. In comparison, the proposed approach reveals a slightly increased intensity for liquid compartments, while solid compartments such as tumor show a marginally lower intensity compared to the heuristic suppression. In both, simulation and measurement, the CEST effect reflects the order of concentration levels only after fluid suppression.
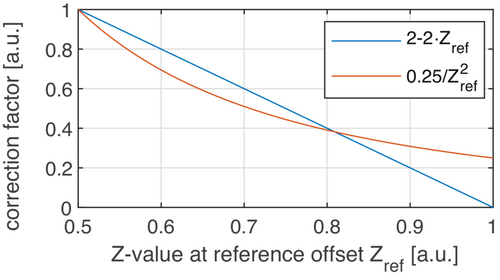
An explanation why the heuristic formula works is given by the analysis in Figure 3. Both fluid-suppression factors show a comparable course when plotted as a function of the reference scan . This explains the similar effect on the data, especially in liquid regions with high Z-values.
A pixel-by-pixel analysis was carried out to examine the fluid suppressed MTRasym values as function of the different concentrations (Figure 4). Both fluid suppression approaches (B, C) increase the correlation with the underlying concentrations when compared to the standard MTRasym (A). Our proposed metric shows even proportionality and passes through zero and 0 mM (B). The heuristic method seems to over-suppress the CEST effect due to a lower correction factor at > 0.8 (Figure 3), which leads to reduced values at low concentrations.

4.3 In vivo
Nine patients were acquired on different MRI scanners from different vendors, with APTw sequences following the guidelines of the consensus paper, as described in the Methods section. These patients were selected to have liquid components in the peritumoral and intratumoral area that can alter the APTw signal intensity.
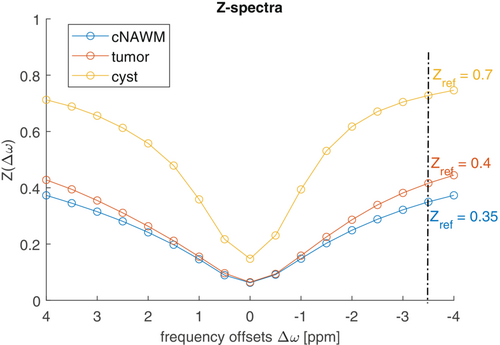
Figure 5 a shows three Z-spectra from different region of interest (ROI) placed in cystic, tumor, and cNAWM areas of one patient with a glioma Grade IV, IDH wildtype, acquired with the 3D snapshot-GRE protocol (Siemens 3T Prisma). As can be seen, the various Z-spectra have different shapes and resemble the Z-spectra of the numerical experiments. Focusing on (−3.5 ppm), values around 0.7 for cyst, 0.4 for tumor area, and 0.35 in cNAWM, can be noticed. As (−3.5 ppm) for cNAWM was similar across the nine acquired datasets, we used = 0.352 for the clinical spillover-corrected fluid suppression according to Equation (9) as well as for the heuristic approach according to Equation (11) with ε = 0.7 for matching the cNAMW of the MTRasym maps.
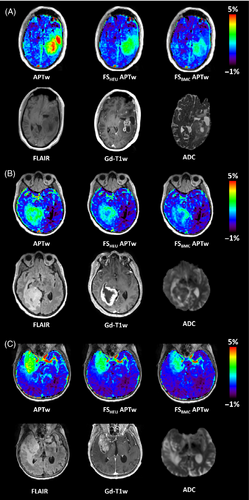
As shown in the clinical images of this patient (Figure 6a), the standard APTw map reveals hyperintensities in both cystic areas. The corresponding ADC map also shows elevated values in these areas, indicating a high degree of diffusion of water molecules and thus fluidity. By using the heuristic formula, these artificial APTw values can be suppressed in both cystic regions, while the proposed approach based on the BMC equations lowers the values even further, so that only the signal intensity of the tumor remains elevated. In addition, the fluid-suppressed APTw map shows good agreement with the contrast-enhanced tumor margin represented by the Gd-T1w map. Figure 6B,C further illustrate the effect of fluid suppression based on two more patients with glioblastoma, in which the contrast enhancement is clearly visible at the tumor rim, whereas the central necrotic core appears hypointense in Gd-T1w maps after contrast agent administration. Again, the standard APTw map shows increased signals in both the tumor and necrotic regions. After fluid suppression, only hyperintense signals are found in the tumor tissue and at the tumor margin, while the necrotic regions appear hypointense. In addition, both approaches for fluid suppression show a similar image contrast.
Fluid suppression not only plays a key role in eliminating hyperintense signals of cysts and necrosis, but is also invaluable in postoperative imaging. Figure 7a shows the maps of a patient with glioblastoma who underwent multiple tumor resections, concurrent radiochemotherapy, and ‘Gamma Knife’ radiosurgery. Subsequent MRI examination revealed disease progression with a new contrast-enhanced mass. Interestingly, the cystic surgical cavity shows the same elevated standard APTw signal intensity as the recurrent tumor: this fluid-artifact is effectively corrected by fluid suppression, returning the values in the resection area back to those of cNAWM. Figure 7b shows another glioblastoma patient who has just undergone surgery. In the subcutaneous tissues, a region of edema is visible, post craniotomy, with thickening of the dura mater. While the standard APTw map shows a high signal intensity throughout the ROI, the proposed fluid-suppression formula effectively suppresses all liquid artifacts leaving only the pathological lesion highlighted. This is in good agreement with the Gd-T1w map.
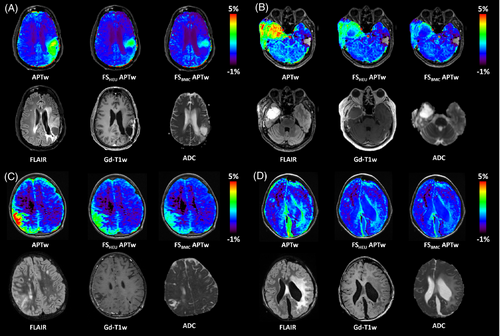
Figure 7C,D show two pediatric cases after brain surgery. In the first pediatric patient, a right parietal lesion was partially removed: a postoperative remnant and a local meningeal infiltration are visible in the MRI maps. Images for the second pediatric patient, operated for left hemispheric tumor presents residue remains and liquid post-surgical cavity. Also, in these cases, the spillover-correction-based approach suppresses the liquid artifacts, which present an elevated signal in the standard APTw maps.
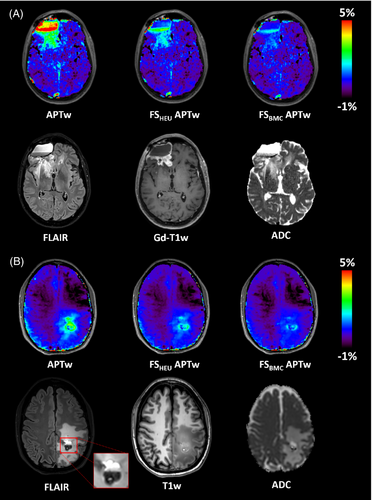
The last two case studies demonstrate fluid suppression in the presence of hemorrhage. Figure 8A shows MR images of a patient with glioblastoma in the right frontal region treated by excision, subsequent radiochemotherapy according to the STUPP protocol, and adjuvant chemotherapy. The patient has both cystic and hemorrhagic compartments clearly distinguishable in the right frontal area. While the standard APTw map highlights both areas, the heuristic and proposed approach effectively suppress the signal in the cystic area but does not abolish the hyper-intensity signal in the hemorrhagic region. Figure 8B shows MR images of a patient with history of cavernous malformation, currently suffering from drug resistant seizures. The clinical images show a cavernous malformation in the left parietal lobe, with both chronic and recent hemorrhage, as well as vasogenic edema. The standard APTw map shows an elevated signal in both hemorrhagic zones. Notably, fluid suppression effectively suppresses the acute hemorrhagic area, which is in the top half of the lesion, while only reducing the signal intensity of the chronic hemorrhage region, which remains hyper-intense. This is important in the context of stroke, where hemorrhagic regions are APTw-hyperintense and ischemic areas are APTw-hypointense. Hemorrhage may have increased APTw signal due to increased protein content.34 The corrected hemorrhagic APTw signal intensity is reduced by the proposed approach because it is diluted but not completely canceled in the liquid component.
5 DISCUSSION
In this work, we have shown that fluid suppression in APTw-CEST imaging can be derived from the BMC equations. It turns out that fluid-suppression can be understood as implicitly using the concept of spillover dilution correction, which was previously discussed in the literature.24, 25 While we could not find a theoretical derivation of the heuristic formula, the similarity of the correction factors also explains why the heuristic approach of Keupp and Togao7 provides an efficient fluid suppression. In contrast to the heuristic approach, our theoretically founded approach also generalizes to different frequency offset (Figure 1).
Conventional spillover correction can be understood as translation of a CEST effect of any tissue type to a complete liquid (or ideal) environment. An additional effect of using semi-solid tissue as a target tissue is that this allows the usage of the same color map windowing and makes MTRasym based metrics and spillover-adjusted/fluid-suppressed metrics for APTw imaging directly and visibly comparable.
It should be noted that the presented approach of fluid-suppression does not include any T1 correction as proposed, for example, by the apparent exchange-dependent relaxation rate (AREX) approach.17 We focused here only to the spillover dilution term, and both outcomes could be still contaminated by T1 of water. As T1 is generally higher in liquid compartments, a T1 correction would further lower the CEST effects in liquid compartments with regard to semi-solid tissue CEST effects.
Concerning the comparison between the heuristic and our proposed approach, a different signal intensity was found in simulations and real measurements. This can directly be understood by Figure 3 where the deviation of the two factors for different Z-values is obvious.
In simulation, it could be shown that the approximation of the spillover dilution factor (Equation 8) is suitable for the correction of the APTw images. Since is already available over the acquired data, the correction of MTRasym can be performed very easily via the proposed method. Our theory provides an even more accurate correction term that includes and (Equation 7). However, this correction factor is not practical for retrospective analysis as we do not know . The deviation between both Eqs. (7) and (8) is small as long as ≪ .
In tumor cases with clearly identified liquid regions, provided by the cystic and necrotic regions, after postoperative surgery and through hemorrhage, the proposed fluid-suppressed approach shows similar fluid suppression when compared to the heuristic method. The suppression clearly removed residual highlighted areas of liquid compartments such as cysts and necrosis (Figure 6), microfluid environments after surgery (Figure 7) and especially hemorrhage (Figure 8) identified by the acquired ADC and T1w maps. The stronger suppression in some tumor areas of the proposed method as visible in the Figures 6B, 7B or 8 is most probably due to a higher water content in these areas. This is supported by the increased ADC values, which indicate a higher water content. On the other hand, it is likely that the protein concentrations are not homogeneous at the tumor rim. As there is no additional histopathological information available nor a longitudinal study, we cannot clarify these findings herein in more detail.
As already described above, the stronger suppression is caused by the larger correction factor at higher Z-values (Figure 3). Nevertheless, both methods show their significant relevance in correcting the APTw maps in order not to derive incorrect conclusions from the data. In addition, we also tested an extension of the heuristic formula, which was previously presented on a conference.36 The results can be found in the supporting information.
It is also important to note that APTw signal intensity in tumors may decrease after fluid suppression (if the chosen target tissue is the one of cNAWM). This phenomenon is in agreement with what has been previously shown in Sun and Sorensen16: the inverse formula (Equation 13) was presented to be both a metric for spillover and MT correction. In Figure 5, tumor values (≈0.4) were seen slightly higher than cNAWM values (≈0.35) due to the presence of the ssMT signal. Therefore, by applying the spillover-corrected/fluid-suppressed formulas, the tumor APTw values will be corrected by the ssMT contamination, resulting in a APTw tumor signal intensity more related to the mobile protein signal and less to macromolecule signal.33 If, on the other hand, the tumor signal intensity is wanted to be left unchanged, the tumor tissue can be chosen as the target value, as was done heuristically in Keupp and Togao,7 which however will lead to a slightly increase in the NAWM signal intensity instead.
We further demonstrated that the proposed metric works for similar acquisition protocols realized on systems from different vendors and in different clinical centers following the guidelines proposed in the APTw consensus paper.2 Once the fluid or spillover artifact is removed, the generated image contrast is also theoretically expected to correlate stronger with the actual exchange effects (see Equations 5 vs. 6), and shows first signs of a higher diagnostic value, as shown by initial studies.10-12 In this small multicentric clinical study, we have also shown the importance of this metric for both adult and pediatric pathology assessment, both before and after brain surgery.
To conclude, with this article we want to further strengthen APTw-CEST imaging based on MTRasym evaluation, which has been found to be a very important biomarker for tumor grading and other neurological applications. We showed that by the use of both APTw maps (before and after fluid suppression) an improved interpretation of the APTw signal is possible, improving the value of APTw imaging as an indicator for cancer. Our proposed method is a simple post-processing step that can be readily applied to new data, as well as to all existing APTw data.
6 CONCLUSIONS
In this work, we justify fluid-suppression techniques for APTw-CEST imaging from a theoretical point of view and apply a novel formula to simulations, phantoms and in vivo in brain tumor patients with consistent outcomes. We show that fluid suppression clearly improves the readability of APTw maps in the neuro-oncological field. Therefore, its integration in APTw imaging is highly desirable.
7 DECLARATIONS
Ethics approval: University College London Hospital: This prospective, on-going, investigator-initiated, single-centre, neuro-oncology imaging study received ethical and institutional review board approval (IRAS project ID: 210819; Research Ethics Committee reference: 16/LO/2081). All patients, prior to participation, provided written informed consent to participate and for publication. Dent Institute: Dent Neurologic Insitute Written consent was obtained from patients. This prospective study protocol was approved by WCG IRB, formerly (Western Institutional Review Board). Protocol name: Optimization of Neurologic Imaging Dent Neurosciences Research Center. Protocol number: 20170119. Necker Enfant Malades Hospital: Local Institutional Review Board authorization was granted (EDRACT 2014-A00541-46). Informed consent for research was prospectively obtained for the study. La Pitie Hospital (APHP): MR images of this adult patient were acquired at 3 T Skyra MR scanner (Siemens Healthineers, Erlangen, Germany) in the Neuroradiology Department of the Pitié Salpêtrière Hospital. The data were made available by the Clinical Data Warehouse of the Greater Paris University Hospitals (Assistance Publique-Hôpitaux de Paris [AP-HP], reference number: 20211216174611), in accordance with the Ethical and Scientific Board of the AP-H.
CONFLICT OF INTEREST STATEMENT
Patrick Liebig is an employee of Siemens Healthcare. Stefano Casagranda and Christos Papageorgakis are employees of Olea Medical.
Open Research
DATA AVAILABILITY STATEMENT
Sequences for simulation are accessible at our Github Library at https://github.com/kherz/pulseq-cest-library/tree/mrm2023-fluid-supp-APTw, while the in vitro *.yaml files are provided under examples at https://github.com/kherz/pulseq-cest-library/tree/mrm2023-fluid-supp-APTw/sim-library/phantoms/l-arginin. In vivo data can be requested with reasonable justification. The exact version of the Pulseq-CEST repository can be found at https://github.com/kherz/pulseq-cest/tree/v1.1.0.


