Retrospective frequency drift correction of rosette MRSI data using spectral registration
Abstract
Purpose
Frequency drift correction is an important postprocessing step in MRS that yields improvements in spectral quality and metabolite quantification. Although routinely applied in single-voxel MRS, drift correction is much more challenging in MRSI due to the presence of phase-encoding gradients. Thus, separately acquired navigator scans are normally required for drift estimation. In this work, we demonstrate the use of self-navigating rosette MRSI trajectories combined with time-domain spectral registration to enable retrospective frequency drift corrections without the need for separately acquired navigator echoes.
Methods
A rosette MRSI sequence was implemented to acquire data from the brains of 5 healthy volunteers. FIDs from the center of k-space ( FIDs) were isolated from each shot of the rosette acquisition, and time-domain spectral registration was used to estimate the frequency offset of each FID relative to a reference scan (the first FID in the series). The estimated frequency offsets were then used to apply corrections throughout -space. Improvements in spectral quality were assessed before and after drift correction.
Results
Spectral registration resulted in significant improvements in signal-to-noise ratio (12.9%) and spectral linewidths (18.5%). Metabolite quantification was performed using LCModel, and the average Cramer-Rao lower bounds uncertainty estimates were reduced by 5.0% for all metabolites, following field drift correction.
Conclusion
This study demonstrated the use of self-navigating rosette MRSI trajectories to retrospectively correct frequency drift errors in in vivo MRSI data. This correction yields meaningful improvements in spectral quality.
1 INTRODUCTION
Proton (1H) MRSI enables mapping of tissue metabolite concentrations in two or three dimensions in vivo.1-3 Over the past several decades, development of MRSI acquisition, reconstruction, and data-processing techniques has led to improved spatial coverage and resolution, acquisition speed, artifact rejection, and metabolite quantification.4-7 In particular, the development of spatial-spectral encoding techniques such as echo planar spectroscopic imaging,8, 9 spiral,10 concentric rings,11 radial,12 rosette13 and stochastic trajectories14 has enabled rapid and high-resolution MRSI data acquisition.
In vivo MRS/MRSI experiments are negatively affected by temporal fluctuations in the main magnetic field (B0). Drifts in the B0 field primarily occur as a result of heating of passive shim elements by the gradient coils, and subject motion (both physiological and bulk).15 This results in shot-to-shot accrual of frequency and phase variations between repetitions, thereby causing incoherent averaging and/or encoding, which in turn results in spectral peak broadening, lineshape distortion, spectral misalignment, and signal–to–noise ratio (SNR) losses in the resulting spectra.
In single-voxel MRS, B0 drift can be corrected retrospectively by aligning each acquired average to a reference scan (usually one of the averages in the series). Several alignment approaches have been proposed, including correlation-based methods,16 residual water peak correction,17 metabolite lineshape fitting,18 and time-domain spectral registration (SR).19 However, drift correction in MRSI proves to be more challenging because of the sampling of different -space coordinates across repetitions. If the resulting repetitions do not share any common -space points (as is the case in most MRSI sampling trajectories), then spectral alignment cannot be used for drift estimation. In such cases, techniques using separately acquired navigator echoes20-23 have been proposed for drift correction in MRSI. However, this approach complicates implementation, and may also result in longer acquisition times.
In contrast, centric -space trajectories such as spiral, radial, or rosette trajectories do contain a common -space point across all repetitions, namely, the center of -space or . Such centric trajectories are said to be “self-navigating.” In this paper, we demonstrate the use of the self-navigating rosette MRSI trajectory for characterizing and correcting for scanner B0 drift using time-domain spectral registration in vivo. Specifically, from each repetition (i.e., each TR cycle), we isolate the FID from the center of -space (i.e., the FID). Then, using the SR algorithm, the FIDs are retrospectively aligned to a reference scan (i.e., the first FID in the series) to estimate the frequency offset at each repetition. The estimated frequency offsets are then used to apply corrections throughout -space.
To demonstrate the efficacy of this approach, rosette MRSI data were acquired in 5 healthy volunteers at 3 T. To assess spectral quality, the linewidth (LW) and SNR of the N-acetylaspartate (NAA) peak were assessed throughout the brain before and after drift correction. Next, we assessed the improvement in quantification precision of brain metabolites obtained using LCModel (Stephen Provencher, Inc.).24 Results from this study demonstrated a significant improvement in spectral quality following drift correction.
2 METHODS
2.1 Study participants
Rosette MRSI data were acquired in 5 healthy volunteers (4 males, 1 female; age: 29 ± 6 years) with no history of brain disease. All study procedures were approved by the Research Ethics Board of Sunnybrook Hospital.
2.2 Data acquisition
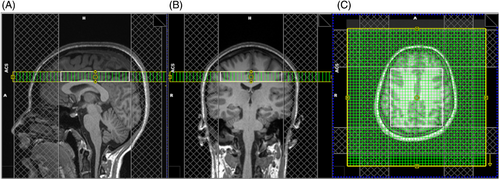
A 2D PRESS-localized rosette MRSI sequence (Figure 1A) was implemented on a 3T Prisma MR scanner (Siemens) with a 20-channel phased array head coil and the following scan parameters: TR/TE = 1200/30 ms, flip angle = 72°, 8 averages, PRESS excitation region = 90 × 100 × 15 mm3, encoding FOV = 240 × 240 mm, matrix size = 48 × 48, nominal voxel size = 5 × 5 × 15 mm3, spectral bandwidth = 1587 Hz, and slice-selective RF pulse center frequency = 3.0 ppm. The rosette trajectory (Figure 1B) was implemented with 126 k-space samples per rosette petal, 576 FID points per k-space position (i.e., each rosette petal was traversed 576 times sequentially), and 76 rosette petals/shots. During the acquisition of each petal/shot, the ADC was open for a total duration of 362.88 ms, and a total of 72 576 sample points were acquired. Adjustment of all first-order and second-order shims was performed using the Siemens gradient-echo shim method (i.e., the “Brain” shim mode).25 Before excitation, water suppression enhanced through T1 effects26 was performed, consisting of three frequency selective pulses each with a duration of 25.6 ms and a bandwidth of 80 Hz. Four outer-volume suppression bands of 30-mm thickness each were manually placed around the edges of the PRESS localization region to further suppress extracranial lipid signals. The sequence was implemented in long-term averaging mode, whereby all 76 rosette petals are traversed before repeating signal averages. The total scan time was approximately 12 min. Before the rosette MRSI scan, a 3D T1-weighted, MP-RAGE image (1-mm isotropic resolution) was acquired for localization purposes.27 The MRSI slice was oriented axially and positioned just above the lateral ventricles (Figure 2).
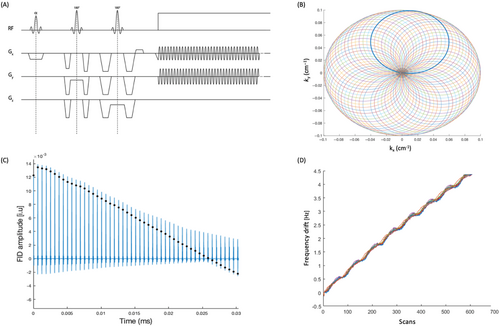
Prior to implementing rosette MRSI in vivo, phantom experiments (using a GE Braino phantom; GE Healthcare) were performed using the same scan protocol as above, for validation purposes (Figure 1D).
The MAGNETOM Prisma scanner can achieve a maximum gradient amplitude of 80 mT/m and a slew rate of 200 T/m/s. Using a spectral bandwidth (δ) of 1587 Hz yielded a peak gradient strength of 11.71 mT/m along the x-direction and y-direction, and 7.28 mT/m along the z-direction. The peak slew rate in the x-direction and y-direction was 127.97, and 36.66 T/m/s along the z-direction. Data were extracted from the scanner console in TWIX (.dat) format, which contains individual raw FIDs for each RF channel and repetition.
2.3 Data processing
where is the intensity of the first point in the FIDs, and is the coil number. Coils were then summed by the equation , where is the th coil's sensitivity weight; is the th coil FIDs; and is the final summed signal.31 This way, signals from multiple coils were combined for optimal SNR at every image voxel. The phase and weight maps calculated for the coil combination of water unsuppressed data were applied to the water-suppressed data, after which spectral Fourier transform was performed to obtain the resulting 48 × 48 MRSI grid. Residual water peak removal was implemented using L2 regularization.32
2.4 Frequency and phase drift correction
2.5 Metabolite quantification
Processed MRSI data were fit using LCModel.24 A non-water-suppressed rosette MRSI acquisition (two averages) was used to provide water referencing on a voxel-wise basis in LCModel. The LCModel default values for WCONC, ATTH2O, and ATTMET were used, and no additional correction for T1-relaxation or T2-relaxation of water or metabolites was performed. The non-water-suppressed scan was also used for eddy current correction. An LCModel basis set was simulated in FID-A and included 21 brain metabolites: alanine (Ala), aspartate (Asp), creatine (Cr), phosphocreatine (PCr), phosphocholine (PCh), gamma-aminobutyric acid (GABA), glutamine (Gln), glutamate (Glu), myo-inositol (Ins), lactate (Lac), NAA, scyllo-inositol (Scyllo), Asc (ascorbate), glycerophosphocholine (GPC), glucose (Glc), glutathione (GSH), N-acetylaspartylglutamate (NAAG), glycine (Gly), serine (Ser), phosphorylethanolamine (PE), and taurine (Tau). Contributions from macromolecules (MM) were also incorporated.33 Specifically, the basis set included nine individual Gaussian MM components (frequencies: 0.89, 1.2, 1.39, 1.63, 1.98, 2.28, 2.98, 3.19, and 3.75 ppm). The parameters (frequency and LW) of these MM components were estimated based on acquired metabolite-nulled localized brain MRS spectra from healthy volunteers at 3 T. Spectra were fitted within the chemical shift range 0.5–4.2 ppm. All spectra from within the excited PRESS region (90 × 100 mm2 in-plane) were included for further analysis in all subjects, and the following metabolites of interest were considered: tCh (GPC + PCh), tNAA (NAA + NAAG), tIns (Ins + Gly), tCr (Cr + PCr) and Glx (Glu + Gln), as these metabolites consistently showed reasonable precision in their quantification (i.e., Cramér–Rao lower bound [CRLB] < 20%). CRLB values for LCModel quantified data were compared using a two-tailed Student's paired t-test to assess changes in fit uncertainty following drift correction.
The details of the rosette MRSI acquisition and analysis are also included in the MRS reporting checklist (Table S1).34
3 RESULTS
3.1 Field drift characterization
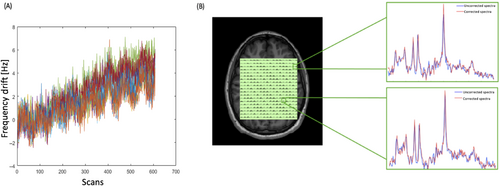
The measured frequency drift from one of the in vivo rosette MRSI acquisitions is shown in Figure 3A. The resonant frequency drifted approximately linearly by a total of 5.7 Hz across all scans during the 12-min acquisitionfor the representative data set. The average total frequency drift measured across all data sets was 5.8 Hz (0.48 Hz/min). Because none of the scans in this study were preceded by gradient-heavy EPI or diffusion imaging sequences,35 the observed frequency drift is likely due to gradient heating induced by the rosette gradients themselves. Figure 3B shows water-suppressed spectra before and after field drift correction from one arbitrarily chosen voxel in gray matter and one in white matter from the reconstructed 1H-MRSI grid. Visually, the metabolite peaks appear to have higher amplitude following drift correction.
3.2 Assessment of spectral improvement following drift correction
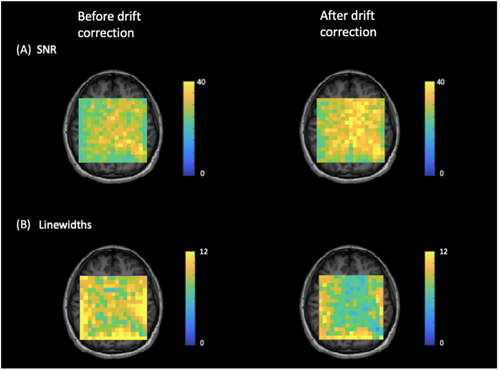
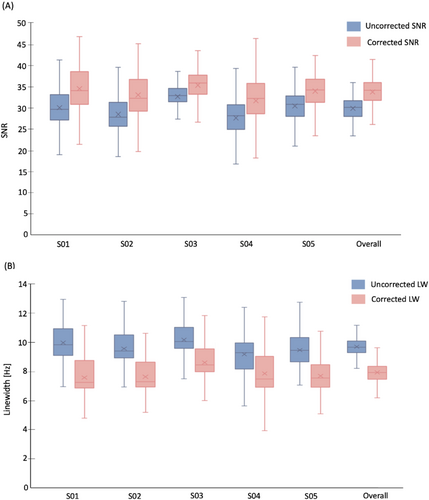
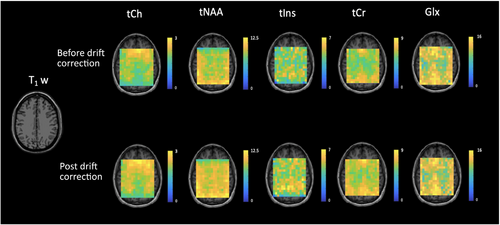
Figure 4 shows NAA-SNR and NAA-LW maps measured before and after drift correction in a representative subject. Across all voxels in all subjects, the average values of SNR increased by 12.9% from 29.9 ± 2.6 to 33.8 ± 3.0 [t(528) = −16.05, p < 0.05], and the NAA LWs decreased by 18.5% from 9.7 ± 0.6 Hz to 7.9 ± 0.8 Hz [t(530) = 29.99, p < 0.05]. Figure 5 summarizes the improvement in SNR and LW following drift correction for each individual subject as well as for the entire study cohort. To assess the potential change in metabolite concentration estimates and their uncertainties after spectral registration, metabolite concentration maps were generated for tNAA, tCh, tCr, and tIns based on the LCModel fitting results (Figure 6). Table 1 illustrates the mean LCModel absolute concentration estimates and the corresponding CRLB values before and after drift correction for the selected metabolites in all subjects as well as the whole study cohort. The mean CRLB values for tCh, tNAA, tIns, and tCr showed a statistically significant decrease (p < 0.05), with reductions of 3.9%, 4.0%, 12.6%, and 5.3%, respectively. In contrast, the mean CRLB value for Glx showed a non-significant decrease of 0.8% (p > 0.05). This may be attributed to the relatively low SNR of the Glx peaks, which made it difficult to detect any statistically significant changes in Glx peak heights or fitting quality after drift correction.
| Before Spectral Registration | After Spectral Registration | |||||||||||
|---|---|---|---|---|---|---|---|---|---|---|---|---|
| Meta-bolite | S01 | S02 | S03 | S04 | S05 | Overall | S01 | S02 | S03 | S04 | S05 | Overall |
| tCh conc. | 2.1 ± 0.3 | 1.7 ± 0.4 | 2.1 ± 0.3 | 2.1 ± 0.2 | 1.9 ± 0.3 | 2.0 ± 0.3 | 2.1 ± 0.3 | 2.1 ± 0.2 | 2.2 ± 0.3 | 2.2 ± 0.2 | 2.2 ± 0.4 | 2.2 ± 0.3 |
| %CRLB | 7.5 ± 1.2 | 7.8 ± 1.1 | 7.6 ± 1.2 | 7.7 ± 1.2 | 7.8 ± 1.3 | 7.7 ± 1.2 | 7.2 ± 1.2 | 7.6 ± 1.1 | 7.2 ± 1.1 | 7.4 ± 1.2 | 7.5 ± 1.3 | 7.4 ± 1.2 |
| tNAA conc. | 9.3 ± 1.2 | 8.9 ± 0.9 | 9.9 ± 1.3 | 9.9 ± 1.8 | 8.9 ± 1.1 | 9.4 ± 1.3 | 9.4 ± 1.1 | 11.2 ± 1.5 | 10.0 ± 1.2 | 10.1 ± 1.7 | 9.1 ± 1.1 | 10.0 ± 1.3 |
| %CRLB | 7.2 ± 1.0 | 7.6 ± 1.2 | 7.5 ± 1.1 | 7.4 ± 1.1 | 7.8 ± 1.2 | 7.5 ± 1.1 | 7.0 ± 1.0 | 7.3 ± 1.1 | 7.3 ± 1.1 | 7.2 ± 1.1 | 7.4 ± 1.2 | 7.2 ± 1.1 |
| tIns conc. | 4.6 ± 0.8 | 3.8 ± 0.8 | 5.7 ± 1.7 | 5.9 ± 1.3 | 6.0 ± 1.5 | 5.2 ± 1.2 | 5.0 ± 0.8 | 4.6 ± 0.7 | 5.9 ± 1.7 | 6.0 ± 1.2 | 6.2 ± 1.5 | 5.5 ± 1.2 |
| %CRLB | 17.9 ± 2.9 | 17.2 ± 2.7 | 17.7 ± 2.6 | 16.9 ± 3.0 | 17.3 ± 2.6 | 17.4 ± 2.8 | 15.3 ± 2.9 | 15.0 ± 2.6 | 15.5 ± 2.6 | 14.3 ± 3.2 | 15.9 ± 2.6 | 15.2 ± 2.8 |
| tCr conc. | 6.4 ± 0.7 | 5.2 ± 0.9 | 6.5 ± 1.1 | 6.8 ± 0.8 | 6.2 ± 0.7 | 6.2 ± 0.8 | 6.6 ± 0.6 | 6.4 ± 0.9 | 6.6 ± 1.0 | 6.1 ± 1.2 | 6.3 ± 0.7 | 6.4 ± 0.9 |
| %CRLB | 7.6 ± 0.7 | 7.5 ± 0.8 | 7.4 ± 0.9 | 7.3 ± 0.8 | 7.6 ± 0.8 | 7.5 ± 0.8 | 7.2 ± 0.7 | 7.2 ± 0.8 | 7.1 ± 0.8 | 6.8 ± 0.8 | 7.4 ± 0.7 | 7.1 ± 0.8 |
| Glx conc. | 12.4 ± 1.9 | 12.9 ± 1.4 | 15.3 ± 2.4 | 15.2 ± 2.6 | 14.8 ± 1.9 | 14.1 ± 2.0 | 12.3 ± 1.9 | 12.9 ± 2.2 | 15.04 ± 2.1 | 15.2 ± 1.7 | 14.9 ± 1.8 | 14.1 ± 1.9 |
| %CRLB | 11.6 ± 2.0 | 11.3 ± 1.9 | 11.7 ± 2.2 | 11.4 ± 1.8 | 11.8 ± 2.1 | 11.6 ± 2.0 | 11.5 ± 2.0 | 11.3 ± 1.9 | 11.7 ± 2.1 | 11.4 ± 1.8 | 11.8 ± 2.1 | 11.5 ± 2.0 |
- Abbreviations: conc., concentration; CRLB, Cramér–Rao lower bound; Glx, glutamate + glutamine; tCh, glycerophosphocholine + phosphocholine; tCr, creatine + phosphocreatine; tIns, myo-inositol + glycine; tNAA, N-acetylaspartate + N-acetylaspartylglutamate.
4 DISCUSSION
This study demonstrates the use of the self-navigating rosette MRSI trajectories to retrospectively correct frequency and phase drifts in the acquired in vivo MRSI data. Drift correction was possible without the need for separately acquired navigator echoes, as the rosette trajectory collects an FID at the center of -space on every shot, which can be used for frequency alignment. Other centric -space trajectories such as spiral or radial MRSI would be similarly amenable to this approach. However, approaches using other commonly used MRSI trajectories, including conventional MRSI, concentric rings MRSI, or echo planar spectroscopic imaging, cannot benefit from this approach, as these acquisitions do not share any common -space points from shot to shot.
A recent multicenter study investigated the magnitude of frequency drift during single-voxel MRS experiments at 3 T.36 Across 95 3T scanners from three major vendors (GE, Philips, and Siemens), the average rates of frequency drift were 0.29 and 0.43 Hz/min before and following a gradient-intensive echo-planar functional MRI acquisition, respectively. In the current study, although the rosette acquisition did not follow any gradient-intensive imaging sequences, we observed a relatively high drift rate of 0.48 Hz/min (average across 5 participants). This high rate of drift suggests that spatial-spectral MRSI sequences are likely associated with more gradient heating and greater frequency drift compared with single-voxel MRS. This result is not unexpected, given the intensive sinusoidal gradient trajectories used, and suggests that as rapid spatial-spectral MRSI approaches emerge into mainstream use, frequency drift correction will be an important consideration. (Note that in the current study, scans were not performed early in the morning, and thus were likely not affected by drift effects that are known to occur when the system is waking from overnight energy economy mode). The drift rate results obtained in this study were notably lower than the typical drift rates observed in diffusion MRI studies (|| = 3.1 Hz/min),37 indicating the relatively lower impact of rosette MRSI on gradient coil heating. Future work should aim to characterize typical field drift across multiple scanners and its impact on MRSI spectral quality.
The current study used a long-term averaging mode in which all rosette rings are traversed before repeating signal averages. In this case, the effects of frequency drift would be more pronounced along the averages dimension rather than spread throughout -space. In the case of short-term averaging, in which all averages are collected for a single rosette ring before proceeding to the next ring, the opposite would be the case: Frequency drift would be more pronounced throughout -space than along the averages' dimension. How exactly drift-related artifacts would manifest differently between these two cases is not well understood and should be the subject of future study, either experimentally or via simulation.
In single-voxel MRS, the performance of spectral registration is dependent on voxel size, with small voxels yielding lower SNR, resulting in poorer performance of the spectral registration algorithm. In contrast, the performance of spectral registration in the current MRSI application is not dependent on the spatial resolution of the reconstructed MRSI image. This is because spectral alignment uses the FIDs, which contain signal from the whole excited slice/volume. Because MRSI experiments normally excite a large volume, SNR constraints are not expected to be an issue for most applications of the proposed method. This feature may render this method useful in x-nuclear MRS, in which metabolite signals are weaker. Moreover, because time-domain spectral registration uses the early part of the FID for alignment, it is expected to perform well without prior knowledge of the frequencies of the spectral peaks.
Chemical shift displacement errors (CSDEs) occur in PRESS-localized MRSI due to the effects of slice-selective localization pulses on metabolite resonances with differing chemical shifts. This can lead to quantification errors in the regions of the volume of interest affected by CSDEs, particularly the edges of the prelocalized volume of interest. Thus, the potential impact of CSDE should still be considered when interpreting MRSI results.
5 CONCLUSIONS
As rapid spatial-spectral MRSI sequences enter more mainstream use, and given that these sequences may induce large amounts of frequency drift, controlling frequency drift–related artifacts will be an important consideration in the future. We have demonstrated the application of time-domain spectral registration to retrospectively estimate and correct frequency drift errors in rapid, high-resolution rosette MRSI data. The method yielded meaningful improvements in both spectral LW and SNR.
FUNDING INFORMATION
This research was supported by the Canadian Institutes of Health Research (PJT-165869 to J.N.), the Natural Sciences and Engineering Research Council (RGPIN-2020-05917 to J.N.), and the Healthy Brains, Healthy Lives fellowship (to S.S).


