Prediction of experimental cardiac magnetostimulation thresholds using pig-specific body models
Abstract
Purpose
Modern high-amplitude gradient systems can be limited by the International Electrotechnical Commission 60601-2-33 cardiac stimulation (CS) limit, which was set in a conservative manner based on electrode experiments and E-field simulations in uniform ellipsoidal body models. Here, we show that coupled electromagnetic-electrophysiological modeling in detailed body and heart models can predict CS thresholds, suggesting that such modeling might lead to more detailed threshold estimates in humans. Specifically, we compare measured and predicted CS thresholds in eight pigs.
Methods
We created individualized porcine body models using MRI (Dixon for the whole body, CINE for the heart) that replicate the anatomy and posture of the animals used in our previous experimental CS study. We model the electric fields induced along cardiac Purkinje and ventricular muscle fibers and predict the electrophysiological response of these fibers, yielding CS threshold predictions in absolute units for each animal. Additionally, we assess the total modeling uncertainty through a variability analysis of the 25 main model parameters.
Results
Predicted and experimental CS thresholds agree within 19% on average (normalized RMS error), which is smaller than the 27% modeling uncertainty. No significant difference was found between the modeling predictions and experiments (p < 0.05, paired t-test).
Conclusion
Predicted thresholds matched the experimental data within the modeling uncertainty, supporting the model validity. We believe that our modeling approach can be applied to study CS thresholds in humans for various gradient coils, body shapes/postures, and waveforms, which is difficult to do experimentally.
1 INTRODUCTION
MRI gradient coils can cause peripheral nerve stimulation (PNS) and cardiac stimulation (CS) through magnetostimulation, in which the electric field (E-field) induced by the time-varying magnetic field creates an extracellular electric potential along nerves (PNS) or myocardial fibers (CS).1-4 This induced potential is a function of the local E-field topology, the relative orientation between the E-field and the fiber direction, and the temporal dynamics of the stimulating E-field. If the electric potential varies significantly in space and time, an action potential (AP) can be initiated. The International Electrotechnical Commission (IEC) 60601-2-33 standard5 limits the maximum switching speed of gradient coils (typically expressed in units of dB/dt) to prevent both PNS and CS. Whereas PNS thresholds are routinely measured as a function of the trapezoidal rise time in healthy volunteers for a specific gradient coil, CS cannot be measured in humans. Instead, the dB/dt CS limit expressed as a function of the trapezoidal rise time is the same for all coils. Although PNS limits are usually more constraining than the IEC CS limit, there are cases in which the CS regulatory limit is set below the level where the subject is expected to experience PNS. This case in which the CS regulatory limit is lower than the PNS limit occurs in high-amplitude gradient systems, such as the human Connectome system,6, 7 for long rise times. Therefore, as the performance of gradient systems keeps improving, the IEC CS limit is becoming a greater limitation for MRI.
The parameters within the IEC CS E-field and thus dB/dt strength-duration curve limit are based on a meta-analysis of electrostimulation studies. These studies measured CS thresholds by placing small electrodes on the myocardium of animals of different species, including dogs, sheep, rabbits, and pigs.8 Because of the variation in electrode size and placement as well as animal species, the data from these studies are extremely disparate. For example, reported chronaxie values range from 0.2 to 7.7 ms.1, 8 In addition, the E-field distribution created by a small electrode placed on the myocardium is significantly different (more focal) than the more distributed E-field induced by an MRI gradient coil (magnetostimulation). To account for these factors, a generous safety margin was needed in the definition of the cardiac safety limit for MRI, resulting in a limit that is safe but, by design, conservative.
To translate the electrostimulation strength-duration curves from animal electrode studies into practical human dB/dt thresholds, electromagnetic (EM) fields were simulated in a human torso model. At the time of the IEC study, computational limitations necessitated using a simplified uniform ellipsoid model of the human torso.2, 8 Today, simulations can be performed in heterogeneous full-body models with representation of the major tissue classes, such as the heart, muscle and lungs, with a spatial resolution of about 1 mm. Those models can either be generic or be created by scanning the subject or animal under study, thus yielding models with EM tissue distribution, shape, and posture reflecting the experimental conditions (subject-specific body model). Studying multiple subject-specific models can inform the range of individual differences and provide a population average.
Only few previous studies have measured cardiac magnetostimulation thresholds in animals using external coils (as opposed to local electrodes). Those experiments include the early measurements of cardiac magnetostimulation thresholds in anesthetized canines by Mouchawar et al.9-14 and our own recent measurements in 10 healthy, anesthetized pigs.15 In these experiments, capacitor banks were discharged into flat spiral or solenoid coils placed close to the animal torso to create strong damped sinusoidal EM fields in the body. The amplitude of the EM field waveform was titrated until cardiac capture was detected on electrocardiogram (ECG), blood pressure, or peripheral oximetry traces. Those measurements alone are informative but insufficient to inform regulatory cardiac safety limits because the shape, posture, size, and some of the cardiac electrophysiological parameters of the animals are different from those of humans. Furthermore, the stimulating coils used in those studies are significantly different from MRI gradient coils. Numerical modeling is a useful tool that can be used to help translate those animal threshold measurements into values that are meaningful to humans scanned with MRI.
We recently proposed a modeling framework for cardiac magnetostimulation16, 17 based on our PNS modeling work18-20 and performed an initial validation of the framework by comparing the canine experiment results of Mouchawar et al.9 and Nyenhuis et al.10 Our modeling approach combines EM field simulations in detailed body models with electrophysiological modeling of the response of electrically excitable cardiac muscle fibers to induced electric potentials. Using this approach in a generic canine body model, we could reproduce the canine CS thresholds measured by Mouchawar et al. and Nyenhuis et al. within 28%.16 However, this comparison was limited by the lack of details about the experimental setup, such as the specifics of the dogs studied and the exact coil position relative to the heart.16 This intrinsically limited the ability of these studies to validate our modeling approach, and more robust validation is needed to build confidence in the model.
The goal of this study is to validate our detailed CS model specific to magnetostimulation and translatable to humans, to improve our prediction and understanding of CS thresholds in MRI. Success in this direction could alleviate the conservative factors in the regulatory limits that arise from a lack of detailed knowledge. To achieve this, we extend our cardiac magnetostimulation modeling pipeline in several essential ways and evaluate its predictive accuracy in pig-specific body models by comparing predictions with CS thresholds previously measured in pigs.15 Additionally, we perform a detailed uncertainty analysis to better understand the confidence interval of our threshold predictions. Extensions of our modeling include generating individualized body models using MR images and modeling transmural cardiac Purkinje fibers specific to pigs. We demonstrate that our predictions and experiments agree within the modeling uncertainty, thus indicating the validity of the model for future study of CS thresholds in humans.
2 METHODS
2.1 Cardiac magnetostimulation modeling pipeline
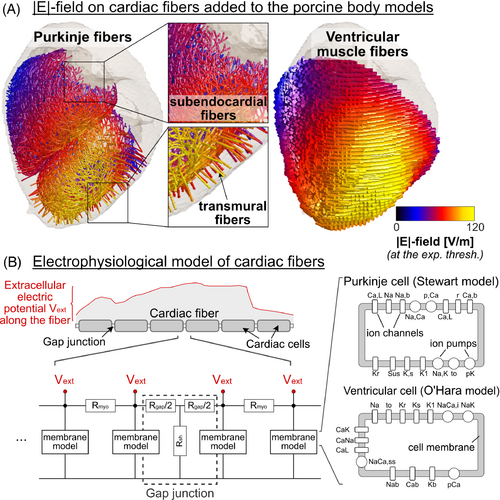
Our cardiac magnetostimulation modeling pipeline16 follows a similar approach as our experimentally validated PNS modeling.18-20 First, we simulate the E-field induced in a hexahedral meshed body model using the low-frequency magnetoquasistatic solver by Sim4Life (Zurich MedTech, Switzerland) at an isotropic spatial resolution of 1 mm3 for a 1-A coil current at the frequency of operation (here: 715 Hz). Next, we project the simulated E-field onto paths of excitable cardiac Purkinje and ventricular muscle fibers (Figure 1A) and integrate the tangential E-field to obtain the electric potential along the fibers. The potential is then modulated in time by the coil current waveform, a 715-Hz damped sinusoid15 in this work. The resulting spatiotemporal potential changes are input into electrophysiological models of the Purkinje and ventricular fibers, which consist of individual cardiomyocytes connected end-to-end by resistive gap junctions21, 22 (Figure 1B). The ventricular and Purkinje fiber networks are not connected in our model and are simulated separately. We use validated membrane models to predict the ion channel dynamics of cardiac Purkinje cells23 and ventricular myocytes,24 which we solve using the Rush-Larsen algorithm25 with a time step of 1.0 μs. The output of these membrane models is the transmembrane voltage change caused by the extracellular potential induced by the stimulating coil. In our modeling, we define the CS threshold as the smallest waveform amplitude that generates an AP in either the Purkinje or ventricular fiber networks. We find this minimum amplitude using a bisection search with an approximate 1% tolerance.
2.2 Measurement of cardiac stimulation thresholds in the porcine heart
In a previous experimental study,15 we measured cardiac magnetostimulation thresholds in 10 healthy, anesthetized pigs (7 males, 3 females, 20–35 kg). These experiments were conducted with the approval and under advice of the Massachusetts General Hospital Institutional Animal Care and Use Committee. We placed the pigs in the left-lateral position on an MRI-compatible fiberglass table with a flat spiral coil fixed underneath (40-cm outer diameter, 38 turns of 2.3-mm diameter insulated copper wire, R = 95 mΩ at 715 Hz, L = 235 μH). The coil was approximately centered on the pig's heart, and its exact position relative to the body was determined from MRI scans depicting both the animal's anatomy and the vitamin E fiducials marking the coil location.
The coil was connected to a high-voltage capacitor bank (C = 210 μF), resulting in a resonant circuit creating a damped sinusoidal current waveform with 715-Hz frequency. The capacitor discharge was triggered at a fixed timing within the cardiac cycle using a variable delay following the R wave of an ECG signal measured by three electrodes placed on the porcine torso. We examined two stimulus timings: (1) immediately after the T-wave (early ventricular diastole) and (2) before the P-wave (late diastole). The amplitude of the stimulating current pulse was slowly increased by increasing the capacitor charging voltage (maximum voltage Umax = 18 kV) until detection of cardiac capture on single-lead ECG, noninvasive blood pressure, and peripheral oximetry traces. The precise value of the CS threshold was then determined by fitting sigmoid functions to the binary cardiac responses (stimulation or lack of stimulation) as a function of the charging voltage. We refer the reader to Klein et al.15 for more information.
2.3 Generation of porcine-specific body models
Immediately after the CS experiment, we moved the pig into a 3T MRI scanner (Connectome; Siemens Healthineers, Erlangen, Germany) without changing its posture on the MRI-compatible fiberglass table. The imaging procedure was completed in 8 of the 10 pigs (pigs 1–4 and 7–10). These eight pigs included Pig 8, for which we found a higher experimental threshold uncertainty compared with the other pigs in the measurement study.15 We acquired a stack of CINE images (1.9 × 1.9 × 3.0 mm3 resolution, 45 slices, 23 timeframes, TE/TR = 4.9/35.4 ms) in the short axis of the heart and fat/water-separated Dixon images (FOV = 500 × 325 × 344 mm3, isotropic resolution = 2 × 2 × 2 mm3, TR/TE1/TE2 = 5.00/1.23/2.46 ms). The Dixon volumes were acquired using multiple table positions to cover the whole body. The MRI data sets were segmented manually and interpolated to 1-mm3 isotropic resolution to create porcine-specific voxel models, as previously described.15 In short, we calculated the fat/water fraction in each voxel of the Dixon images and grouped the voxels into six tissue classes ranging from pure fat to pure water. The pure water voxels were assigned the EM properties of muscle tissue. We then manually segmented the lung, assigned the outermost voxel layer as skin, and labeled low-signal-intensity voxels as low-conductivity tissue. The heart (myocardium, left and right ventricles, atria, and major connecting blood vessels) was segmented manually for the diastolic timeframe of the CINE images and then inserted into the Dixon-based full-body model by inverting the double-oblique transformation of the CINE volume relative to the Dixon dataset. Finally, the different tissue classes were assigned electrical conductivity values from the IT'IS low-frequency material database (v. 4.0).26
2.4 Addition of cardiac fiber paths
We added both cardiac Purkinje and ventricular muscle fibers to the porcine body models using a previously described generative approach.16 To this end, we first created tetrahedral meshes of the CINE-derived heart models using the iso2mesh MATLAB toolbox27 (The MathWorks, Natick, MA, USA) and extracted and smoothed the endocardium and epicardium surfaces. We then used the Ijiri algorithm28 to generate dense networks of Purkinje fibers approximately 1 mm beneath the endocardial surface of the ventricles.16 Because this algorithm is semirandom, we generated five Purkinje fiber network realizations per pig model to assess the variability of the predicted threshold with respect to the Purkinje network topology (see Section 2.5). Unlike humans, pigs possess transmural Purkinje fibers that extend into the myocardium, running more or less perpendicular to the endocardium and the epicardium surfaces.29 This change of orientation from tangential (relative to the endocardium) to radial as the fiber dives into the myocardium creates a kink in the Purkinje fiber trajectory that, as we and others have shown,18, 20, 30 is often a preferred point of stimulation. Therefore, we extended the subendocardial fibers generated by the Ijiri algorithm by adding short segments running perpendicular to the endocardium. More specifically, we randomly selected 500 points along the left and right ventricular subendocardial Purkinje fiber networks and connected them with straight lines to the closest node on the epicardial surface, stopping about 0.2 mm before reaching the epicardium. To assess the effect of the transmural Purkinje fibers on the CS threshold, we predicted and compared thresholds for Purkinje fiber networks with and without transmural fibers in all pigs.
Ventricular cardiomyocytes are aligned to macroscopically resemble a network of 3D fibers (ventricular muscle fibers).31, 32 To model these fibers, we used the validated Bayer algorithm.32 This algorithm uses the Laplace-Dirichlet method to assign basic directions to each node of the heart mesh, pointing from the apex to the base of the heart and from the endocardium to the epicardium surface. Fiber directions were then assigned to each mesh node using mathematical rules based on histological and DTI data,32 such that the ventricular fiber direction changes from +60° on the endocardium to −60° on the epicardium. Finally, streamlines were computed using the MATLAB stream3 function to connect the fiber orientation at each node, yielding smooth, continuous trajectories that reproduce the helicoidal 3D pattern of cardiomyocyte alignment in the heart.
2.5 Uncertainty analysis of cardiac stimulation threshold predictions
| Pig 3 | Pig 7 | ||||||
|---|---|---|---|---|---|---|---|
| Parameter | Baseline Value (x) (Reference) | Estimated Uncertainty (Δx) (Reference) | Sensitivity Coefficient ( | Relative Threshold Uncertainty ) | Sensitivity Coefficient ( | Relative Threshold Uncertainty ) | |
| (I) Electrical tissue conductivity | Myocardium | 0.381 S/m24 | 0.175 S/m24 | −1627 V(S/m)−1 | −3.1% | −840 V(S/m)−1 | −2.4% |
| Muscle | 0.355 S/m24 | 0.199 S/m24 | 1239 V(S/m)−1 | 2.6% | 2280 V(S/m)−1 | 7.5% | |
| Fat | 0.0573 S/m24 | 0.0487 S/m24 | N/A | N/A | N/A | N/A | |
| Blood | 0.660 S/m24 | 0.139 S/m24 | −1606 V(S/m)−1 | −2.4% | −2200 V(S/m)−1 | −5.1% | |
| Low conductivity (cortical bone) | 0.00350 S/m24 | 0.00211 S/m24 | 0 V(S/m)−1 | 0.0% | 0 V(S/m)−1 | 0.0% | |
| Skin | 0.170 S/m24 | 0.113 S/m24 | −529 V(S/m)−1 | −0.6% | 0 V(S/m)−1 | 0.0% | |
| Lung | 0.105 S/m24 | 0.055 S/m24 | 4191 V(S/m)−1 | 2.5% | 3050 V(S/m)−1 | 2.8% | |
| 30% water | 0.1466 S/m13, 24 | 0.0687 S/m13, 24 | 0 V(S/m)−1 | 0.0% | 410 V(S/m)−1 | 0.5% | |
| 50% water | 0.2061 S/m13, 24 | 0.1024 S/m13, 24 | 873 V(S/m)−1 | 1.0% | 780 V(S/m)−1 | 1.3% | |
| 70% water | 0.2657 S/m13, 24 | 0.1401 S/m13, 24 | 997 V(S/m)−1 | 1.5% | 1200 V(S/m)−1 | 2.8% | |
| 90% water | 0.3252 S/m13, 24 | 0.1792 S/m13, 24 | 1076 V(S/m)−1 | 2.1% | 1140 V(S/m)−1 | 3.4% | |
| (II) Electrophysiological parameters (Purkinje fiber model) | Cell diameter | 80 μm32 | 8 μm40 | 44 Vμm−1 | 3.8% | 16 Vμm−1 | 2.1% |
| Cell length | 100 μm19 | 15 μm40 | −3 Vμm−1 | −0.5% | −11 Vμm−1 | −2.8% | |
| Specific membrane capacitance | 2.0 μF/cm221 | 0.3 μF/cm240 | −1765 V(μF/cm2)−1 | −5.7% | −680 V(μF/cm2)−1 | −3.4% | |
| Specific axial resistivity | 162 Ωcm41 | 81 Ωcm | −13 V(Ωcm)−1 | −11.4% | −6 V(Ωcm)−1 | −8.0% | |
| Gap junction resistance | 19 890 Ω19 | 9945 Ω | −0.071 VΩ−1 | −7.6% | −0.024 VΩ−1 | −4.0% | |
| Fast Na conductance (gNa) | 131 nS/pF21 | 66 nS/pF | 24 V(nS/pF)−1 | 16.6% | 15 V(nS/pF)−1 | 16.0% | |
| Inward rectifier K conductance (gK1) | 0.065 nS/pF21 | 0.033 nS/pF | −4077 V(nS/pF)−1 | −1.4% | −2460 V(nS/pF)−1 | −1.3% | |
| Extracellular Na concentration (Nao) | 140 mM21 | 70 mM | 7 VmM−1 | 5.2% | 3 VmM−1 | 4.0% | |
| Extracellular K concentration (Ko) | 5.4 mM21 | 2.7 mM | 180 VmM−1 | 5.2% | 89 VmM−1 | 4.0% | |
| Extracellular Ca concentration (Cao) | 2.0 mM21 | 1.0 mM | −90 VmM−1 | −1.0% | −80 VmM−1 | −1.3% | |
| (III) Coil position | Shift in x-direction | 0 mm | 10 mm | 93.5 Vmm−1 | 10.0% | 69.4 Vmm−1 | 11.5% |
| Shift in y-direction | 0 mm | 10 mm | −56.5 Vmm−1 | −6.1% | −14.6 Vmm−1 | −2.4% | |
| Shift in z-direction | 0 mm | 10 mm | −29.1 Vmm−1 | −3.1% | 11.3 Vmm−1 | 1.9% | |
| (IV) Purkinje fiber paths | Five semirandom networks | N/A | N/A | N/A | 3% | N/A | 4% |
| (V) Spatial resolution | Voxel size | 1 mm isotropic | 0.75–10.0 mm isotropic | N/A | ≤ 4% | N/A | ≤ 12% |
| (VI) Temporal resolution | Time step | 1.0 μs | 0.1–2.5 μs | N/A | ≤1% | N/A | ≤ 1% |
| Combined threshold uncertainty () (including Parameters I–IV) | 27% | 26% | |||||
| Combined uncertainty of E95 in the heart (including Parameters I and III) | 14% | 16% | |||||
| Combined uncertainty of dB/dt in the heart (including Parameter III) | 12% | 12% | |||||
- Abbreviations: E95, 95th percentile electric field; N/A, not available.
This uncertainty analysis was performed for porcine body models 3 and 7.
We investigated the effect of the electrical conductivity of the tissue classes considered in our segmentation (myocardium, muscle, fat, blood, bone, skin, lung, 30% water, 50% water, 70% water, 90% water) by changing those values one at a time by dx = +10% and dx = −10%, while keeping all other parameters constant at their basal values. Assessment of the impact of coil position uncertainties in the y-, z-direction (in the plane of the pig table) and x-direction (perpendicular to the table) was performed by moving the coil in the E-field simulations by +10 and −10 mm in each direction. A similar strategy was used for assessment of uncertainties with respect to parameters of the Purkinje electrophysiology model (i.e., cell diameter and length), cell membrane capacitance, axial resistivity, gap junction conductance, fast Na and K channels conductance, and extracellular Na, Ca, and K concentrations. We also assessed the impact of the subendocardial Purkinje fiber network geometry by computing CS thresholds for five semirandom network realizations for all pig models. Our previous work on CS indicated that the Purkinje network is more sensitive to stimulation than the ventricular muscle fibers16—a result that we reproduced in this work (see Section 3). Therefore, we did not calculate model uncertainties with respect to parameters of the ventricular fiber model.
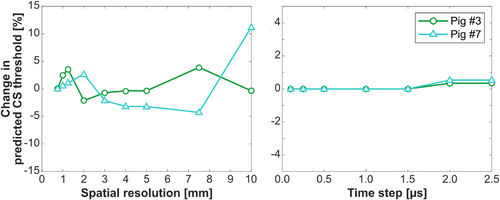
We also analyzed uncertainties related to numerical approximations (i.e., the spatial resolution of the porcine body models [isotropic voxel size between 0.75 and 10 mm] as well as the temporal resolution of the EP model solve [time steps between 0.1 and 2.5 μs]).
3 RESULTS
Figure 2 shows the porcine-specific MRI-derived body models and simulated E-field distributions in the whole body and the heart for all eight animals with imaging data. The E-fields are plotted for the current at the experimental CS threshold measured during early diastole (E-field at threshold). The 95th percentile cardiac E-field at threshold varies from 72 to 110 V/m in the eight pigs of this study.
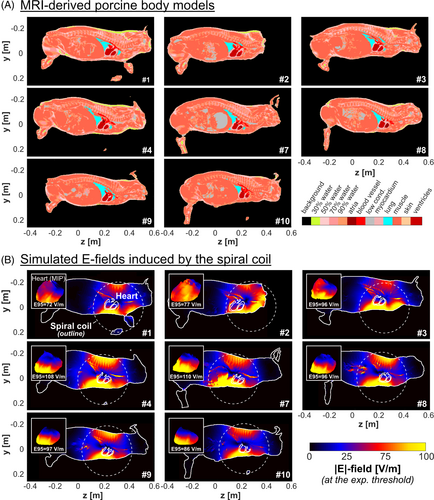
Figure 3 shows one of the five subendocardial Purkinje fiber networks along with the transmural fibers modeled for each pig. The E-field magnitude produced by the current at threshold is overlaid. In Pigs 4–10, the E-field is highest close to the apex in the left ventricle, which is the heart location closest to the coil. In Pigs 1–3, the coil was placed slightly off the heart center (as indicated in Figure 2B), resulting in a greater E-field in the right ventricle than in the left ventricle. Consequently, the predicted site of first stimulation is in the Purkinje fiber network in the right ventricle for Pigs 1–3 but in the left ventricle for the other pigs (green stars on Figure 3).
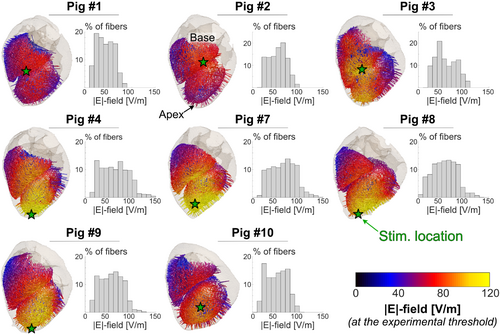
Figure 4 shows that, for all pigs, the effective CS threshold is set by the Purkinje fibers, with ventricular fiber thresholds being at least 5 times higher. This echoes our previous modeling results16 as well as findings from defibrillation threshold measurements.33 In the following, all predicted CS thresholds refer to Purkinje fiber thresholds.
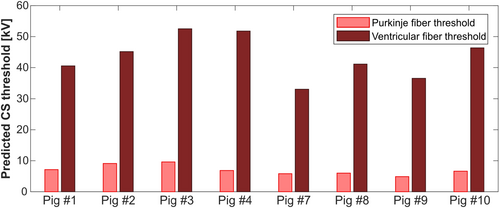
Figure 5 compares experimental and predicted CS thresholds in units of capacitor voltage (kV) for the eight pigs modeled. The predicted thresholds are shown as the average of five Purkinje fiber network realizations for each porcine model. The error bars show the estimated modeling uncertainty of 27%, derived from our uncertainty analysis in Pigs 3 and 7. For Pigs 1 and 2, the predicted thresholds are 43% and 30% higher than the experimental thresholds, respectively. For all other pigs, the deviations between predicted and measured thresholds range between −10% and +24%. The normalized RMS error (NRMSE) across all eight pigs is 19% for measurements during early diastole, and 11% for measurements during late diastole.
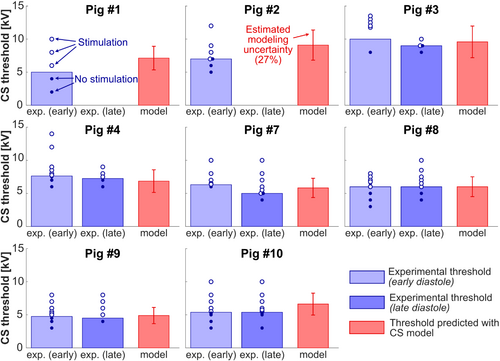
Figure 6 shows the same data as correlation plots between measured and predicted thresholds. Here the dashed red lines indicate the 1-sigma uncertainty boundaries (based on the modeling uncertainty analysis). All points fall within the 1-sigma modeling uncertainty region, except for slight deviations for Pigs 1 and 2, indicating the validity of our model. No significant difference was detected between model predictions and measurements at the p = 0.05 significance level (paired t-test).
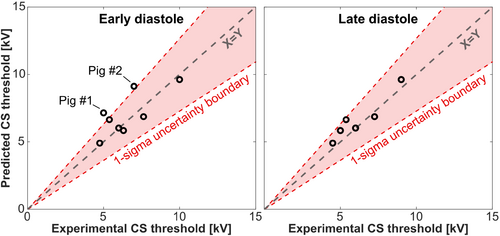
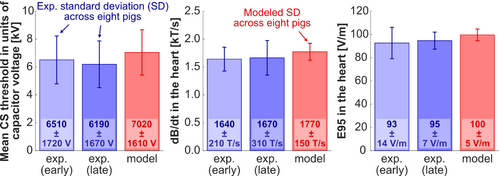
Figure 7 shows average experimental and predicted CS thresholds across the eight pigs in units of capacitor voltage, peak dB/dt at the center of the heart, and 95th percentile E-field in the heart. The dB/dt and 95th percentile E-field values in the porcine heart were derived from EM field simulations scaled to the damped sinusoidal waveform amplitude at the experimental and predicted thresholds. In the experiments,15 we measured the average CS threshold of the eight pigs to be 6.51 ± 1.72 kV for stimulation during early diastole, and 6.19 ± 1.67 kV for stimulation during late diastole. The average predicted voltage threshold was close to those values, at 7.02 ± 1.61 kV. The SD on these plots represents the interindividual variability of CS thresholds in the different pigs, which should not be confused with the experimental uncertainty (test–retest variability of 500 V15) or the modeling uncertainty (27%). Indeed, thresholds vary from pig to pig because of variability in body weights/shapes/postures, the position of the coil relative to the heart, as well as other experimental factors.15 The predicted and experimental variabilities of the capacitor voltage thresholds are similar (predicted variability = 23%, experimental variability at early diastole = 26%, and late distole = 27%), which indicates that our modeling reproduces the normal variability of CS thresholds in different pig anatomies and for coil location/pig posture variations. This can also be seen in Figure 6, which shows that the experimental threshold variability between 5 and 10 kV is overall well reproduced by our modeling.
that are estimated in Pigs 3 and 7 for each model parameter. The greatest sources of uncertainty, explaining about 80% of the total uncertainty, derive from the sodium channel conductance gNa in the Stewart Purkinje cell model,23 the axial resistivity, and the coil position relative to the porcine body in the x-direction (the proximal-distal direction). The total modeling uncertainty estimated using Eq. (1) is 27% for Pig 3 and 26% for Pig 7 (average total modeling uncertainty 27%). Both the individual and total uncertainties are similar for Pigs 3 and 7. As indicated in Table 1, modeling methods with increasing complexity (i.e., dB/dt, E-field, and quantitative thresholds in units of capacitor voltage, in this order), are associated with increasing modeling uncertainty, as they use an increasing number of model parameters.
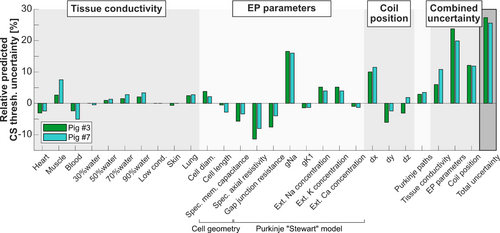
Figure 9 shows the variability of predicted CS thresholds resulting from changes in spatial and temporal model resolutions and indicates good robustness (variability <4%) of the model when the isotropic spatial resolution is below 5 mm and the temporal resolution is below 2.5 μs.
4 DISCUSSION
In this work, we evaluated the accuracy of our previously published CS modeling framework16 by comparing CS thresholds predicted in animal-specific body models to experimental thresholds measured in anesthetized pigs.15 Briefly, the modeling follows those steps: (1) generation of pig-specific body models from MRI CINE and Dixon volumes acquired at multiple bed positions, (2) prediction of electric potentials induced along excitable cardiac Purkinje and ventricular muscle fibers added to the porcine models, and (3) electrophysiological modeling of the cardiac fiber response to obtain the cardiac AP generation thresholds. Our approach predicts animal-specific CS thresholds with an average error of 19% (NRMSE), which is smaller than the modeling uncertainty (27%) and therefore an acceptable accuracy. Moreover, the modeled thresholds for individual animals are equally distributed below and above that animal's measured threshold (i.e., the model does not appear to have a systematic bias, as is visible in Figure 6). We point out, however, that a more refined characterization of the bias of our model (i.e., whether it systematically overestimates or underestimates the experimental thresholds) would require inclusion of more animals. Also, this study does not examine how large a “safety factor” is needed for the predicted thresholds to be a suitably conservative limit. Both require more detailed future work.
In this work, we extended our previous modeling pipeline in three critical ways. First, we created pig-specific body models based on MR images of each anesthetized pig acquired immediately after the stimulation experiment in the same posture and position.15 We segmented the whole-body MRI Dixon fat/water volumes and CINE images of the heart to obtain highly individualized porcine body models with the correct body contour, relative placement of the heart and lungs, lung volume, and heart size and position in the chest. Second, the Dixon images helped us replicate the experimental coil placement in the modeling. Accurate modeling of the anatomy relative to the coil location was crucial to predict the CS threshold in each pig. Together, the individualized approach yielded a more precise validation of our modeling than could have been obtained from comparing CS thresholds averaged over all the animals to predictions in a single generic porcine body model. Indeed, the variability of CS thresholds across all pigs was about 25% (SD divided by the average threshold value), which, combined with the modeling uncertainty (27%), would have severely limited the statistical power to detect significant differences between predicted and experimental thresholds. Instead, using a paired t-test obtained from comparing experimental values to pig-specific threshold estimates, we were able to reject the hypothesis of significant differences between predicted and experimental thresholds at the p = 0.05 level.
The third modification to our modeling pipeline involved the inclusion of transmural Purkinje fibers through the myocardium, a feature unique to pigs and not present in humans,29, 34 and therefore not included in the Ijiri subendocardial Purkinje network generation algorithm.28 This anatomical difference is important, as our modeling showed that Purkinje fibers have lower stimulation thresholds than the ventricular myocardium, possibly due to their larger diameters,35 their more complex fiber path geometry containing many sharp bends,36 and different ion channel dynamics.37-39 We hypothesized that the presence of transmural Purkinje fibers could result in lower CS thresholds, as stimulation often occurs at sharp kinks along an excitable fiber,20 which is the case at locations where Purkinje fibers dive into the myocardium. Our modeling showed that adding transmural fibers to the subendocardial Purkinje fiber networks indeed lowered CS thresholds by as much as 9% in one pig (Pig 9) compared with thresholds predicted in subendocardial Purkinje networks without transmural fibers. In all other pigs, the addition of transmural Purkinje fibers had an effect smaller than 4% on the predicted CS thresholds. Furthermore, we found that random variations in the subendocardial Purkinje networks (modeled using the semirandom algorithm by Ijiri et al.28) only mildly affected predicted thresholds (3% threshold change for Pig 3, 4% for Pig 7; Table 1). Taken together, those results suggest that the exact Purkinje fiber geometry within this single rule-based Purkinje network generator only has a moderate impact on the CS threshold estimate, which is likely because the Purkinje network is dense and therefore samples most E-field locations and orientations on the myocardium. If the network was sparse, the individual animal's exact fiber topology would likely have to be captured precisely to yield accurate CS threshold estimates.
To evaluate the uncertainty of our modeling approach, we assessed the variability of predicted CS thresholds by individually varying each important model parameter one at a time. This analysis revealed that the most sensitive model parameters are, in decreasing order of importance, the sodium channel conductance gNa in the Stewart Purkinje cell model,23 the axial resistivity, and the coil position relative to the porcine body in the x-direction (proximal-distal direction). Combined, these parameters account for about 80% of the total model uncertainty. Propagating the uncertainties of all parameters through the model resulted in a total predicted CS threshold uncertainty of 27% in Pig 3 and 26% in Pig 7, which, in light of the complexity of the model, appears acceptable and allows statistically meaningful predictions and comparisons with experiments.
One limitation of the CS model validation presented here is that it was performed at a single frequency (715 Hz), which was set by the combination of the stimulating coil inductance and the capacitance of the capacitor bank used to power the coil in the experimental study.15 This prevented us from validating the model's ability to predict the entire strength-duration curve that quantifies the CS threshold as a function of rise time (or its reciprocal, frequency) of the stimulating waveform. Frequency-dependent CS threshold predictions are important to characterize the gradient coil across the range of rise times commonly used in MRI sequences. To address this, we plan to conduct further validation measurements with multiple frequencies. The stimulation frequency can be raised or lowered by adjusting either the total capacitance of the capacitor bank or the inductance of the coil.
Another limitation of the model validation is that it does not account for the differences between cardiac excitability in early and late diastole periods. In the early diastole phase, the myocardium is closer to the refractory period than in the late diastole phase, which may cause it to be harder to stimulate and therefore have an elevated stimulation threshold. Our experimental results support this notion, as thresholds measured in the early diastole phase were found to be greater than those measured in late diastole in three of six pigs (early/late diastole thresholds were indistinguishable or within the 500-V experimental test–retest variability in the remaining three pigs; Figure 5). The relatively small number of pigs used in our study prevents us from making any statistically significant statement about this, however, as a more systematic characterization of this effect would likely require more than 20 pigs. Finally, we point out that we model the heart anatomy and E-fields during only a single phase of diastole (by segmenting the diastolic timeframe of the CINE images and computing the E-field map), and our modeling does not currently account for electrophysiological differences in the heart during different phases of the cardiac cycle, which is why only one diastolic threshold was simulated for each pig.
Finally, our CS modeling does not currently account for possible effects of anesthesia on cardiac electrophysiology and, therefore, on the CS threshold. This would be difficult to implement, and we expect the anesthesia-induced changes in sodium and potassium currents reported in the literature to have a small-to-moderate (2%–8%) effect on the CS thresholds. Experiments on isolated guinea pig cardiomyocytes have shown that isoflurane, the anesthetic agent used in our experiments,15 can alter sodium and potassium currents by as much as 25%: Weigt et al. found that 1.0 mM of isoflurane injection decreased the sodium channel current in guinea pig cardiomyocytes by up to 21%,40 while Stadnicka et al. reported a 25% variation in the potassium current under 2.5 mM isoflurane for the same cell preparation.41 In our modeling sensitivity analysis, we found that a 10% decrease in sodium conductance had a 4% effect on CS thresholds (thresholds increased) and that a 10% increase in potassium conductance had a 1% impact on thresholds (thresholds increased). By combining the experimental values of Weigt et al. and Stadnicka et al. with our modeling results, we therefore expect isoflurane to have a 2%–8% effect on CS thresholds, which is a low-to-moderate effect size comparable to our test–retest experimental variability (500 V over a 6000 V threshold yields an 8% test–retest error).
Our validation study is limited to a single non-human species, the pig, a commonly used animal model of the human cardiovascular system.42, 43 Cardiac Purkinje fibers of pigs and humans have similar diameters (˜80 μm35, 44) and membrane capacitance (˜2.0 μF/cm223, 45). As mentioned previously, the presence of transmural Purkinje fiber extensions in pigs is a major difference between the porcine and human cardiac anatomy; however, we were able to include this difference in our modeling. In future work, we hope to use the present model to study CS threshold variations in a variety of human body types at differing positions and poses in the MRI gradient coil. Our ultimate goal is to use such detailed characterization of normal CS threshold variations to inform safe, but not overly conservative, CS limits applicable to a wide range of clinical situations. The ultimate regulatory CS limit should include a safety margin accounting for the uncertainty of extending the porcine-validated modeling pipeline to humans as well as physical and physiological variations that are not included in our simulation pipeline and may be difficult to model, such as variations of cardiac electrophysiology caused by various disorders, scar tissue, and medications. The choice of this safety margin should be taken in a consensus manner, reflecting multiple data sources and the input of various stakeholders such as clinicians, MRI physicists, and regulatory experts, and is therefore outside the scope of this paper.
5 CONCLUSIONS
We extended our previous cardiac magnetostimulation modeling pipeline to enable direct comparison of the model predictions and experimental CS thresholds. Using subject-specific Dixon and CINE MRI as input, the model reproduced the experimental CS thresholds with a 19% average error (NRMSE) in the eight pigs modeled. A systematic uncertainty analysis of the most important model parameters indicated that the total uncertainty of our modeling is 27%. Future work will use the model to predict CS thresholds in a variety of human body models, which may help inform safety limits for switching magnetic gradient fields to support fast and safe state-of-the-art MRI in humans.
ACKNOWLEDGMENTS
Research reported in this publication was supported by the National Institutes of Health (R01 EB028250, P41 EB030006, R01 HL151704, and R01 HL159010). The content is solely the responsibility of the authors and does not necessarily represent the official views of the National Institutes of Health. Open Access funding enabled and organized by Projekt DEAL.


