Dynamic lung water MRI during exercise stress
Abstract
Purpose
Exercise-induced dyspnea caused by lung water is an early heart failure symptom. Dynamic lung water quantification during exercise is therefore of interest to detect early stage disease. This study developed a time-resolved 3D MRI method to quantify transient lung water dynamics during rest and exercise stress.
Methods
The method was evaluated in 15 healthy subjects and 2 patients with heart failure imaged in transitions between rest and exercise, and in a porcine model of dynamic extravascular lung water accumulation through mitral regurgitation (n = 5). Time-resolved images were acquired at 0.55T using a continuous 3D stack-of-spirals proton density weighted sequence with 3.5 mm isotropic resolution, and derived using a motion corrected sliding-window reconstruction with 90-s temporal resolution in 20-s increments. A supine MRI-compatible pedal ergometer was used for exercise. Global and regional lung water density (LWD) and percent change in LWD (ΔLWD) were automatically quantified.
Results
A ΔLWD increase of 3.3 ± 1.5% was achieved in the animals. Healthy subjects developed a ΔLWD of 7.8 ± 5.0% during moderate exercise, peaked at 16 ± 6.8% during vigorous exercise, and remained unchanged over 10 min at rest (−1.4 ± 3.5%, p = 0.18). Regional LWD were higher posteriorly compared the anterior lungs (rest: 33 ± 3.7% vs 20 ± 3.1%, p < 0.0001; peak exercise: 36 ± 5.5% vs 25 ± 4.6%, p < 0.0001). Accumulation rates were slower in patients than healthy subjects (2.0 ± 0.1%/min vs 2.6 ± 0.9%/min, respectively), whereas LWD were similar at rest (28 ± 10% and 28 ± 2.9%) and peak exercise (ΔLWD 17 ± 10% vs 16 ± 6.8%).
Conclusion
Lung water dynamics can be quantified during exercise using continuous 3D MRI and a sliding-window image reconstruction.
1 INTRODUCTION
Cardiogenic pulmonary edema, or lung water, is the result of a pressure-driven intravascular fluid transudation into the pulmonary interstitium which causes dyspnea. Lung water is a key feature in both acute decompensated heart failure due to, for example, myocardial ischemia or mitral valve dysfunction, as well as in chronic progressive heart failure.1 A common early symptom of chronic progressive heart failure is shortness of breath and exercise intolerance, which is attributed to an exercise-induced abrupt increase in pulmonary blood pressure that triggers extravascular lung water accumulation which is not present at rest.2, 3 A clinical test to quantify lung water during exercise is therefore of interest to unmask latent heart failure and enable earlier diagnosis.4-6
MRI has recently been proposed as a promising method to noninvasively quantify lung water.4, 7-10 MRI addresses some limitations of current clinical lung water assessments, which include invasive cardiac catheterization, semi-quantitative ultrasound, or ionizing radiation exposing computed tomography and x-ray.11-13 Previous work has found that lung water MRI can depict a regional redistribution of edema,9, 14 and is associated with myocardial energetic deficits in heart failure with preserved ejection fraction (HFpEF).8 These previous studies acquired images at rest or shortly after exercise, but transient changes in lung water during exercise is yet to be imaged using MRI. In this study, we develop an MRI method to quantify time-resolved lung water dynamics. We apply our method to healthy subjects and patients with compensated heart failure to quantify lung water imaged during rest, exercise stress, and in the transitions between rest and exercise, and we further validate it in a porcine model of extravascular lung water accumulation through dynamic induction of mitral regurgitation.
2 METHODS
2.1 Lung water image acquisition
Imaging was performed on a contemporary prototype 0.55 T MRI system (MAGNETOM Aera Siemens Healthcare, Erlangen, Germany) with 18-channel spine and 6-channel body phased-array receiver coils retuned for 0.55 T.15
We acquired data continuously over the course of 10 min using a prototype self-gated 3D free-breathing stack-of-spirals proton density weighted UTE gradient echo sequence,16 and reconstructed images with a 90-s temporal resolution. Typical imaging parameters were TE/TR/θ = 0.56 ms/9 ms/1°, 831 in-plane golden angle spiral interleaves, 5.0-ms spiral readout, 3.5-mm isotropic resolution, 450 mm × 450 mm × 252 mm FOV). Superior–inferior respiratory navigator readouts were acquired every 200 ms. FOV covered the entire lungs, and data were acquired in the coronal view. The capability of this sequence to quantify water density in a phantom with varying concentrations of water and deuterium oxide has previously been validated and this sequence has been used to depict a gravity-induced redistribution of lung water in healthy subjects.9
2.2 Dynamic lung water image reconstruction
We derived time-resolved 3D lung water density (LWD) maps from the 10-min continuous acquisition using a motion corrected sliding-window image reconstruction (Figure 1).17-19 The image reconstruction and image processing pipeline were implemented in Matlab using the open source Gadgetron image reconstruction framework on the backend,20 and were performed on a dual-socket AMD EPYC 7H12 64-Core Processor, 1024 GB RAM, 4× NVIDIA A100 (80GB vRAM). Open source code for the image reconstruction and analysis pipeline is available at https://github.com/NHLBI-MR/dynamic_lung_water.
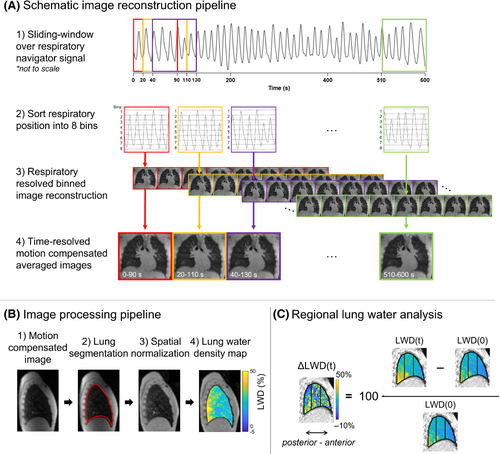
Twenty-six time-resolved images were derived by averaging the motion corrected respiratory phases from each temporal window, yielding higher SNR compared to the respiratory-resolved images. All 208 images were registered to the end-expiratory image in the first reconstructed window, using a 3D image registration.18, 19 Image registration and subsequent averaging was performed on magnitude images. An end-expiratory reference image was chosen as this is the most stable phase across multiple respiratory cycles.22 The Jacobian determinant of the motion fields (det(JT)) was used to compensate for changes in proton density of the lung parenchymal tissue between inspiration and expiration.23, 24 Compensation with (det(JT)) was performed by multiplying each registered respiratory resolved image by its corresponding (det(JT)) before averaging into motion corrected images for each timeframe. The performance of the motion correction and Jacobian (det(JT)) compensation is illustrated in Figure S2.
We calculated apparent SNR in the central slice of images acquired at rest, both in the respiratory-resolved images before motion correction and in the corresponding averaged motion corrected images. Apparent SNR was calculated as the ratio between mean parenchymal signal intensity to the standard deviation of the background signal, across all phases.
2.3 Quantification of lung water dynamics
2.4 Cardiovascular imaging
Cardiac short-axis cine stacks covering the whole heart were acquired to measure left ventricular volumes, using a free-breathing balanced SSFP (bSSFP) sequence with binned retrospective electrocardiograph (ECG)-gating (TE/TR/θ = 1.35 ms/3.3 ms/80°, 1.9 × 1.9 × 8 mm reconstructed resolution, 360 × 323 mm FOV).26 End diastolic and end systolic left ventricular endocardial and epicardial boarders were automatically delineated in the short-axis cine images using the freely available software Segment (Medviso AB, Lund, Sweden),27 from which end diastolic and end systolic volumes, stroke volume, ejection fraction, and left ventricular mass were derived.
Aortic flow was measured using a real-time through-plane phase contrast sequence with a golden-angle spiral trajectory and flow gating with typical parameters TE/TR/θ = 1.78 ms/9.84 ms/15°, FOV 346 × 346 mm, 2.7 × 2.7 × 8 mm spatial resolution, 39.4 ms temporal resolution, and VENC 150–200 cm/s to avoid aliasing.28 In the pigs, aortic flow was measured using a retrospective ECG-gated free-breathing phase contrast gradient echo sequence with TE/TR/θ = 4.44 ms/7.14 ms/30°, VENC 150–200 cm/s, FOV 330 × 310 mm, spatial resolution 1.7 × 1.7 × 8 mm, and bandwidth 299 Hz/Px.
Time-resolved contouring and background phase correction of the aortic root was performed semi-automatically in the phase contrast flow images, from which stroke volume and cardiac output were derived. Mitral regurgitant fraction was calculated as the percentual discrepancy between stroke volume quantified using flow and cine images. All cardiovascular segmentations were manually corrected as necessary (by F.S., 10 y of experience).
2.5 Exercise stress imaging
Institutional Review Board approval and written informed consent from all study participants was obtained (ClinicalTrails.gov identifier NCT03331380). We prospectively included 15 healthy human subjects and two patients with compensated heart failure (1 with HFpEF and 1 with reduced ejection fraction [HFrEF]) who underwent cardiopulmonary imaging at rest and during exercise stress using an MRI-compatible supine pedal ergometer (Cardio Step Module, Ergospect, Innsbruck, Austria). Ergometer resistance started at 60 W, and was manually increased by the scanner operator if needed.
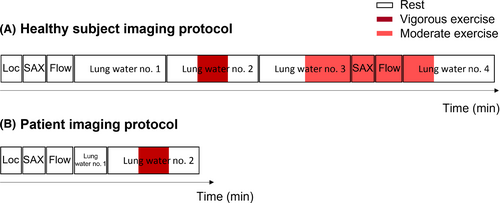
- a) Localizers
- b) Short-axis cine at rest
- c) Real-time aortic flow at rest
- d) Lung water acquisition no. 1. Rest for 10-min.
- e) Lung water acquisition no. 2. Vigorous exercise test starting with 3 min at rest, transitioned to maximal exercise targeting maximum heart rate calculated by age (220-age) by pedaling as fast as possible for 2–3 min, followed by rest again.
- f) Lung water acquisition no. 3. Moderate exercise with stride 60 steps/min, imaging the transition to exercise after 5 min of rest.
- g) Short-axis cine at moderate exercise
- h) Real-time aortic flow at moderate exercise
- i) Lung water acquisition no. 4. Transition to rest after 3 min of moderate exercise. The moderate exercise had been sustained for ∼15–20 min at the onset of this image acquisition.
Patients with heart failure underwent an abbreviated protocol consisting of a short-axis cine, real-time aortic flow, and 2-min lung water acquisition at rest (yielding two reconstructed timeframes), followed by the 10-min vigorous exercise test (acquisition no. 2 above). Imaging protocols for healthy subjects and patients are illustrated in Figure 2.
2.6 Lung volume analysis
To illustrate the variation in LWD with respiratory phase, we derived LWD from images registered to end-inspiration and end-expiration in healthy subjects at rest (acquisition no. 1). Image reconstruction and processing, including averaging of motion corrected and Jacobian (det(JT)) compensated respiratory-resolved images, lung segmentation, coil shading correction, and LWD calculation, were performed separately for the end-inspiratory and end-expiratory images.
LV, LWV, and LWD quantified in the first timeframes from acquisition no. 3 (rest to moderate exercise) and acquisition no. 4 (moderate exercise to rest) were compared, which are expected to have different lung volumes as no. 3 was registered to an image acquired at rest and no. 4 to an image acquired during exercise. Additionally, we include an example of respiratory-resolved LWD derived directly from respiratory-resolved images at rest from a single healthy subject, before motion-correction and averaging.
2.7 Porcine dynamic lung water model
Animal experiments were approved by the local Institutional Animal Care and Use Committee and conducted per contemporary guidelines from the National Institutes of Health.
Pulmonary vasodilation, a normal physiological response to exercise, results in an overall increase in pulmonary blood volume, meaning that the measured lung water accumulation in healthy subjects is expected to be predominantly intravascular. To validate our ability to quantify pathological extravascular lung water dynamics, we used a controlled porcine model of acute severe mitral regurgitation in five female pigs. The mitral regurgitant jet is expected to result in increased filling pressures, leading to the development of lung water.29 Porcine experiments were performed in a combined x-ray/0.55 T MRI cardiovascular catheterization laboratory, and blood pressures were recorded using fluid-filled catheters connected to the custom, open source, hemodynamic recording system Physiological Recording in MRI Environment system.30
Mitral regurgitation was dynamically induced inside the MRI by applying tension on a suture across the anterior mitral valve leaflet while imaging.29 The transcatheter suture placement across the mitral valve was performed under x-ray guidance, using a technique derived from LAMPOON used in patients to traverse and modify the anterior mitral valve leaflet.31 In short, a guidewire was advanced from the femoral artery and positioned through the base of the leaflet, and then snare-retrieved to form a loop around the leaflet from base to tip (Figure 3A,B). The guidewire was subsequently exchanged for a suture which was externalized through the femoral vascular sheath, enabling a dynamic induction and relief of mitral regurgitation by varying the tension applied on the suture.
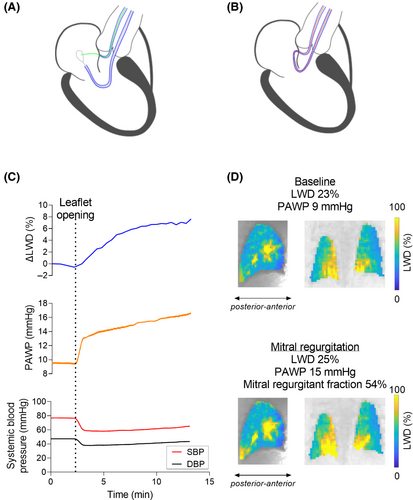
Animals were imaged for 10 min, opening the mitral valve leaflet ∼2 min into the image acquisition. Short-axis-stack cine and aortic flow images were acquired before and after lung water imaging, to measure cardiac output and mitral regurgitant fraction. To corroborate the impact of the dynamic lung water model, we recorded pulmonary arterial wedge pressure (PAWP) and femoral arterial systolic and diastolic blood pressures (SBP/DBP) simultaneously to imaging. Peak dLWD/dt without sliding mean was calculated in the pig data, to determine if it occurred in conjunction with the opening of the mitral valve.
2.8 Statistical analysis
Statistical analysis was performed using GraphPad Prism 9 (GraphPad Software, Inc, La Jolla, CA). Continuous variables were reported as mean ± SD. Paired t-test were used to compare quantitative physiological metrics between rest and exercise, and between end-expiratory vs end-inspiratory image reconstructions. Regional LWD analysis were compared using one-way analysis of variance (ANOVA). Pearson R correlation between LWD and cardiac output were reported. Threshold for statistical significance was p < 0.05. Statistical significance was not measured between healthy subjects and patients, due to the limited number of included patients (n = 2).
3 RESULTS
Of the 15 included healthy subjects, 2 were excluded due to ergometer malfunction related issues, leaving 13 subjects included for analysis (27 ± 5 y, 3 women). Two timeframes acquired during moderate exercise were excluded from one time-resolved lung water image due to a spike artifact originating from external hardware. Dynamic LWD imaging was feasible during exercise stress in the patients (n = 2, 61 ± 4 y, one female), and during induction of mitral regurgitation in all animals (n = 5, 40 ± 2 kg). Heart rate monitoring was challenging during exercise due to uninterpretable ECG readings related to motion. Heart rates are therefore only reported from ECG-readings at rest, and measured during exercise from the real-time flow acquisitions, at moderate exercise. Real-time flow was not measured in two healthy subjects, and short-axis images were not acquired in one healthy subject, for technical reasons. The MRI-compatible ergometer setup is shown in Video S1.
3.1 Image reconstruction and image processing
Time-resolved dynamic LWD maps were successfully derived in both patients and in 12 of the 13 healthy subjects included for analysis. Image registration failed in one subject due to excessive motion during exercise, but performed well in the remaining 12 subjects, as assessed qualitatively. Some motion blur was, however, observed in timeframes acquired over the transition from rest to exercise. The apparent SNR in the lung parenchyma was 4.0 ± 0.5 times higher in the averaged motion corrected images compared to the respiratory resolved images prior to motion correction (13.4 ± 3.0 vs 3.3 ± 0.7, respectively). Video S2 provides the 208 respiratory-resolved images, 208 registered respiratory-resolved images, and 26 time-resolved images with higher SNR. The total time required to derive dynamic LWD maps from a 10-min acquisition was 105 ± 1.6 min (respiratory-resolved image reconstruction 60 ± 0.4 min, motion correction 43 ± 1.6 min, and image processing 1 ± 0.06 min).
3.2 Exercise stress imaging
Healthy subject and patient characteristics and exercise stress imaging results are summarized in Tables 1 and 2, respectively. Table 3 summarizes the measured LWD, ΔLWD, LWV, and ΔLWV measured from the four different lung water image acquisitions.
| Rest | Moderate exercise | P-Value | |
|---|---|---|---|
| Heart rate (bpm) | 60 ± 7.7 | 112 ± 19 | p < 0.0001* |
| Cardiac output (L/min) | 4.6 ± 1.5 | 7.9 ± 2.3 | p < 0.0001* |
| LV-EDV (ml) | 167 ± 30 | 155 ± 38 | p = 0.0368* |
| LV-ESV (ml) | 73 ± 26 | 58 ± 28 | p= 0.0020* |
| LVM, end diastole (g) | 104 ± 24 | 104 ± 24 | p = 0.76 |
| LVM, end systole (g) | 104 ± 24 | 104 ± 24 | p = 0.64 |
| Global LWD (%) | 25 ± 3.8 | 27 ± 4.0 | p = 0.0001* |
| LWV (L) | 0.40 ± 0.09 | 0.43 ± 0.09 | p = 0.0001* |
| Posterior LWD (%) | 31 ± 4.8 | 32 ± 4.1 | p = 0.21 |
| Mid LWD (%) | 23 ± 3.2 | 25 ± 4.2 | p = 0.0002* |
| Anterior LWD (%) | 19 ± 3.5 | 21 ± 4.0 | p = 0.0010* |
- Note: Lung water densities were measured in the image transitioning to moderate exercise after 5 min at rest (acquisition no. 3). Heart rate and cardiac output were derived from the real-time flow images. Left ventricular volumes and mass were measured from short-axis cine images. P-Values are from paired t-tests, * designates a significant difference (P < 0.05).
- Abbreviations: LV-EDV, left ventricular end diastolic volume; LV-ESV, left ventricular end systolic volume; LVM, left ventricular myocardial mass; LWD, lung water density; LWV, lung water volume.
| Heart failure with preserved ejection fraction (n = 1) | Heart failure with reduced ejection fraction (n = 1) | |||
|---|---|---|---|---|
| Rest | Peak exercise | Rest | Peak exercise | |
| Global average LWD (%) | 21 | 26 | 35 | 37 |
| LWV (L) | 0.32 | 0.40 | 0.46 | 0.50 |
| ΔLWD (%) | 0 | 24.4 | 0 | 9.6 |
| ΔLWV (mL) | 0 | 78 | 0 | 44 |
| Posterior LWD (%) | 23 | 28 | 39 | 42 |
| Mid LWD (%) | 21 | 26 | 32 | 36 |
| Anterior LWD (%) | 17 | 23 | 26 | 29 |
| Lung volume (L) | 1.52 | 1.52 | 1.35 | 1.35 |
| Heart rate (bpm) | 49 | N/A | 74 | N/A |
| LV EF (%) | 54 | 27 | ||
| Cardiac output (L/min) | 6.2 | 4.3 | ||
| LV-EDV (mL) | 245 | 214 | ||
| LV-ESV (mL) | 118 | 157 | ||
| LVM, end diastole (g) | 191 | 196 | ||
| LVM, end systole (g) | 191 | 196 | ||
- Note: Lung water densities were measured in the image transitioning from rest to vigorous exercise, followed by rest again (acquisition no. 2). Heart rate, cardiac output, left ventricular volumes and mass, and ejection fraction were measured from short-axis cine images at rest.
- Abbreviations: LV-EDV, left ventricular end diastolic volume; LV-ESV, left ventricular end systolic volume; LVM, left ventricular myocardial mass; LWD, lung water density; LWV, lung water volume.
| Rest (acquisition no. 1) | Rest to vigorous exercise to rest (acquisition no. 2) | Rest to moderate exercise (acquisition no. 3) | Moderate exercise to rest (acquisition no. 4) | ||
|---|---|---|---|---|---|
| Healthy subjects (n = 12) | Lung volume (L) | 1.4 ± 0.4 | 1.5 ± 0.4 | 1.6 ± 0.4 | 1.8 ± 0.5 |
| Peak ΔLWD (%) | −1.4 ± 3.5 | 16 ± 6.8 | 7.8 ± 5.0 | −9.3 ± 5.0 | |
| LWD rest (%) | 28 ± 2.9 | 27 ± 2.9 | 25 ± 3.8 | 22 ± 3.1 | |
| LWD exercise (%) | N/A | 31 ± 4.3 | 27 ± 4.0 | 25 ± 3.4 | |
| LWV rest (L) | 0.39 ± 0.09 | 0.39 ± 0.10 | 0.40 ± 0.09 | 0.40 ± 0.09 | |
| LWV exercise (L) | N/A | 0.45 ± 0.10 | 0.43 ± 0.09 | 0.43 ± 0.10 | |
| Peak ΔLWV (mL) | −5.0 ± 11 | 62 ± 25 | 33 ± 28 | −42 ± 27 | |
| Accumulation dLWD/dt (%/min) | 0.2 ± 0.1 | 2.6 ± 0.9 | 1.5 ± 0.8 | 0.3 ± 0.2 | |
| Clearance dLWD/dt (%/min) | −0.3 ± 0.2 | −1.4 ± 0.6 | −0.5 ± 0.3 | −1.2 ± 0.7 | |
| Heart failure with preserved ejection fraction (n = 1) | Lung volume (L) | 1.51 | 1.52 | N/A | N/A |
| Peak ΔLWD (%) | −0.6 | 24 | |||
| LWD rest (%) | 21 | 21 | |||
| LWD exercise (%) | N/A | 26 | |||
| LWV rest (L) | 0.31 | 0.32 | |||
| LWV exercise (L) | N/A | 0.40 | |||
| Peak ΔLWV (mL) | 78 | ||||
| Accumulation dLWD/dt (%/min) | 1.2 | ||||
| Clearance dLWD/dt (%/min) | −0.8 | ||||
| Heart failure with reduced ejection fraction (n = 1) | Lung volume (L) | 1.28 | 1.35 | N/A | N/A |
| Peak ΔLWD (%) | −0.2 | 9.6 | |||
| LWD rest (%) | 35 | 34 | |||
| LWD exercise (%) | N/A | 37 | |||
| LWV rest (L) | 0.45 | 0.46 | |||
| LWV exercise (L) | N/A | 0.50 | |||
| Peak ΔLWV (mL) | 44 | ||||
| Accumulation dLWD/dt (%/min) | 1.1 | ||||
| Clearance dLWD/dt (%/min) | −0.6 |
- Note: Percent change in lung water density and volume (ΔLWD, ΔLWV) were measured between the first and last timeframe in acquisition no. 1, 3, and 4, and between the first timeframe and the peak exercise timeframe in acquisition no. 2. LWD and volumes at rest were measured in the first timeframe in acquisition no. 1–3, and in the last timeframe in acquisition no. 4. Exercise LWD and volumes were measured at peak exercise in acquisition no. 2, in the last timeframe in acquisition no. 3, and in the first timeframe in acquisition no. 4. dLWD/dt was not derived at rest in the patients, as these acquisitions were comprised of only two timeframes.
- Abbreviations: LWD, lung water density; LWV, lung water volume.
Figure 4 provides an example showing time-resolved ΔLWD curves and LWD maps in a healthy subject and patient, and Figure 5 shows the LWD development in healthy subjects an patients for the four different image acquisitions. Video S3 provides examples of dynamic LWD maps, showing a clear accumulation of lung water in a healthy subject and a patient with compensated heart failure.

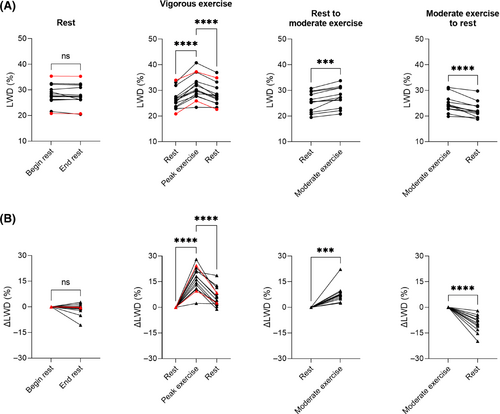
At rest (acquisition no. 1), LWD was 28 ± 2.9% in healthy subjects, 21% in the patient with HFpEF and 35% (elevated) in the patient with HFrEF. We measured no change in global ΔLWD over 10 min at rest in the healthy subjects (−1.4 ± 3.5%, p = 0.18).
After 5 min of moderate exercise (acquisition no. 3), we measured a ΔLWD of 7.8 ± 5.0% in healthy subjects. Global LWD increased from 25 ± 3.8% to 27 ± 4.0% (p = 0.0001), with corresponding LWV increasing from 0.40 ± 0.09 L to 0.43 ± 0.09 L (p = 0.0001). When transitioning from moderate exercise to rest (acquisition no. 4), ΔLWD decreased by −9.3 ± 5.0%. We hypothesize the changes in LWD are caused by an increase in intravascular pulmonary fluid during exercise, as the cardiac output (CO) increased from 4.5 ± 1.5 L/min at rest to 7.5 ± 2.6 L/min at moderate exercise, p = 0.0004. Correlation plots between ΔLWD and ΔCO in healthy subjects (R2 = 0.17) and the animal model (R2 = 0.16) are shown in Figure S3.
During vigorous exercise (acquisition no. 2), we measured a peak ΔLWD of 16 ± 6.8% in healthy subjects, 24% in the patient with HFpEF, and 9.6% in the patient with HFrEF. In the healthy subjects, global LWD increased from 27 ± 2.9% to 31 ± 4.3% (p < 0.0001), corresponding to an increase in LWV from 0.39 ± 0.10 L to 0.45 ± 0.10 L (p < 0.0001) and a ΔLWV of 62 ± 25 mL. In the patient HFpEF, global LWD increased from 21% to 26%, with corresponding increase in LWV from 0.32 L to 0.40 L (ΔLWV 78 mL). In the patient with HFrEF, global LWD increased from 35% to 37%, with corresponding increase in LWV from 0.46 L to 0.50 L (ΔLWV 44 mL).
The lung water accumulation rate in healthy subjects during vigorous exercise (acquisition no. 2) was dLWD/dt 2.6 ± 0.9%/min, and the lung water clearance rate dLWD/dt was −1.4 ± 0.6%/min. In patients, we observed a slower lung water accumulation rate (HFpEF: 1.2%/min, HFrEF: 1.1%/min), and lung water clearance rate (HFpEF: −0.8%/min, HFrEF: −0.6%/min). Although statistical significance was not tested between healthy subjects and patients, the observed slower lung water accumulation rate may suggest that measuring the dynamic time-resolved ΔLWD-curves could add clinical value in heart failure assessment, compared to only measuring LWD at rest and shortly after exercise.
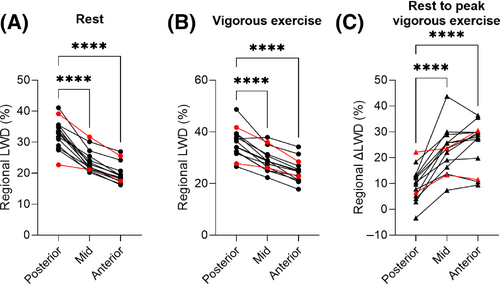
Regional LWD was higher posteriorly compared the anterior parts of the lungs both at rest (33 ± 3.7% vs 20 ± 3.1%, p < 0.0001) and at peak vigorous exercise (36 ± 5.5% vs 25 ± 4.6%, p < 0.0001) in the healthy subjects. A larger ΔLWD was, however, measured anteriorly (26 ± 8.6%) compared to posteriorly (8.9 ± 5.9%), p < 0.0001 (Figure 6). In patients, regional LWD were also higher posteriorly compared the anterior parts of the lungs both at rest (HFpEF: 23% vs 17%, HFrEF: 39% vs 26%) and at peak vigorous exercise (HFpEF: 28% vs 23%, HFrEF: 42% vs 29%), with a larger ΔLWD measured anteriorly compared to posteriorly (HFpEF: 33% vs 24%, HFrEF: 13% vs 8%).
3.3 Lung volume analysis
LWD differed when measured at end-inspiration and end-expiration. The LWD in healthy subjects at rest (acquisition no. 1) from images registered to end-expiration was 28 ± 2.9%. When registering the same images to end-inspiration, we measured a LWD of 23 ± 2.2%. This difference (p < 0.0001) is explained by the significant variation in end-expiratory and end-inspiratory lung volume (1.4 ± 0.4 L vs 1.8 ± 0.5 L, p < 0.0001), with LWD being defined as the amount of pulmonary fluid per unit of volume. Multiplying end-expiratory and end-inspiratory LWD with their corresponding lung volumes resulted in similar amounts of pulmonary fluid (0.42 ± 0.11 L vs 0.42 ± 0.11 L, p = 0.34). Figure 7 shows an example of lung water quantification from an image registered to end-expiration and end-inspiration, along with an example of respiratory-resolved LWD.
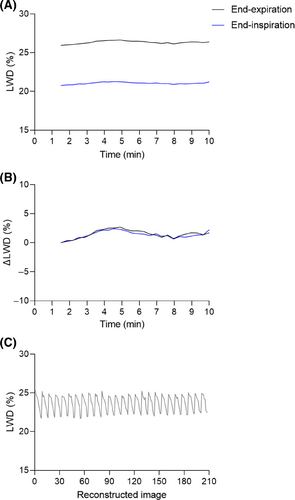
No difference was found when comparing LWD at rest from acquisition no. 3 with LWD after ∼15–20 min of sustained moderate exercise in acquisition no. 4 (25 ± 3.8% vs 25 ± 3.4%, p = 0.55). This is explained by the latter exercise image being registered to an end-expiratory image acquired during physical activity, yielding different LWV of 0.40 ± 0.09 L and 0.43 ± 0.10 L, p = 0.013 (lung volumes 1.6 ± 0.5 L vs 1.8 ± 0.5 L, p = 0.16). This emphasizes the importance of taking the respiratory position into account when comparing LWD from different image acquisitions.
3.4 Porcine dynamic lung water model
Porcine characteristics and experimental results are summarized in Table S1, and an example experiment is shown in Figure 3C,D. A mitral regurgitant fraction of 45 ± 24% was achieved. An increase in LWD was observed when opening the valve leaflet in all experiments, with a peak lung water accumulation rate dLWD/dt of 1.01 ± 0.81%/min. Over the course of 10 min ΔLWD increased by 3.3 ± 1.5%, from 0.34 ± 0.05 L to 0.35 ± 0.05 L of LWV, p = 0.02. Simultaneously, PAWP increased by 6.6 ± 3.1 mmHg (101 ± 112%, p = 0.009). Cardiac output decreased by −28 ± 15%, from 3.7 ± 0.7 L/min to 2.6 ± 0.8 L/min (p = 0.01), suggesting that measured ΔLWD was predominantly extravascular. The decrease in systemic SBP and DBP was −17 ± 9.3 mmHg (−25 ± 14%, p = 0.01) and − 8.6 ± 5.1 mmHg (−22 ± 13%, p = 0.02), respectively.
4 DISCUSSION
This study presents a method to quantify dynamic changes in LWD during supine exercise stress using a motion corrected sliding-window image reconstruction on a continuous 3D stack-of-spirals MRI acquisition. Our method was capable of depicting and quantifying lung water dynamics in healthy subjects and patients with compensated heart failure during supine exercise stress, and in a controlled porcine model of extravascular lung water accumulation. The reconstructed images have isotropic resolution, allowing re-slicing and visualization in any orientation, thus supporting assessment of regional dynamic changes, in addition to global changes.
4.1 Time-resolved lung water imaging
Previous studies have quantified lung water at rest and shortly after exercise,4, 7-10 but to our knowledge, we are the first to quantify transient changes during exercise stress. Time-resolved lung water imaging during exercise stress was achieved by dividing a continuous image acquisition into different timeframes using a sliding-window image reconstruction. Each reconstructed window contained 90 s of sampled k-space data, and stepped forward in time increments of 20 s, meaning that there is an overlap of ∼78% of data (70 s) between adjacent timeframes. This wide temporal footprint ensures that each timeframe contains enough data for motion correction and quantification, while the temporal overlap enables smooth but dynamically sensitive LWD curves over time. Hence, each time point does not represent the instantaneous lung water in real-time, and should not be interpreted as such. Ensuring a resting baseline period of at least 90 s is therefore important to relate changes in LWD to a stable measurement, allowing each ΔLWD time point to primarily reflect the changes in lung water within the increment 20 s.
Stable quantitative lung water measurements from proton density weighted images require a signal reference with known water density,32 and lung water quantification performed by relating the lung signal to the surrounding musculoskeletal or hepatic tissue has previously been established.4, 7, 9 We used time-resolved surrounding body tissue masks in our quantification, to avoid discrepancies related to potential signal drift during image acquisition. Spatial normalization maps used to compensate for coil shading were, however, only derived from the first timeframe. Possible coil shading changes in case the exercise-related motion significantly displaces the receiver coil will not be accounted for this way.9
Image analysis was performed within the same pipeline as the image reconstruction, allowing a streamlined and automated image processing which in the future may be deployed to display results directly on the scanner in conjunction with the MRI exam. This has previously been achieved within 1 min of image acquisition for static lung images at rest,9 but the lengthy processing time of 105 ± 1.6 min to derive time-resolved LWD maps was not deemed feasible for inline deployment at this stage. Future work could potentially shorten image processing times by using distributed graphics processing unit and cloud computation.
4.2 LWD, LWV, or ΔLWD?
The reported metrics of LWD and percent ΔLWD are closely related and are both reported in the unit percent, which may be confusing. As LWD fluctuates with the variation in lung volume over the respiratory cycle, we deemed ΔLWD to be a more easily comprehendible parameter to visualize and compare lung water dynamics across subjects, while being consistent regardless of respiratory position. In other words, the ΔLWD is consistent, but LWD varies, when images are registered to end expiration or end inspiration. These findings emphasize the importance of knowing the reconstructed respiratory phase when analyzing LWD. The ΔLWD is, however, relative to the baseline LWD value which can be elevated in patients. This will impact the measured percent increase in LWD, yielding higher ΔLWD for subjects with an overall low global LWD compared to those starting at a higher baseline LWD. It might therefore be compelling to instead measure LWV and the absolute change in LWV (ΔLWV). LWV is, nevertheless, expected to vary significantly across subjects depending on for example subject size, current hydration, diuretics administration, and pulmonary vascular resistance. A comprehensive analysis of all these metrics may therefore be required when studying lung water dynamics.
The metric LWD has previously been shown to have prognostic value in heart failure, although ranges between normal “dry lungs” to high “wet lungs” have been reported independently from New York Heart Association (NYHA) class, left ventricular ejection fraction, and natriuretic peptide levels.4, 10 Large cohort patient studies are therefore warranted to provide insight on suitable combinations of lung water related parameters and indexations for clinical reporting. We hypothesize that the time-derivative dLWD/dt may be a valuable additional parameter in conjunction to LWD, ΔLWD, LWV, and ΔLWV based on the observed slower lung water accumulation and clearance rates in the two patients.
4.3 Lung water dynamics
The consistent increase in LWD in human subjects when transitioning from rest to exercise, and decrease when transitioning from exercise to rest, further validates the ability to measure lung water dynamics. The normal physiological response to exercise is an increase in pulmonary capillary blood volume to secure oxygen delivery to exercising tissues,33 and we attribute the exercise-induced increase in LWD and cardiac output in the healthy subjects to an intravascular lung water accumulation. The predominant posteriorly accumulated LWD, but higher anterior ΔLWD increase, further reflects a global increase in pulmonary perfusion during exercise. The decrease in left ventricular end systolic volume during supine exercise are in line with previous findings by Steding-Ehrenborg et al.34 Steding-Ehrenborg et al did however, in contrast to this study, not observe differences in end diastolic volume. Their MRI exercise protocol was performed with one-legged knee extensions with images acquired at breath-hold, which may explain this difference. The left ventricular myocardial mass consistency over the cardiac cycle as well as between rest and exercise indicate that the binned retrospectively gated short-axis cine sequence is suitable for exercise MRI.26
The porcine experiments validated the capabilities of our method to quantify dynamic changes in extravascular lung water. We measured an increase in LWD after induction of mitral regurgitation in all pigs, with a peak accumulation dLWD/dt shortly after leaflet opening. A concurrent increase in pulmonary arterial wedge pressure, the current “gold standard” assessment for lung water,35-37 further corroborated the development of lung water after leaflet opening. Leaflet opening also resulted in a decreased cardiac output, as part of the left ventricular stroke volume returning to the left atrium and pulmonary circulation instead of being expelled into the aorta, suggesting that the measured increase in LWD was attributed to extravascular lung water. Our imaging method does, however, not distinguish between intravascular and extravascular fluid.
4.4 Clinical applicability
Only two patients with compensated heart failure were included, which prevented us from characterizing differences in lung water dynamics between healthy subjects and patients. However, the inclusion of these patients served as a proof-of-concept for clinical feasibility of exercise MRI in heart failure with both HFpEF and HFrEF. We observed a slower lung water accumulation and clearance rates, but not necessarily higher LWD and peak ΔLWD, in the patients compared to controls. This finding suggest that the time-derivative dLWD/dt, a metric which cannot be derived without time-resolved lung water images, may be a valuable clinical parameter to characterize heart failure. This is in line with findings by Burrage et al,8 who reported differences in pulmonary proton density in images acquired at rest and shortly after cessation of exercise in patients with heart failure and amyloidosis, but not in healthy controls. Further heart failure patient studies are warranted to determine if this method can unmask latent heart failure, where an exercise-induced pressure-driven extravascular lung water accumulation is expected. Future studies may also investigate sex as a statistical variable in the context of lung water development.
Compared to competitive clinical techniques used to measure lung water, namely x-ray, CT, ultrasound, and cardiac catheterization, MRI offers the advantages of being noninvasive, quantitative, and free from ionizing radiation during long exercise studies. Moreover, most patients with heart failure routinely undergo cardiac MRI exams for assessment of cardiac volumes, function, and tissue characterization.38
4.5 Low-field strength lung MRI
In this study, we used a contemporary 0.55T MRI system which was ramped down from 1.5T.15 Such system offer high quality structural and functional cardiopulmonary imaging related to reduced susceptibility gradients at air-tissue interface, by virtue of an improved B0 field homogeneity, while maintaining high-performance hardware and software.23, 39-41 A 0.55T is therefore a powerful system to perform a comprehensive cardiopulmonary exam, and commercial options are increasingly being made available. The ramped down prototype 0.55T system has higher performance gradients (maximum gradient amplitude 45 mT/m, maximum slew rate 200T/m/s) compared to commercially available Siemens 0.55T system (MAGNETOM Free.Max, Siemens Healthcare, Erlangen, Germany; maximum gradient amplitude 26 mT/m, maximum slew rate 45T/m/s). Recent efforts have demonstrated that the stack-of-spiral UTE sequence used in this study functions on such commercial system.42 The lower field strength is also beneficial for MRI-guided interventional procedures such as in our porcine model, due to the quadratic relation between magnetic field strength and the RF-induced heating of metallic devices.15 Lung water MRI is, moreover, not unique to 0.55T and have been performed on conventional 1.5T and 3T systems as well.4, 7, 8, 10 We anticipate that our dynamic lung water imaging method could be translated to higher field strengths, following an adaptation of the sequence and image reconstruction pipeline.
4.6 Limitations
We acknowledge some notable limitations of this study. The lung water quantification relative to musculoskeletal and hepatic tissue signal water density of 70% may not hold in all patients, such as those with fat infiltrations or hepatic iron deposits. The method does also not distinguish between intravascular and extravascular fluid, meaning that our method does not determine the physiological mechanism behind a measured increase in LWD. We illustrate this with our findings of increased intravascular LWD in healthy human subjects during exercise and increased extravascular lung water in the animal model, corroborated by cardiac output measurements. Another limitation is associated to exercise related motion, which disturbed ECG-signal for heart rate monitoring, especially during vigorous exercise, and resulted in image blur in timeframes covering transitions between rest and exercise, despite motion correction. The motion correction performed well for global features such as the lung boundaries and major vasculature, but the regions of low signal parenchymal tissue without sharp blood vessel features might result in a local misregistration which is hard to verify. Future work could explore other fast and robust image registration algorithms. The time-consuming image reconstruction and image processing, despite the use of a computer with high computational power, is also a limiting factor for future clinical adoption of this method.
5 CONCLUSIONS
Dynamic changes in LWD can be dynamically quantified using a continuous 3D MRI proton density weighted sequence with a sliding-window and respiratory motion corrected image reconstruction. Further patient studies are warranted to determine if this method can be used to diagnose early stage heart failure.
ACKNOWLEDGMENTS
The authors acknowledge the assistance of Siemens Healthcare in the modification of the MRI system for operation at 0.55T, and the stack-of-spirals UTE sequence, under an existing cooperative research agreement (CRADA) between NHLBI and Siemens Healthcare. We also acknowledge the contributions of Amelia Nargozian, Andrea Jaimes, William H. Schenke, John Kakareka, Victoria Frasier, Katherine Lucas, and Rim Halaby. The study was approved by the Institutional Review Board at the National Heart, Lung, and Blood Institute, National Institutes of Health. Written informed consent was given by all study participants after the nature of the procedure had been fully explained. Animal experiments were approved by the local Institutional Animal Care and Use Committee and conducted per contemporary guidelines from the National Institutes of Health.
FUNDING INFORMATION
This study was funded by the National Heart, Lung, and Blood Institute's (NHLBI) Division of Intramural Research (Z01-HL006257, Z01-HL006213, Z01-HL006039). Felicia Seemann received support from the Swedish Society for Medical Research, SSMF (PD20-0043), Swedish Heart-Lung Foundation (20210205 and 20220463), and Foundation Blanceflor.
CONFLICT OF INTEREST STATEMENT
The authors are investigators on a US Government Cooperative Research and Development Agreement (CRADA) with Siemens Healthcare. Siemens participated in the modification of the MRI system from 1.5 T to 0.55 T.
Open Research
DATA AVAILABILITY STATEMENT
Source code for image reconstruction and image processing is available open source (https://github.com/NHLBI-MR/dynamic_lung_water). The datasets used during the current study are available from the corresponding author on reasonable request.


