Optimized interferometric encoding of presaturated TurboFLASH B1 mapping for parallel transmission MRI at 7 T: Preliminary application for quantitative T1 mapping in the spinal cord
Abstract
Purpose
The acquisition of accurate B1 maps is critical for parallel transmit techniques (pTx). The presaturated turboFLASH (satTFL) method has been widely used in combination with interferometric encoding to provide robust and fast B1 maps. However, typical encodings, mostly evaluated on brain, do not necessarily fit all coils and organs. In this work, we evaluated and improved the accuracy of the satTFL for cervical spine at 7 T, proposing a novel interferometric encoding optimization. The benefits of such improvements were investigated in an exploratory study of quantitative T1 mapping with pTx-MP2RAGE.
Methods
Global optimization of interferometric encoding was implemented by simulating the ability of the satTFL to reconstruct B1 maps, with varying encoding and inclusion of complex noise, inside a region of interest covering the cervical spine. The performance of satTFL before and after optimization was compared to actual flip angle imaging. Optimized and non-optimized B1 maps were then used to calculate pTx pulses for MP2RAGE T1 mapping.
Results
Interferometric encoding optimization resulted in satTFL closer to actual flip angle imaging, with substantial gain of signal in regions where non-optimized satTFL could fail. T1 maps measured with non-adiabatic pTx pulses were closer to standard non-pTx results (which used adiabatic pulses) when using optimized-satTFL, with substantially lower specific absorption rate.
Conclusion
Optimization of the satTFL interferometric encoding improves B1 maps in the spinal cord, in particular in low SNR regions. A linear correction of the satTFL was additionally shown to be required. The method was successfully used for quantitative phantom and in vivo T1 mapping, showing improved results compared to non-optimized satTFL thanks to improved pTx-pulse generation.
1 INTRODUCTION
MRI at 7 T has shown great promises, demonstrating the potential of high-resolution and quantitative techniques to study pathologies.1 However, higher static magnetic field B0 leads to several challenges, including B1 inhomogeneity and high specific absorption rate (SAR).2 Parallel transmit (pTx) methods, which independently control the different transmit channels of a given multi-element RF coil, have been introduced to mitigate these SAR and B1 effects.3, 4 Different levels of complexity can be used for pTx MRI,5 but all require a precise prior knowledge of the B1 generated by each RF channel to provide customized B1 optimization.
Other studies have investigated the impact of the interferometry on the performance of the satTFL, and a few encoding matrices have been proposed, such as “One-inv” (all channels have identical amplitudes, one has opposite phase) and Fourier encoding, which have been used in vivo in particular for brain applications.11, 15 However, it was also shown that adjustment of the amplitude and phase of the diagonal elements of the interferometric matrix led to improved B1 mapping quality because it depends on the coil configuration and imaging target.16 Indeed, although certain coils may provide similar B1 mapping performance with a specific encoding matrix, less standard RF coil configurations (e.g., posterior or anterior only,17-19 distributed over rows20) may suffer from destructive interference across all RF modes in some regions. The choice of encoding matrix is therefore critical for such applications.
As a result of using unreliable B1 maps, pTx pulse optimization may not provide adequate level of precision for excitation. Although some level of B1 bias may be acceptable for anatomical MRI,21 it may be particularly problematic for some quantitative measurements.22 For instance, in the case of quantitative T1 mapping (T1q) from MP2RAGE,23 homogeneous B1 is required for both the inversion and excitation pulses. Used in single channel mode, such T1q was shown to be inaccurate in the presence of B1 inhomogeneities.24, 25 To mitigate those effects, MP2RAGE typically relies on long adiabatic inversion pulses, usually at the expense of more elevated SAR. Offline B1 bias correction was also proposed,19 but it adds complexity and may not be reliable in regions suffering from high B1-inhomogeneity.
Parallel transmission also bears great potential for other organs such as the spinal cord. Despite a small cross-sectional area in the transverse plane (cord diameter ˜ 1 cm), its elongated shape and surrounding structures may result in B1 inhomogeneities along the z-axis, in the order of 30% between the C3 and C7 cervical levels, up to 70% in some cases.26 This may lead to unreliable results in some subjects, whose data may be partly discarded.26 Because T1q was shown to be useful in the identification and characterization of pathologies such as multiple sclerosis,27 pTx is a great candidate to provide an improved quantification from MP2RAGE. However, no studies of B1 mapping with interferometric encoding have been performed so far for this organ or when using cervical spinal cord RF coils.
This work presents a novel RF coil and organ specific optimization of interferometric encoding, which modifies the amplitudes and phases of all the elements of the matrix (Eq. 1 and 2), and of the reference mode when using the hybrid approach, to reach better B1 accuracy while including sensitivity to noise. This general method is applied to cervical spinal cord 7 T MRI, both on phantom and in vivo. The performance of the optimized satTFL is evaluated by comparing it with a typical encoding matrix (One-inv)12 using the actual flip angle (AFI) technique28 as standard due to its accuracy.8 A practical benefit of having improved B1 accuracy is finally evaluated in an exploratory study by acquiring T1q from MP2RAGE with the classic single-channel implementation, and with two sets of optimized pTx pulses: the first obtained from standard satTFL data, the second one from optimized satTFL data.
2 METHODS
All data were acquired using a 7 T Magnetom TERRA (Siemens Healthcare, Erlangen, Germany) equipped with an 8-channel transceive cervical spine coil (Rapid Biomedical GmbH, Rimpar, Germany).19 The study was performed on the SAM phantom (SPEAG, Zurich, Switzerland) and on four healthy volunteers with informed consent and approval of the local ethics committee. The 10 g-averaged SAR (SAR10g) was calculated using electromagnetic simulations of different human models (Duke and Ella, from the Virtual Family29) in several positions inside the coil (with three different shifts along the z-axis to account for positioning variations)30 with Sim4Life (ZMT, Zurich, Switzerland), and monitored online using virtual observation points (VOP).31 Identical VOPs were also used to take SAR10g into account for the design of the matrix and of the pTx pulses.
2.1 Acquisition of the B1 maps
The 2D-satTFL were acquired using a custom sequence with a Shinnar-Le Roux saturation pulse to mitigate slice cross-interference32 and enable the import of external encoding matrices.
- Interferometry12: Images were acquired with eight RF modes i, with and without presaturation pulse ( and , respectively). The effective saturation FA with linear combination of channels (), was calculated as:
- Hybrid: The “hybrid” method only uses one reference satTFL and eight TFL RF modes, reducing the number of acquisitions from 16 to 10.13 A magnitude image was acquired for a reference mode, with and without presaturation pulse ( and , respectively), for which the effective saturation FA is:
After deriving the magnitude of from , its phase relative to the transmit RF phase of the first acquired RF mode was obtained by extracting the phase difference between and .
The individual channel B1 maps were then obtained according to Eq. 2. The signals corresponding to different pTx pre-saturation (if any) and excitation pulses were acquired as repetitions of turbo-FLASH acquisition using the following sequence parameters: resolution: 5 × 5 × 2.5 mm3, matrix size = 48 × 36, 48 slices acquired in an interleaved manner, TE = 1.81 ms, FA readout α = 5° (Sinc pulse with duration = 0.8 ms), FA presaturation β = 60° (minimum phase Shinnar-Le Roux pulse with duration = 5 ms, time bandwidth product = 9, and pass-band ripple 1%). The time TR between two consecutive turbo-FLASH acquisitions was 15 s, allowing for the magnetization to fully recover. In addition, B0 maps were acquired as they were used during the calculation of FA distribution when optimizing the encoding matrix and the pTx pulses (sequence parameters: 3D multi-echo gradient echo, resolution: 2.5 × 2.5 × 2.5 mm3, TE1/TE2/TE3/TR = 5/6.5/8/300 ms, FA = 20°, TA = 2 min 52 s).
An initial satTFL was acquired using “One-inv” encoding () to calculate each channel B1, with a reference voltage calculated based on the average FA inside a region of interest (ROI) approximating the cervical cord (C1–C7) in the phantom and including C1–T1 in vivo. Although not shown, a comparison between the Fourier and One-inv encoding11 showed that the latter produced higher quality B1 maps.
Data from four healthy volunteers (two males and two females, with age and weight range = [28, 33] years and [55, 90] kg, respectively) were acquired. The satTFL B1 maps acquired with “One-inv” were denoised using block matching with 4D filtering (BM4D)33 separately on the real and imaginary components, and were considered as ground truth during the optimization of the matrix . The satTFL was optimized for all four volunteers simultaneously, aiming to find a preliminary proof-of-concept “generic” optimized satTFL, as an alternative to subject-specific optimization.
2.2 Optimization of the encoding matrix
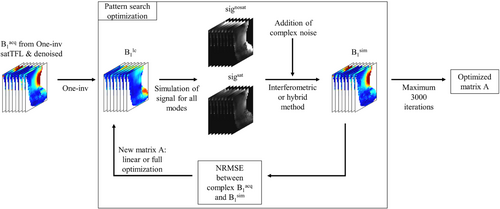
As a preliminary step to isolate the effect of matrix amplitude on the accuracy of the encoding, the optimization only allowed linear scaling of the One-inv modes, giving an optimized matrix opt,linear. A full optimization of all elements of the encoding matrix was then performed to generate opt,full, using One-inv as starting point. In addition to the encoding matrix, the optimization calculated the required reference voltage, which was then used during the acquisitions. A summary of the method is shown in Figure 1. In addition, the condition (Cond) of the different optimized matrices was calculated because this metric represents the tendency of a matrix to amplify noise.
2.3 Validation of the optimization
2.3.1 Phantom study
To demonstrate the benefit of a full encoding matrix optimization as compared to a simple optimization of the reference voltage, individual-channel B1 maps were acquired for the interferometry and hybrid satTFL using opt,linear and opt,full matrices as well as different scaling of the One-inv matrix. Acquisitions using One-inv were performed with a reference voltage calculated based on the mean FA inside the ROI, and with a reference voltage achieving the maximum SAR10g according to the optimization constraints (corresponding to the normal mode of operation). The RF modes of the One-inv matrix were also individually scaled to reach the maximum constraints considered during the optimization (FA and SAR10g), regardless of the NRMSE. The performance of the interferometric encoding was evaluated in a ROI representing the approximate location of the C1–C7 levels of the spinal cord in the SAM phantom.
In order to evaluate and compare the performance of each encoding matrix, the acquired satTFL were combined in MatLab after denoising to predict the B1 distribution from different static or dynamic RF shims inside the ROI: (i) Shimdef with a 300 μs rectangular pulse; (ii) static RF shim obtained by using the scanner built-in tool (Shimscanner); (iii) two nonselective 500 μs pTx pulses using the gradient ascent pulse engineering (GRAPE) method,37 designed to cover a range of higher FA values (≈ 40–70°, ShimpTx_high, the upper FA was limited by the SAR10g constraint of the AFI), and lower FA values (≈ 20–40°, ShimpTx_low). Details about the calculation and constraints used for the GRAPE pulses are provided in section 4.
The simulated combined B1 were used to calculate corresponding FA maps (from Bloch simulations) and were compared with denoised FA maps derived from AFI acquired using identical RF shims and pulses, with sequence parameters: 3D acquisition, resolution 5 × 5 × 2.5 mm3, TE1/TE2/TE3/TR = 3.1/4.9/7/130 ms, FA = 60°, TA = 5 min 49 s. The NMRSE and the mean percentage error (MPE, the ratio of their absolute difference and the FA from AFI) were evaluated for each method.
2.3.2 In vivo study
A similar comparison, used for in vivo validation, was performed on two of the four volunteers (volunteer 1: male, aged 33 years, 89 kg; volunteer 2: female, aged 32 years, 85 kg), but only included a comparison between hybrid satTFL and AFI. The B1 maps were combined, calculated as FA and compared with AFI using two shim configurations: Shimdef (volunteers 1 and 2) and a 500 μs GRAPE pTx pulse (volunteer 1) (ShimpTx).
2.3.3 Linear correction of satTFL
As previously shown,38 a linear bias may exist between the satTFL and AFI. The AFI data were therefore used to estimate this bias: for the different methods introduced earlier, linear regressions were calculated between the FA calculated from the satTFL and acquired from the AFI. The regression coefficients were then used to correct for this bias.
2.4 Preliminary application for pTx quantitative T1 mapping
Following the comparison with the AFI, the potential of using the optimized satTFL was evaluated by measuring quantitative T1 maps (T1q) from MP2RAGE,21 using the sequence parameters described in Massire et al.19 (coronal acquisition, FA1/FA2 = 4/5, TE/TR = 2.4/5000 ms, TI1/TI2 = 700/2400 ms, FOV = 260 mm, number of slices = 192). The reference T1q (T1qref) was obtained after standard MP2RAGE acquisition (using Shimdef and an hyperbolic secant 4 adiabatic inversion pulse) and included correction for B1-induced bias of the T1. Its calculation assumed an inversion efficiency of 1, as previously done.19 Different pTx-MP2RAGE21 were then acquired with pulses calculated from hybrid satTFL with One-inv (the default protocol on our MR scanner) and optimized encoding. Importantly, only the latter included a correction for the bias between satTFL and AFI, showing the combined effects of the matrix optimization and the AFI-based bias correction. T1q were calculated without correcting the T1 for B1-induced bias, leading to T1qOne-inv and T1qopt,corr, respectively. Denoising using BM4D was applied to all T1q.
The GRAPE method37 was used to calculate the nonselective excitation (duration = 500 μs) and non-adiabatic inversion (duration = 7500 ms) pTx pulses. This method uses parametrization-free RF waveforms and 3D gradient trajectories to lower the NMRSE between the calculated and target FAs inside the ROI used in the satTFL optimization.Optimization of the excitation and inversionpulses were performed in parallel (calculation time of about 2 min on a DELL Precision 7560).
2.4.1 Phantom study
MP2RAGE was acquired with a resolution of 0.7 × 0.7 × 1 mm3. The different T1q were calculated and compared inside the entire ROI used for the satTFL and pTx pulse optimizations. Because it was expected that different types of RF pulses (in particular, adiabatic and non-adiabatic inversion pulses) may lead to differences in T1q, the purpose of this phantom study was to correct for this bias with a calibration factor κ, used in the T1q calculation to better match T1qref.
2.4.2 In vivo study
MP2RAGE images were acquired at 0.7 mm isotropic resolution. A single volunteer (volunteer 1) was included in this preliminary study, with a ROI including the C1–C7 cervical levels. T1q was calculated with κ = 1 and 0.89 for the reference and pTx sequences, respectively, based on the phantom calibration presented in the previous section. Automatic segmentation of the cord was performed using the Spinal Cord Toolbox (v5.6).39, 40 Mean cord (gray matter and white matter) T1q at different cervical levels were then calculated using ITK-SNAP v3.8 (www.itksnap.org).41
3 RESULTS
3.1 Optimization of the encoding matrix
Figure 2 shows the magnitude and phase of different -matrices used for the interferometry and hybrid satTFL in the SAM phantom and in vivo. All optimizations increased the magnitude of , with maximum values of 2.04 for the linear optimization of One-inv, and 2.98 for the full optimization of hybrid satTFL. Substantially larger amplitudes were reached when only considering the SAR10g and/or FA constraints compared with the linear optimization of One-inv. However, mean amplitudes of the encoding matrices with maximum constraints(interferometry: 1.35, hybrid: 2) were similar to the mean amplitude reached after full optimization (interferometry: 1.33, hybrid: 2.13). The optimized mean ± SD of the phases of the diagonal (off diagonal, respectively) elements were, in the phantom: interferometry:−101° ± 26° (48° ± 46); hybrid: −46° ± 20° (126° ± 41°); in vivo: −93° ± 31° (76° ± 43°). Because the hybrid encoding method only relies on a single reference mode with presaturation (line 1 of the optimized hybrid matrices), higher RF mode amplitudes were reached for the encoding modes (lines 2–8 of the optimized hybrid matrices) compared with the interferometry approach. Although not constrained, the conditions after optimization were close to Cond(One-inv) = 3, with the exception of the full optimization using the interferometry approach (Cond = 5.52). The stopping criteria was reached in about 1 h when using data from a single subject.

An intermediate step of the B1-map reconstruction is shown in Figure 3, as the (shown as sagittal FA maps) with the One-inv and optimized hybrid satTFL on a volunteer, using the matrix shown in Figure 2C. The red contour shows the ROI in which the accuracy and robustness of the B1 was optimized, illustrating that the One-inv encoding included almost no signal below the black dotted line, which represents the region under the C6 cervical level. After optimization, some of the RF modes generated signal in this region, providing information that can be used in the reconstruction of the individual-channel B1.

This observation was confirmed in Figure 4, which displays the effect of the optimization on the individual hybrid satTFL B1 maps on volunteer 1. B1 maps are shown before denoising to better appreciate the impact of the optimization of the encoding. Although One-inv and optimized-satTFL provide similar results above the C6 cervical level (black dotted line), a qualitative comparison shows improvements in the magnitude for lower cord levels, displaying as a reduction of noise. In particular, a substantial difference between One-inv and optimized satTFL was observed for channel 4 in those regions, where very poor signal was partially recovered using the optimized satTFL acquisition. Although not included in the optimization, improvements were also noticed in some regions outside the ROI (black arrows). Similar phase distributions were obtained with the different methods. Results on phantom are shown in Figure S1.
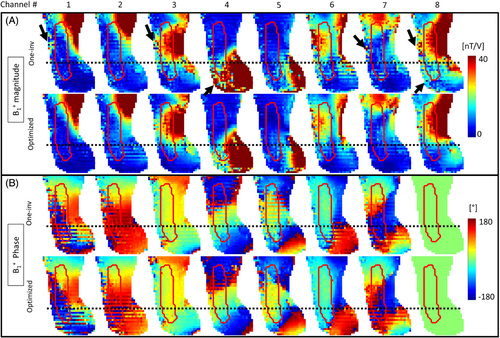
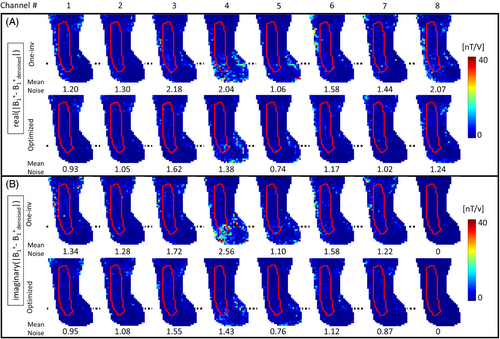
Figure 5 shows, for every channel, the difference between the BM4D-denoised B1 maps (available in Figure S2) and the “raw” B1 maps (Figure 4). The denoising operation notably improves the measured B1+ of every channel while preserving the distribution. As indicated by the average noise level inside the ROI, denoising has a more pronounced effect on One-inv due to lower noise robustness of this strategy. An average noise reduction factor of 27.5% (up to 44% for channel 4) was obtained with optimized encoding.
3.2 Validation of the optimization
Figure 6 shows scatter plots comparing acquired AFI and calculated FA maps from the hybrid satTFL, with different encoding methods for the SAM phantom (Figure 6A) and for volunteers 1 and 2 (Figure 6B). The comparisons combine results from different RF shims, as described in the Methods section, and includes FA inside the ROI which were higher than 10°. Results show that the One-inv encoding leads to relatively high deviation from the AFI, for a wide range of FA, for all calibrations and scaling, even when similar amplitudes were used in the encoding matrices (see Figure 2). This deviation is somewhat reduced using “One-inv optimized” (phantom only); yet, a full interferometric matrix optimization further reduces this deviation (SD) for both the interferometry and hybrid methods. Scaling of the One-inv to reach maximum SAR10g constraints is shown in Figure S3.
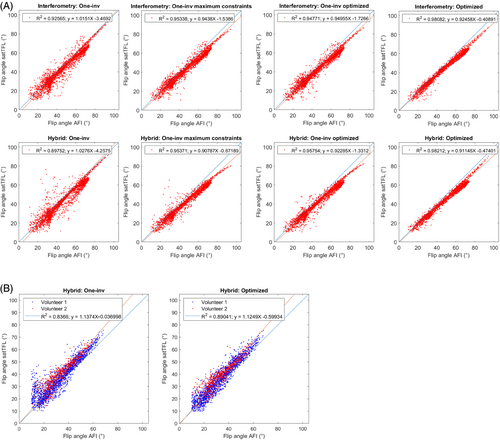
As previously reported, a linear bias was measured between the AFI and the satTFL,38 justifying the need for a linear correction of the satTFL. A linear regression model fit was performed for all methods, showing superior R2 after optimization (from R2 = 0.90 to 0.98, and R2 = 0.84 to 0.89 for the hybrid satTFL on phantom and in vivo, respectively, excluding results from Hybrid: One-inv maximum SAR10g). Although only combined data is shown, the differences between the linear slopes of volunteers 1 and 2 with Shimdef were 10% and less than 1%, based on One-inv and optimized-satTFL, respectively, indicating that a unique linear correction could be used for different subjects after optimization. Because AFI may be inaccurate in the low FA regime,6, 8 Figure S4 also shows results when considering FA greater than 20°. However, excluding FA between 10° and 20° only led to variations lower than 1% in the slope of the linear correction.
Table 1 complements those results with a comparison between the different methods based on the NRMSE and MPE metrics, for FA > 20°. Without linear correction, similar NRMSE and MPE were observed with different encoding methods, although increasing the reference voltage or optimizing the encoding matrix reduced the SD of the MPE by up to 63%. With linear correction of the fully optimized encoding matrices, the MPE was reduced to less than 3.7% (phantom) and to around 12% (in vivo). Finally, different scaling of One-inv led to MPE greater than 5% and up to 57% larger SD compared with opt,full. The NRMSE from One-inv to corrected optimized-satTFL was reduced by approximately 60% and 40% in phantom and in vivo, respectively. Because the hybrid encoding method achieved better results than interferometry encoding with a lower acquisition time, it was exclusively used for the following sections of this study.
| NRMSE | MPE ± SD (%) | Acquisition time (min:s) | |||
|---|---|---|---|---|---|
| No correction | Correction | No correction | Correction | ||
| Phantom | |||||
| Interferometry | |||||
| One-inv | 0.065 | 0.053 | 9.06 ± 7.57 | 6.65 ± 8.37 | 4:01 |
| One-inv max SAR10g | 0.072 | 0.045 | 10.55 ± 5.51 | 6.11 ± 6.67 | |
| One-inv max constraints | 0.069 | 0.043 | 10.3 ± 5.7 | 5.81 ± 7.01 | |
| One-inv optimized | 0.069 | 0.043 | 10.23 ± 5.55 | 5.76 ± 6.43 | |
| Optimized | 0.059 | 0.026 | 8.57 ± 3.89 | 3.70 ± 3.45 | |
| Hybrid | |||||
| One-inv | 0.078 | 0.065 | 10.24 ± 10.82 | 7.13 ± 11.66 | 2:31 |
| One-inv max SAR10g | 0.31 | 0.21 | 30.59 ± 20.43 | 30.71 ± 23.73 | |
| One-inv constraints | 0.082 | 0.044 | 11.85 ± 6.76 | 5.26 ± 7.96 | |
| One-inv optimized | 0.076 | 0.040 | 11.07 ± 5.88 | 5.09 ± 6.43 | |
| Optimized | 0.067 | 0.026 | 9.94 ± 4.01 | 3.64 ± 3.44 | |
| In vivo | |||||
| Hybrid | |||||
| One-inv | 0.122 | 0.089 | 22.39 ± 31.56 | 16.19 ± 25.20 | 2:31 |
| Optimized | 0.097 | 0.072 | 17.28 ± 18.38 | 12.5 ± 15.52 | |
- Note: The comparison was performed in the SAM phantom and on a volunteer, with and without correction from the linear regression fit. The acquisition time of the different methods is shown and depended on the required number of encoding steps. Only FA > 20 were included for the computation of those metrics.
- Abbreviations: AFI, actual flip angle; FA, flip angle; GRAPE: gradient ascent pulse engineering; MPE, mean percentage error; NRMSE, normalized RMS error; pTx, parallel transmit; SAR, specific absorption rate; satTFL, presaturated turboFLASH; Shimdef, default shim.
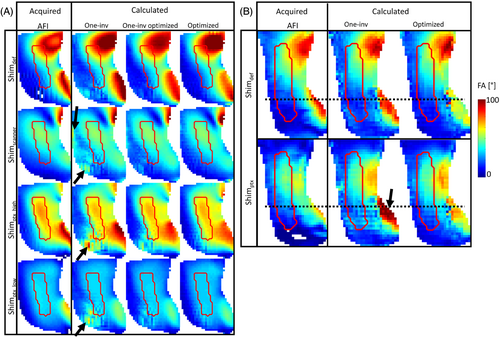
Finally, Figure 7 illustrates the benefit of optimizing and using linear correction for the hybrid satTFL. FA maps were calculated with different RF shims and were compared with acquired AFI. The main benefit of the optimization can again be observed in the lower section of the ROI, where the One-inv encoding sometimes leads to poor prediction of the FA due to insufficient information from the .
3.3 Preliminary application for pTx quantitative T1 mapping
Table 2 (top) shows T1qref, calculated from the reference MP2RAGE (vendor pulses and B1-bias correction) and from pTx-MP2RAGE using basic One-inv encoding (T1qOne-inv), and optimized encoding followed by linear correction (T1qopt,corr) in the phantom. FA maps calculated during the GRAPE optimization are shown in Figure S5. An important bias was measured when using κ = 1 between the reference and pTx T1q calculations, with mean T1qref = 1219 ms and mean T1qopt,corr, κ = 1 = 1102 ms (this difference of almost 10% is greater than intersubject or intersession variability of T1q19). For this exploratory study, it was chosen to empirically calibrate κ relative to T1qref to reduce this bias. This calibration was done by matching the mean T1q over the whole ROI in the phantom for the two methods and was estimated to κ = 0.89. However, even lower T1 were measured from the MP2RAGE based on One-inv, with a remaining global error of 12.6% after calibration. Furthermore, greater SD inside the ROI was measured from the pTx-MP2RAGE.
| T1q Mean ± SD (ms) | T1qref | T1qOne-inv | T1qopt,corr |
|---|---|---|---|
| Phantom κ = 1 | 1219 ± 28 | 975 ± 31 (−20%) | 1102 ± 63 (−9.6%) |
| Phantom κ = 0.89 | N/A | 1065 ± 37 (−12.6%) | 1218 ± 77 (−0.1%) |
| Volunteer 1 cervical level | |||
| C1 | 1210 ± 91 | 984 ± 128 (−18.7%) | 1159 ± 112 (−4.2%) |
| C2 | 1198 ± 74 | 1099 ± 123 (−8.3%) | 1145 ± 95 (−4.4%) |
| C3 | 1187 ± 78 | 1099 ± 112 (−7.4%) | 1137 ± 106 (−4.2%) |
| C4 | 1197 ± 89 | 1113 ± 108 (−7.0%) | 1201 ± 111 (+0.3%) |
| C5 | 1212 ± 103 | 1102 ± 115 (−9.1%) | 1191 ± 116 (−1.7%) |
| C6 | 1217 ± 109 | 1094 ± 112 (−10.1%) | 1205 ± 127 (−1%) |
| C7 | 1222 ± 97 | 1128 ± 98 (−7.7%) | 1212 ± 93 (−0.8%) |
- Note: The reference sequence used Shimdef with vendor pulses followed by B1+ bias reduction. The pTx sequences used GRAPE pulses calculated from One-inv and optimized satTFL. The latter included a linear correction based on the comparison with the AFI. The T1 was averaged over the ROI (phantom) or cord levels, including GM and WM (in vivo). The in vivo reference and pTx T1q were calculated with κ = 1 and 0.89, respectively. Although the reference MP2RAGE was run at the maximum level of SAR, a more than 50% reduction was achieved for the pTx sequences.
- Abbreviations: C, cervical level, GM, gray matter; GRAPE, gradient ascent pulse engineering; opt, corr, optimized and corrected; ROI, region of interest; T1q, quantitative T1 maps; WM, white matter.
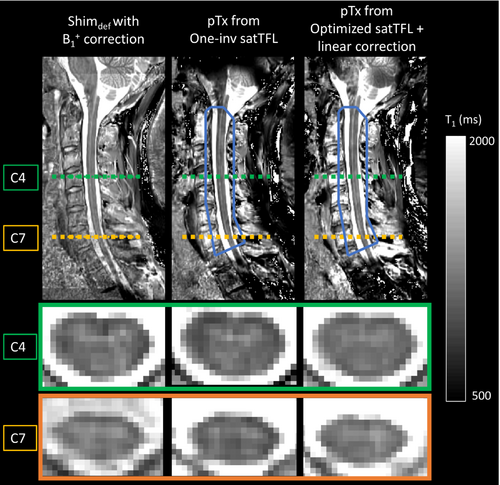
Figure 8 shows in vivo T1q (volunteer 1), acquired and reconstructed in the same conditions as for the phantom experiments. The mean T1 over the whole cord, using the vendor pulses and Shimdef values with B1+ correction and κ = 1, was found equal to 1205 ± 87 ms (it is worth noting that, for volunteer 1, FA deviations from the target FA value were up to 50%; no correction from these heterogeneities would have led to T1q errors up to 12%). The mean T1 over the whole cord using the optimized pTx-MP2RAGE with linear correction and κ = 0.89 was found equal to 1173 ± 112 ms. Table 2 (bottom) shows a quantitative comparison of the measured T1 values averaged over the gray matter and white matter in the different cervical levels. Whereas T1qOne-inv substantially underestimated the T1, with errors of about 8% in C2–C7, and almost 19% in C1, T1qopt,corr, κ = 0.89 presented good agreement with T1qref, with deviations of about 4% in the C1–C3 levels and lower than 2% for C4–C7 levels. Finally, it is worth noting that the reference MP2RAGE was acquired using 100% SAR availability (corresponding to the maximum SAR authorized in first-level mode of operation), whereas pTx-MP2RAGE only required 49% (corresponding to nearly the maximum SAR in normal mode of operation).
4 DISCUSSION
This study demonstrates that interferometric encoding of satTFL B1 mapping such as One-inv, which is largely used in the brain, is not fully adapted to the used spinal cord RF coil. Due to coil-dependent constructive and destructive interference, linear combinations of channels used with these methods may not provide sufficient signal in some regions to accurately reconstruct the individual channel B1 maps. In the case of a cervical spinal cord RF coil with posterior only elements, as used in this study, suboptimal encoding resulted in poor SNR and inaccuracies, in particular near the lower cervical levels.
To overcome these weaknesses and in the perspective of full deployment of pTx, a novel full optimization of the interferometric encoding matrix was proposed. The optimized encoding matrices had different phases from One-inv, which indicates that the interference pattern was changed to better suit the coil configuration. Scaling of the RF modes of One-inv was also shown to be insufficient because it did not correct the distribution of the , which provided little signal across all RF modes in some regions below the C6 cervical level, even with substantial increase of the reference voltage. A full optimization of the encoding was shown to be necessary to provide interferometric encoding adapted to this RF coil, based on its channels and B1 distributions, and using constraints for the maximum FA and local SAR. Because the number of RF channels is lower near the lower part of the cervical cord with the coil used in this study, the B1 accuracy in this region was improved with the proposed method, admittedly with remaining noise for some channels (e.g., channel 4). Furthermore, the similar conditions of the One-inv and optimized matrices, in particular with hybrid encoding, indicate that well-conditioned matrices were found, with low sensitivity to noise variations. The lower valuesmeasured inside the ROI from the difference between acquired B1+ before and after denoising implies that the optimization of the encoding matrix led to a SNR increase in the measured B1+-map, in particular near the lower cervical levels. This indicates that iteratively optimizing the encoding matrix, based on optimized satTFL, may further improve the performance of the proposed approach, although this remains to be evaluated.
In addition to the optimization of the interferometric encoding, it was observed that there existed a linear bias between the AFI and satTFL. This had previously been reported,38, 42, 43 and was shown to be influenced by the echo train length and at least partly due to the transient state of the longitudinal magnetization after the saturation pulse. A thorough study of this effect was beyond the scope of this preliminary work; however, it would be of great interest to prevent it. Although different linear slopes were required to correct the phantom and in vivo satTFL, the two volunteers used in this comparison had similar linear regression results. The stability among more subjects will be investigated in future studies. Because hybrid satTFL had slightly better accuracy than interferometry satTFL (MPE and NRMSE better by 4% and 8%, respectively), with 60% faster acquisition time, this method was chosen as the default B1 mapping sequence for pTx studies at our institution.
Direct benefit from accurate B1 mapping was demonstrated with preliminary investigation of T1 mapping from pTx-MP2RAGE. The standard MP2RAGE sequence often relies on the correction of the B1 bias to provide T1 maps in the presence of B1 inhomogeneities up to a certain range, and the current study only included the C1–C7 spine levels to accommodate this limitation.19 However, pTx-MP2RAGE and optimized-satTFL may enable increasing the coverage of the spinal cord (including pons and medulla oblongata and/or upper thoracis levels, for instance). In addition, the inversion pulse of the default product sequence, which was primarily optimized for brain imaging, relies on high SAR adiabatic pulses and may not be adapted to other applications due to SAR constraints. As a consequence, in the spinal cord, the maximum SAR level is always reached at our institution when running the standard sequence. In this work, it was shown that similar performance could be achieved in vivo without the need for B1 correction, and with a 50% reduction of predicted local SAR. This allowed running the sequence in normal SAR operating mode, which is currently a requirement for pTx sequences at our institution. Differences were nonetheless observed between T1qref and T1q from the pTx-MP2RAGE, with larger SD for the latter, and different mean values when the pulse calculation was based on uncorrected One-inv B1 maps (T1qOne-inv) and on corrected optimized B1 maps (T1qopt,corr). This variation, which may arise from the difference in pulses (adiabatic and non-adiabatic, and different magnetization transfer bias44) was already observed in the brain, for instance, when using universal pTx pulses.45 The calibration factor κ used in this exploratory study was shown to partially compensate for this effect. However, this approach is limited as it uses the calibration of a single parameter to correct the effect of, potentially, different causes. More accurate results may be obtained by properly characterizing those variations in the future, as well as investigating phantom and in vivo bias differences.
In this work, although it was tested on a limited number of volunteers to show preliminary results, the potential of using a “generic” encoding matrix based on the combination of four datasets was also investigated. Indeed, the optimization of the satTFL interferometric encoding could not realistically be performed for each subject because of the large number of degrees of freedom (128 and 144 for the interferometry and hybrid methods, respectively). Further work is required to investigate the robustness of the calculated encoding matrix and linear correction with more subject anatomies. In particular, the current implementation of the optimization provides a unique generic encoding matrix and reference voltage for all subjects. However, although not specific to the proposed approach, it can be expected that variations of the FA distributions of the different RF modes without subject-specific calibration may reduce the performance of the optimized satTFL in some cases. A potential solution may be to normalize the mean FA of all RF modes relative to Shimdef and use a single calibration of this RF shim for all modes.
Current limitations of the proposed method include the potential uncertainties of the AFI data in low FA regions, as biases around 7%, 27%, and 55% were measured for FA = 20°, 15°, and 10°.6 For this reason, FA < 20° were excluded from quantitative comparisons. Other B1 mapping sequences, such as the double angle method43 or phase-based techniques,8 have shown better accuracy in the low FA regime but are less practical for in vivo applications due to scan time, SAR, or sensitivity to magnetic susceptibility variations (particularly present in the spinal cord).8 In addition, denoising of the B1+ maps was performed using the spatial domain filter BM4D due to its low computational complexity,46 providing a satisfactory reduction of noise (average of 28%) to improve the quality of data used for the optimization of the encoding. However, applications such as MR electrical properties tomography, which rely on low-noise B1 maps because some implementations may amplify image noise, have shown that geometric nonlinear diffusion filters may be preferred.47
This work focused on optimization for a given ROI centered on the cervical spinal cord because surrounding tissues were not of interest. However, whole FOV optimizations may be required when pTx is applied for techniques such as reduction of FOV.48 In such cases, when pTx is used to cancel signal excitation outside a smaller FOV to prevent fold-over artifacts, the inaccuracy of satTFL B1 maps may result in ineffective pTx-based cancelation outside the FOV. In particular, high FA regions generated by the encoding RF modes should be avoided to remain within the satTFL accurate FA range,35 as observed in this study in some regions outside the ROI near the coil elements. In this study, optimization of the satTFL was applied to cervical spinal cord MRI, but the same methodology could in principle be applied to other RF coil architectures and other organs. It can be expected that certain coil configurations may strongly benefit from a coil-specific optimization of the interferometric encoding. The presented method only requires B1 and B0 maps, as well as accurate SAR10g prediction (with VOPs for instance) to ensure the feasibility of the optimized encoding. It could therefore be combined with other variations of satTFL B1 mapping, such as 3D acquisitions7, 10 or interleaved RF cycling and complementary reference modes (B1TIAMO),14 aiming to provide robust and accurate inputs for better pTx techniques. The method and code will be shared on demand by directly contacting the authors.
5 CONCLUSIONS
In this study, a novel full optimization of interferometric encoding of satTFL was introduced for 7 T MRI of the spinal cord. The method was evaluated on phantom and in vivo, indicating a need to adjust encoding matrices depending on the coil configuration. The optimization was shown to reduce the deviation between the satTFL and AFI, in particular in low SNR regions such as below the C6 cervical levels. A linear correction of the satTFL was additionally shown to be necessary to better match AFI results, leading to substantial improvement of the accuracy of the optimized satTFL. This improved B1 mapping was used for preliminary investigation of quantitative T1 mapping from standard and pTx-MP2RAGE. Reference and pTx-based T1q using the corrected and optimized satTFL were in good agreement, with no need to correct T1 values for the effect of B1-inhomogeneity, and substantially lower SAR10g, for the latter. The combination of fast and accurate B1 mapping, and rapid pTx pulse calculation, paves the way for improved use of pTx sequences outside the brain in future works.
ACKNOWLEDGMENTS
The authors would like to thank Olivier Girard and Lucas Soustelle for helpful discussions, as well as Véronique Gimenez, Claire Costes, and Lauriane Pini for the study logistics. This work was performed within a laboratory member of France Life Imaging network (grant ANR-11-INBS-0006). The project received support from CNRS, ARSEP Foundation (Fondation pour Aide à la Recherche sur la Sclérose en Plaques), FLI (RE2), Institut Carnot STAR, 7 TEAMS Chair, Institut Marseille Imaging (AMX-19-IET-002) and the French government under the France 2030 investment plan, as part of the Initiative Excellence d'Aix-Marseille Université–A*MIDEX.
CONFLICT OF INTEREST STATEMENT
Aurélien Massire is employed by Siemens Healthcare SAS, Saint-Denis, France.


