Evaluation of 3D stack-of-spiral turbo FLASH acquisitions for pseudo-continuous and velocity-selective ASL–derived brain perfusion mapping
Abstract
Purpose
The most-used 3D acquisitions for ASL are gradient and spin echo (GRASE)– and stack-of-spiral (SOS)–based fast spin echo, which require multiple shots. Alternatively, turbo FLASH (TFL) allows longer echo trains, and SOS-TFL has the potential to reduce the number of shots to even single-shot, thus improving the temporal resolution. Here we compare the performance of 3D SOS-TFL and 3D GRASE for ASL at 3T.
Methods
The 3D SOS-TFL readout was optimized with respect to fat suppression and excitation flip angles for pseudo-continuous ASL– and velocity-selective (VS)ASL–derived cerebral blood flow (CBF) mapping as well as for VSASL-derived cerebral blood volume (CBV) mapping. Results were compared with 3D GRASE readout on healthy volunteers in terms of perfusion quantification and temporal SNR (tSNR) efficiency. CBF and CBV mapping derived from 3D SOS-TFL–based ASL was demonstrated on one stroke patient, and the potential for single-shot acquisitions was exemplified.
Results
SOS-TFL with a 15° flip angle resulted in adequate tSNR efficiency with negligible image blurring. Selective water excitation was necessary to eliminate fat-induced artifacts. For pseudo-continuous ASL– and VSASL-based CBF and CBV mapping, compared to the employed four-shot 3D GRASE with an acceleration factor of 2, the fully sampled 3D SOS-TFL delivered comparable performance (with a similar scan time) using three shots, which could be further undersampled to achieve single-shot acquisition with higher tSNR efficiency. SOS-TFL had reduced CSF contamination for VSASL-CBF.
Conclusion
3D SOS-TFL acquisition was found to be a viable substitute for 3D GRASE for ASL with sufficient tSNR efficiency, minimal relaxation-induced blurring, reduced CSF contamination, and the potential of single-shot, especially for VSASL.
1 INTRODUCTION
In the first consensus paper on pseudo-continuous arterial spin labeling (PCASL),1 the recommended acquisition schemes for cerebral blood flow (CBF) mapping are the segmented 3D readout with EPI-based gradient and spin echo (GRASE) or the stack-of-spiral (SOS)–based fast spin echo (FSE). 3D readout with whole-brain coverage is also recommended for velocity-selective (VS)ASL–based CBF mapping in its first guideline paper,2 and has been demonstrated using 3D GRASE.3-5 The 3D GRASE readout has also been utilized for VSASL-based measurement of cerebral blood volume (CBV).6
Compared to EPI-based Cartesian trajectories, spiral trajectories offer several advantages: higher acquisition efficiency,7 possibility of more incoherent undersampling for accelerated compressed-sensing (CS) reconstruction,8 and robustness to motion artifacts.9 Spin echo–based acquisitions have restricted echo train duration due to T2 decay–induced through-slice blurring and SNR efficiency loss,10 thus usually requiring multiple segments (or shots) to cover the full k-space. 3D ASL scans acquired with a reduced number of segments or even a single shot are desired for higher temporal resolution for functional ASL or mitigating intershot motion.11 Implementation of single-shot 3D PCASL was reported using a pseudo-golden-angle rotated SOS-FSE acquisition with a high undersampling factor of 13 with CS reconstruction for brain connectivity analysis.12 The low constant refocusing flip angles (FA) of FSE employed to reduce the effect of T2 decay during a relatively long echo train would yield a suboptimal pseudo–steady-state signal.13 The spiral-out readouts typically employed for FSE have used less than half of the echo spacing, limiting its efficiency. Instead, a cylindrical spiral-in/-out trajectory was designed to make full use of the echo spacing,14 which may face complications from 3D gridding. Alternatively, image acquisition with turbo FLASH (TFL) allows a longer echo train without severe blurring effects because T1 is typically larger than T2 and T1-induced signal decay is often slower.15 TFL acquisition can also incorporate a spiral-out trajectory starting immediately after the excitation with high acquisition efficiency, which results in a short TE with minimal T2* effect. Segmented 3D SOS-TFL combined with PCASL16 and VSASL17 have been demonstrated for fMRI, however, without direct comparison with 3D GRASE acquisition.
In the current study, for both PCASL- and VSASL-derived CBF mapping as well as for VSASL-derived CBV mapping at 3T, we first adjusted the 3D SOS-TFL readout with respect to fat suppression and excitation FAs. Subsequently, we compared the performance of the optimized protocols with 3D GRASE readout on healthy volunteers, then demonstrated CBF and CBV mapping derived from 3D SOS-TFL–based ASL on a stroke patient to exemplify the potential of the single-shot acquisitions.
2 METHODS
2.1 Experiments
All experiments were performed on a 3T scanner (Achieva; Philips Healthcare, Best, The Netherlands) using a dual-transmit body coil (maximum amplitude 13.5 μT) for RF transmission and a 32-channel head coil for signal reception. When using the maximum slew rate of 200 mT/m/ms, the maximum strength of the gradients is 40 mT/m. Brain images were acquired from 12 healthy subjects (42 ± 14 years old, six females), and one stroke patient 3 months post-onset. The study was approved by the Johns Hopkins school of Medicine Institutional Review Board, and written consent was obtained from all subjects.
We evaluated the feasibility of the SOS-TFL ASL imaging for three applications: PCASL-derived CBF mapping (PCASL-CBF),18 VSASL-derived CBF mapping (VSASL-CBF),3, 19 and VSASL-derived CBV mapping (VSASL-CBV).6, 20, 21
For PCASL-CBF scans, a labeling duration (τ) of 1800 ms and a post-labeling delay of 2000 ms were used. The labeling plane was placed 90 mm inferior to the anterior commissure–posterior commissure line. Background suppression (BS) consisted of a slab-selective pre-saturation module right before labeling and 4 inversion pulses: a slab-selective inversion during labeling (777 ms after the beginning of labeling) and three nonselective hyperbolic-secant inversion pulses 277/1244/1780 ms post-labeling. A vascular crushing module (20 ms) comprised of ±90° hard pulses and double refocused composite pulses (90°x 180°y 90°x) was applied before image acquisition, with gradient lobes in foot–head (FH) direction to dephase signal in large vessels (strength = 9.3 mT/m, duration = 3.6 ms, ramp time = 0.5 ms, VENC = 2.0 cm/s, cutoff velocity Vcut = 1.0 cm/s).
The VSASL-CBF scans started with a global WET presaturation22 (four sequential RF pulses: 72°, 92°, 126°, 193°, each followed by a spoiling gradient) with a 2000 ms post-saturation delay (Tsat). Then, a 64-ms Fourier transform–based (FT-) VSI label/control module was applied with a bolus duration (τ) of 1400 ms (as recommended in the VSASL guideline paper2 and previously described as post-labeling delay). Detailed parameters of the FT-VSI modules were: nine hard excitation pulses (20° each); eight pairs of 180°composite refocusing pulses in between with MLEV-16 phase cycling, surrounded by bipolar/unipolar (for label/control, respectively) gradient lobes in FH direction (strength = 21.8 mT/m, duration = 0.6 ms, ramp time = 0.3 ms, Vcut = 2.0 cm/s, as defined in the guideline paper2). Three adiabatic BS pulses were applied 460/732/1115 ms after the VSI labeling. The same vascular crushing module as in the PCASL-CBF scan was applied before acquisition.
The VSASL-CBV scans started with the same global WET pre-saturation and 2000 ms Tsat as the VSASL-CBF scan. Then a 96-ms FT-velocity-selective saturation (VSS) label/control module was applied immediately followed by image acquisition. Detailed parameters of the FT-VSS modules were: nine hard excitation pulses (10° each); eight pairs of 180°composite refocusing pulses with MLEV-16 phase cycling, surrounded by bipolar/unipolar (for label/control, respectively) gradient lobes in FH direction (strength = 29 mT/m, duration = 1.2 ms, ramp time = 0.6 ms, Vcut = 0.5 cm/s).
For all 12 healthy subjects and the patient, the 3D SOS-TFL perfusion images for PCASL-CBF, VSASL-CBF, and VSASL-CBV were acquired using the default parameters in axial view, with FOV = 220 × 220 × 120 mm3 and resolution = 3.4 × 3.4 × 5.0 mm3 in anterior-posterior (AP) × right–left (RL) × FH direction. The FAs of the TFL excitation pulses were 15°, constructed as 1-3-3-1 binomial water excitation (WE) pulses. The turbo factor of the TFL sequence is 24, applied to slice (FH) direction with centric ordering, identical to the number of slices. A spiral-out trajectory with a readout duration of 11 ms was used, resulting in TR/TE = 18/2.6 ms and an echo train duration of 424 ms. With one TFL shot covering all through-plane encodings, the k-space for each label or control source image was fully sampled in-plane with three spiral interleaves (3-shot), with each shot taking 4.3/3.9/2.6 s for PCASL-CBF/VSASL-CBF/VSASL-CBV scans, respectively. Eight dynamics (label/control pairs) were acquired for averaging, and the total scan times were 3.4/3.1/2.2 min for PCASL-CBF/VSASL-CBF /VSASL-CBV scans, respectively.
For comparison, the TFL acquisition was also performed using Cartesian sampling on three out of the 12 healthy subjects (subjects 1–3) with the same FOV and resolution. The Cartesian sampling used a radial ky-kz centric ordering with a turbo factor of 64 and a smaller FA of 10° considering the larger turbo factor, with TR/TE = 7/3.5 ms and the same echo train duration of 426 ms. The Cartesian images were four-fold undersampled with the vendor-provided CS-SENSE reconstruction. One undersampled 3D control or label source image required four TFL shots (4-shot), each taking the same 4.3/3.9/2.6 s for PCASL-CBF/VSASL-CBF/VSASL-CBV scans, respectively. The total scan times of the four-shot Cartesian sampling with six dynamics were identical to the 3-shot fully sampled SOS-TFL scans with eight dynamics.
On subjects 1–3, use of WE-pulses for fat suppression was compared with conventional excitation pulses with spectral presaturation with inversion recovery (SPIR), which was applied only before the first excitation pulse.
To evaluate the performance of SOS-TFL acquisition with different FAs for binomial WE pulses, TFL excitation FAs of 5°, 15°, and 25° were compared on subject 4; and the excitation FAs of 9°, 12°, 15°, and 18° were compared on three healthy subjects (subjects 5–7).
A comparison of the SOS-TFL acquisition with the GRASE acquisition was conducted on all healthy subjects. The GRASE acquisition had the same FOV as the SOS-TFL scan and a similar resolution of 3.4 × 3.7 × 5.0 mm3 (AP × RL × FH). The parameter setting for GRASE followed the recommendation in the 2015 ASL consensus paper.1 Including all 180° refocusing pulses, the echo train length was 12, with an echo spacing of 13 ms in the slice (FH) direction with centric ordering, resulting in an echo train duration of 162 ms. EPI factor was 15 in the phase-encoding direction (RL), and the readout duration was 9 ms. With a SENSE acceleration factor of 2, one 3D source image required four shots and TR = 4.1/3.6/2.3 s for PCASL-CBF/VSASL-CBF /VSASL-CBV, respectively. Six dynamics were acquired; thus, the total scan times of 3.7/3.3/2.1 min were close to the total scan times of SOS-TFL acquisitions.
On subjects 1–3, the global pre-saturation pulse was compared with a slab-selective pre-saturation pulse on the GRASE-based VSASL-CBF scan. The pre-saturation slab was placed parallel to the imaging slab with the same FH coverage.
For each subject, the perfusion scans with the same labeling technique were scanned together in randomized order. The order of the three labeling techniques was also random. For each different acquisition, three additional scans were performed for perfusion quantification: a proton-density weighted image (PD, TR = 10 s, for normalization), a double inversion recovery (DIR, TR/TI1/TI2 = 10/3.58/0.48 s, to visualize gray matter), and an image acquired immediately after global saturation (Sat) (to record the T1-induced bias of TFL acquisitions for correction of PD and DIR,15, 23 with more explanation in the Discussion section).
2.2 Image reconstruction
The images using the fully sampled 3D SOS-TFL (including deblurring), 3D Cartesian-TFL with a CS-SENSE factor of 4, and the 3D GRASE with a SENSE factor of 2 were reconstructed automatically by the vendor, interpolated to a resolution of 1.7 × 1.7 × 5.0 mm3.
For subject 12, the raw k-space data of the SOS-TFL–based scans (PCASL-CBF, VSASL-CBF, VSASL-CBV, PD, DIR, and Sat) were saved for off-line reconstruction on MatLab (R2021b, MathWorks, Natick, MA). One -shot image had three spiral arms rotated in-plane by 120°, and all three arms together were reconstructed with inverse nonuniform fast Fourier transform as a reference. Single-shot PD, DIR and Sat images were reconstructed with only one out of the three arms with SENSE and CS-SENSE reconstruction. The three-shot ASL source images with eight dynamics were regarded as 24 spiral arms rotated by 120°, and eight out of the 24 arms were reconstructed to a set of single-shot ASL source images with eight dynamics. The total scan times of a single-shot eight-dynamic scan reported by the scanner were 1.2/1.0/0.8 min for PCASL-CBF /VSASL-CBF/VSASL-CBV scans, respectively. Both SENSE and CS-SENSE used the conjugated gradient algorithm, and CS-SENSE used a total variation regularization with a weighing factor of 0.1. Spiral deblurring was implemented using the deconvolution process with kernels calculated from the spiral trajectory and a B0 map.24 B0 maps and sensitivity profiles were obtained directly from default preparation scans automatically conducted by the scanner.
2.3 Data analysis
Perfusion data were analyzed in MatLab as well. Perfusion-weighted signal (PWS) was calculated with the difference image () normalized with the signal of the PD image (), and temporal SNR (tSNR) was calculated as the ratio of the mean value over the SD of the difference image along temporal dynamics. Here we adopted the tSNR efficiency for a fairer comparison between images with different acquisition times, that is, tSNR normalized with the square root of the acquisition time per label/control pair.25-27
For each SOS-TFL–based perfusion map with different FAs, the total variation (TV) along the three orthogonal dimensions was calculated as a quantitative measurement of sharpness.28
For each subject and acquisition scheme, a region of interest (ROI) of the whole-brain gray matter (GM) was automatically segmented on the DIR images for all different acquisition schemes with a full-width-half-maxi thresholding, which is a coarse but fast global thresholding and avoids the bias of manual segmentation. Regional GM ROIs within frontal, temporal, parietal, and occipital lobes were also selected. Global and regional quantitative perfusion metrics, and their corresponding tSNR efficiency, were averaged within the GM ROIs.
3 RESULTS
Figure S1 shows the DIR with segmented GM ROIs, PWS, and tSNR efficiency images of the Cartesian TFL (FA = 10°) sampling and the SOS-TFL (FA = 15°) on one axial slice of subject 1. Compared to Cartesian TFL, SOS-TFL resulted in similar PWS values respectively for each labeling technique but much less noisy PWS maps for all labeling techniques. Table S1 summarizes the average and SD of perfusion and tSNR efficiency from whole-brain GM ROIs of the three subjects, showing about 2.6/2.9/2.2 times higher tSNR efficiency of SOS-TFL than Cartesian TFL for PCASL-CBF, VSASL-CBF, and VSASL-CBV methods, respectively.
The benefit of WE over SPIR is demonstrated in Figure S2. SPIR scans show severe fat-related artifacts in all control images and PWS of PCASL-CBF of all three subjects, as well as DIR and PWS of VSASL-CBF images of subjects 2 and 3. Artifacts were not visible on the PWS of VSASL-CBV images. This could be explained by the fast T1 recovery of the fat signal after SPIR during image acquisition. Artifacts were not visible on PWS images of any subject for VSASL-CBV, possibly due to the higher CBV-weighted PWS than CBF-weighted PWS (control images of CBV scans were shown with a higher color bar range) and additional suppression of fat by FT-VSS. On WE scans, no obvious artifacts were observed.
Figure 1 and Figure S3 array the DIR, PWS, and tSNR efficiency of SOS-TFL with FAs of 9°, 12°, 15°, and 18° (subject 5, Figure 1); and with FAs of 5°, 15°, and 25° (subject 4, Figure S3). PWS maps with larger FA were less noisy but blurrier compared to those with smaller FA, which was most visible comparing FAs of 5° and 25° of subject 4 in Figure S3. tSNR efficiency for PCASL-CBF and VSASL-CBV increased with FA, but that for VSASL-CBF approached maximum at FA = 15° for the two cases demonstrated. For subjects 4–7, Figure 2 plots the quantitative PWS, tSNR efficiency, and TV of the 3D perfusion map from whole-brain GM ROIs as a function of FA: PWS values were consistent between different FAs; tSNR efficiency increased with FA; and TV of the perfusion maps was negatively correlated to FA, indicating decreased sharpness (more blurring) with increased FA.

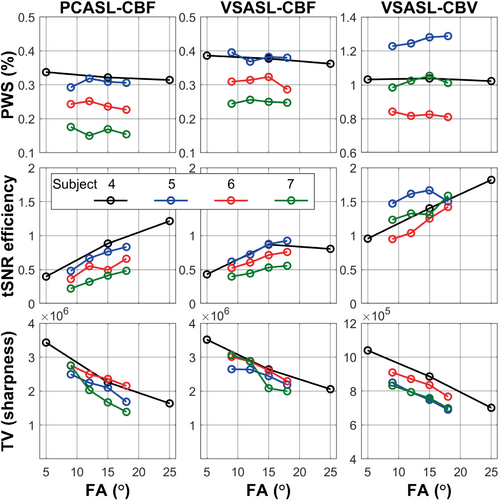
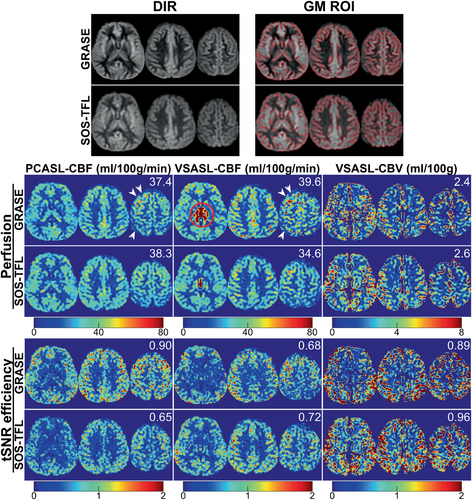
Figure 3 demonstrates that SOS-TFL (FA = 15°, WE)–based CBF and CBV maps are comparable to GRASE on a representative subject (subject 8). Note that SOS-TFL–based VSASL-CBF maps reduced CSF artifacts compared to GRASE (red circles).
The 3D SOS-TFL–based perfusion maps (FA = 15°, WE) were successfully obtained from all 12 subjects. The cross-section images in three orthogonal orientations of the remaining subjects were shown in Figure S4, all showing high image quality and good gray and white matter contrast, except low PCASL-CBF for subject 11, most likely due to slow blood flow, especially for areas perfused by posterior cerebral arteries.
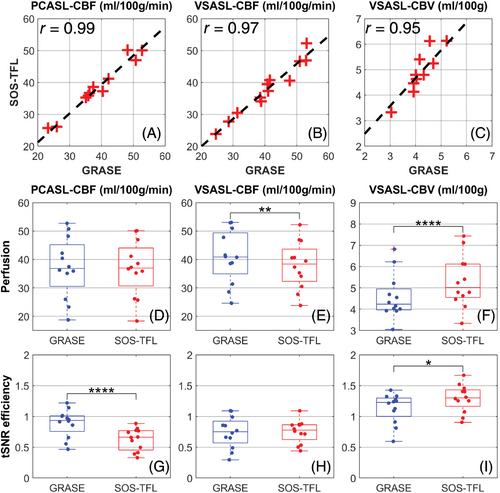
The correlations of the whole-brain GM perfusion between SOS-TFL and GRASE for all 12 subjects are plotted in Figure 4A–C, showing high correlation coefficients (r ≥ 0.95) for all labeling techniques. In Figure 4D–F, the box plot of whole-brain GM perfusion for all 12 subjects comparing SOS-TFL to GRASE had no significant difference for PCASL-derived CBF (−1.1%, 36.8 ± 9.8 vs. 37.3 ± 10.7 mL/100 g/min, p > 0.05), but was significantly lower for VSASL-derived CBF (−7.1%, 37.9 ± 8.3 vs. 40.8 ± 9.3 mL/100 g/min, p ≤ 0.01) and significantly higher for VSASL-derived CBV (+15.8%, 5.3 ± 1.2 vs. 4.6 ± 1.1 mL/100 g, p ≤ 0.001). In Figure 4G–I, the box plot of whole-brain GM tSNR efficiency for all 12 subjects comparing SOS-TFL to GRASE was significantly lower for PCASL-CBF (−29.4%, 0.63 ± 0.18 vs. 0.89 ± 0.23, p ≤ 0.001), but had no significant difference for VSASL-derived CBF (+1.6%, 0.75 ± 0.19 vs. 0.74 ± 0.26, p > 0.05) and was significantly higher for VSASL-derived CBV (+14.1%, 1.29 ± 0.22 vs. 1.13 ± 0.24, p ≤ 0.05). The correlations and comparison of the regional GM perfusion metrics between the two readouts are plotted in Figure S5, revealing their significant differences mainly in parietal and occipital lobes.
3D SOS-TFL–based perfusion images of a patient 3 months following a hemorrhagic stroke involving the right dorsal insula and deep GM are shown in Figure 5. Decreased CBF was observed in the right parietal lobe region distal to the site of hemorrhage (purple circles).
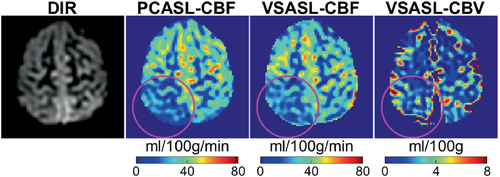
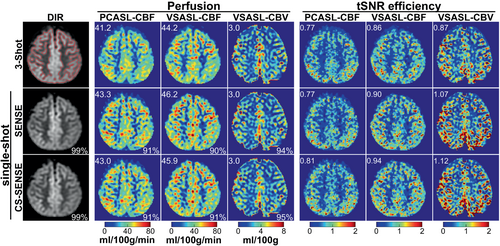
Figure 6 and Figure S6 present the off-line images reconstructed from the representative undersampled raw data of one of the three interleaved spiral arms, with acceleration factor R = 3 for single-shot, as well as the fully sampled three-shot images as reference. For PD, DIR, and ASL source images, the Pearson correlation coefficients between undersampled single-shot images and fully sampled three-shot images were very high for both SENSE (≥ 97%) and CS-SENSE (≥ 98%). The Pearson correlation coefficients were slightly lower for perfusion maps but were still sufficiently high for both SENSE (90%–94%) and CS-SENSE (91%–95%). Perfusion values averaged within the GM ROIs were quite close between fully sampled and undersampled images for both SENSE (undersampled/fully sampled = 1.05, 1.05, 0.99) and CS-SENSE (undersampled/fully sampled = 1.04, 1.04, 0.99); and the tSNR efficiency of single-shot images were higher than the 3-shot reference for SENSE (undersampled/fully sampled = 1.00, 1.05, 1.23) and CS-SENSE (undersampled/fully sampled = 1.05, 1.09, 1.28) for PCASL-derived CBF, VSASL-derived CBF, and VSASL-derived CBV, respectively. CS-SENSE reconstruction yielded closer perfusion values and higher tSNR efficiency than SENSE.
4 DISCUSSION
We demonstrated the feasibility of 3D SOS-TFL acquisitions for PCASL- and VSASL–based perfusion quantification. Results showed the tSNR benefit of spiral acquisition over Cartesian and the much more complete removal of fat artifacts when using WE instead of SPIR. Compared to the employed 4-shot 3D GRASE with an acceleration factor of 2, the fully sampled 3D SOS-TFL delivered comparable performance (with a similar scan time) using three shots, which can be undersampled with SENSE or compressed sensing to achieve single-shot acquisition with higher tSNR efficiency.
SOS-TFL acquisition offers the flexible choice of excitation FA for desired balance between tSNR efficiency and image blurring. For example, for functional ASL, a larger FA might be preferred to improve tSNR. A potential way to reduce image blurring for both GRASE and SOS-TFL is to incorporate carefully designed variable flip angles (VFAs).16, 29, 30 Theoretically, using VFA instead of a constant FA has little effect on the tSNR of SOS-TFL because it is primarily affected by the first FA.16 In this work, we chose a constant FA of 15° that is easily achievable on the scanner for a feasibility study. The benefit of VFA for VSASL remains to be explored in future studies.
One advantage of SOS-TFL over GRASE for VSASL-derived CBF mapping is the reduction of CSF contamination (Figure 3) because CSF signal labeled due to the pulsatile motion is still a main challenge of the VSASL technique.2 The most likely reason for reduced CSF contamination in the TFL acquisition compared to the GRASE acquisition is the increased T1-weighting. The whole-brain GM CBF averaged from the 12 subjects was 37.9 ± 8.3 mL/100 g/min by SOS-TFL–based VSASL, 7.1% lower than the 40.8 ± 9.3 mL/100 g/min by GRASE-based VSASL, but not significantly different from the 36.8 ± 9.8 and 37.3 ± 10.7 mL/100 g/min by both SOS-TFL– and GRASE-based PCASL (Figure 4D,E). GRASE-based VSASL might slightly overestimate CBF in brain parenchyma adjacent to subarachnoid space.2 However, the lower CBF measured by SOS-TFL over GRASE only in parietal and occipital lobes but not in frontal and temporal lobes (Figure S5) is intriguing, which could be related to the longer arterial transit time incurred in parietal and occipital lobes than in frontal and temporal lobes. The exact mechanism accounting for this effect warrants further investigation.
The potential of single-shot 3D ASL using SOS-TFL with accelerated reconstruction is demonstrated for one representative subject in this work (Figure 6) (Figure S6). Further technical development is underway to improve its performance by employing variable density spiral trajectories,31 golden angle rotation,12 and better image reconstruction. As recently being done for VSASL with multi-shot GRASE readout,32 the reproducibility of VSASL with single-shot SOS-TFL acquisition will also need to be evaluated. The higher temporal resolution could allow applications such as functional and resting state ASL,12, 16, 17 along with more effective motion correction.
Based on our previous point spread function analysis,15 the image signal and the prepared longitudinal magnetization before the TFL acquisition obey a linear (y = kx + b and b ≠ 0) relationship, with the intercept of the linear function coming from the readout itself as a T1-induced bias. For magnetization-prepared TFL with low-high profile ordering, the k-space filtering effect induced by the T1 relaxation leads to a reduced contrast-to-noise ratio of the signal prepared before the readout and an additive readout-related bias. This additive bias is identical for control, label, PD, and DIR images when using the identical TFL acquisition module. As a result, the subtraction between control and label images fully eliminates the bias. A quick Sat image captured this bias to be subtracted from PD and DIR images, as utilized in an ultrashort B1 mapping protocol.23
5 CONCLUSIONS
Different SOS-TFL acquisitions were evaluated for PCASL and VSASL sequences for brain perfusion mapping. Spiral acquisition obtained much higher tSNR compared to Cartesian-based readout. Water excitation was necessary to eliminate fat-induced artifacts for SOS-TFL. The choice of FAs needs to balance image blurring and tSNR efficiency. SOS-TFL reduced CSF artifacts for VSASL-derived CBF mapping and increased tSNR efficiency for VSASL-derived CBV mapping. For PCASL- and VSASL-based CBF and CBV mapping, especially for VSASL, SOS-TFL acquisition was found to be a viable substitute for GRASE, with sufficient tSNR efficiency and minimal relaxation-induced blurring, reduced contamination from CSF, and the potential of further acceleration to even single shot.
FUNDING INFORMATION
Qin Qin was supported by the National Institutes of Health (NIH), grants R01 HL138182 and R01 HL144751; Peter C.M. van Zijl was supported by the NIH, grants P41 EB031771, P50 HD103538, and S10 OD021648.


