Considerations for hyperpolarized 13C MR at reduced field: Comparing 1.5T versus 3T
Click here for author-reader discussions
Funding information: Horizon 2020 FETFLAG MetaboliQs, Grant/Award Number: Grant/Award Number: 820374; Maexi Foundation (Zurich, Switzerland) Project: CMRPredict
Abstract
Purpose
In contrast to conventional MR, signal-to-noise ratio (SNR) is not linearly dependent on field strength in hyperpolarized MR, as polarization is generated outside the MR system. Moreover, field inhomogeneity-induced artifacts and other practical limitations associated with field strengths 3T are alleviated at lower fields. The potential of hyperpolarized C spectroscopy and imaging at 1.5T versus 3T is demonstrated in silico, in vitro, and in vivo for applications on clinical MR systems.
Theory and Methods
Theoretical noise and SNR behavior at different field strengths are investigated based on simulations. A thorough field comparison between 1.5T and 3T is performed using thermal and hyperpolarized C spectroscopy and imaging. Cardiac in vivo data is obtained in pigs using hyperpolarized [1-C]pyruvate spectroscopy and imaging at 1.5T and 3T.
Results
Based on theoretical considerations and simulations, the SNR of hyperpolarized MR at identical acquisition bandwidths is independent of the field strength for typical coil setups, while adaptively changing the acquisition bandwidth proportional to the static magnetic field allows for net SNR gains of up to 40% at 1.5T compared to 3T. In vitro C data verified these considerations with less than 7% deviation. In vivo feasibility of hyperpolarized [1-C]pyruvate dynamic metabolic spectroscopy and imaging at 1.5T is demonstrated in the pig heart with comparable SNR between 1.5T and 3T while B artifacts are noticeably reduced at 1.5T.
Conclusion
Hyperpolarized C MR at lower field strengths is favorable in terms of SNR and off-resonance effects, which makes 1.5T a promising alternative to 3T, especially for clinical cardiac metabolic imaging.
1 INTRODUCTION
Hyperpolarized C MRI and MR spectroscopy (MRS) are used for monitoring real-time metabolism in vivo.1-3
Typically, in vivo hyperpolarized C MRI / MRS are performed at field strengths 3T. Especially clinical examinations and preclinical studies in large animals are usually conducted at 3T1 due to commercially available hardware suitable for the respective subject sizes with the capability of detecting non-H nuclei.
In the classical MR signal-to-noise ratio (SNR) paradigm, higher field equals higher SNR. In hyperpolarized MR, however, lower field strengths can be favorable in larger subjects such as humans and pigs, with a higher theoretical SNR for typical coil sizes and loading conditions.4 Moreover, reduced static magnetic fields alleviate frequent challenges related to susceptibility effects,5-7 field inhomogeneities, patient exposure (specific absorption rate),4 and other constraints as mentioned in the following.
Various works in hyperpolarized MR address off-resonance-induced imaging artifacts such as geometric distortions, blurring, and local signal dephasing.8-16 As field inhomogeneities are proportional to the static magnetic field, data acquisition at lower field strengths is less prone to off-resonance-related artifacts, and thus, improved image quality can be achieved.
In-bore electrocardiogram (ECG) signals are commonly derived to synchronize acquisitions with the subject's heartbeat, either to account for intra-beat motion and pulsatile flow, or to serve as reference for bolus dynamics in case of (hyperpolarized) contrast agents. In the MR environment, the ECG signal is corrupted by the field-dependent magnetohydrodynamic effect,17 posing additional practical challenges to examinations at higher field strengths. As unreliable ECG triggering can render an examination unusable, this is of particular interest to (hyperpolarized) MR with contrast agent administration, where scans cannot easily be repeated.
The above-mentioned considerations have led to the majority of clinical H cardiovascular MR examinations being performed at 1.5T rather than 3T,18 and hence, integration of hyperpolarized MR into existing clinical protocols is not straightforward. Adopting a moderate field strength of 1.5T is therefore considered an important step toward clinical translation of hyperpolarized cardiovascular MR in a multimodal context.
Consequently, this work examines the potential of hyperpolarized C MRS and MRI at the clinically established field strength of 1.5T with the focus on cardiac applications. Based on theoretical considerations and simulations, SNR performance of hyperpolarized C MR at field strengths 3T is investigated. Furthermore, an extensive field comparison between 1.5T and 3T using C MRS and MRI is performed on thermally polarized phantom and hyperpolarized in vitro data. Feasibility and suitability of in vivo hyperpolarized [1-C]pyruvate dynamic metabolic MRS and MRI at 1.5T is explored in a pig model.
2 THEORY
2.1 Noise and SNR
2.2 Bandwidth adaption
3 METHODS
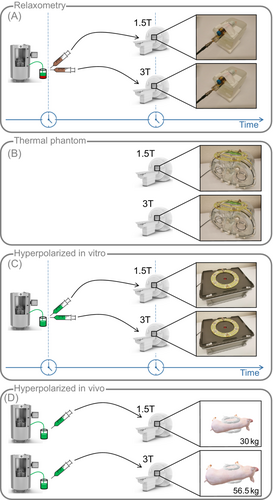
To validate the theoretical SNR considerations from the previous section, Q-ratio and relaxometry measurements followed by simulation, thermal phantom, hyperpolarized in vitro and in vivo experiments are presented as depicted in Figure 1.
Relaxometry, phantom, in vitro, and in vivo field comparison experiments were performed on clinical 1.5T and 3T scanners (Achieva / Ingenia; Philips Healthcare) equipped with identical transmit-receive RF chains including identical integrated preamplifiers, and using geometrically identical coils tuned to 16 and 32 MHz, respectively. Loop sizes were fixed between field strengths for anatomical reasons assuming an optimal geometry for the target organ (heart). Sequence parameters are listed in Table 1. For hyperpolarization, [1-C]pyruvic acid doped with 15 mM trityl radical was polarized to >40% in a commercial SpinLab hyperpolarizer (General Electric Healthcare) and dissolved in neutralization media yielding 250 mM [1-C]pyruvate solution.
| Thermal phantom | Hyperpolarization in vitro | Hyperpolarization in vivo | |
|---|---|---|---|
| (Section 3.4) | (Section 3.5) | (Section 3.6) | |
| Slice- and Nonselective spectroscopy | |||
| Flip angle | 90 | 10 | 10 |
| Slice thickness | 300 mm | 30 mm | 30 mm |
| Averages | 128 | 1 | 1 |
| Dynamics | 1 | 1 | 120 |
| Acquisition bandwidth (full) | 32 kHz | 32 kHz | 32 kHz |
| Retrospectively reduced | 16 kHz | 16 kHz | |
| Spiral and EPI imaging | |||
| Flip angle | 30 | 30 | 30 (SPSP) |
| Field of view | 220220 mm | 100100 mm | 220220 mm |
| In-plane resolution | 55 mm | 33 mm | 55 mm |
| Reconstruction resolution | 11 mm | 11 mm | 11 mm |
| Slice thickness | 30 mm | 30 mm | 30 mm |
| Averages | 128 | 1 | 1 |
| Dynamics | 1 | 1 | 25 |
| Interleaves | 1 | 1 | |
| Partial Fourier factor | 0.75 | 1.0 | 0.75 |
| Spiral acquisition window 1.5T / 3T (full) | 26.4 ms / 26.4 ms | 26.3 ms / 33.5 ms | |
| Reduced | 44.2 ms / 44.2 ms | ||
| EPI bandwidth 1.5T / 3T (full) | 1600 Hz / 1600 Hz | 1000 Hz / 750 Hz | 1600 Hz / 1100 Hz |
| Reduced | 800 Hz / 800 Hz |
- Abbreviations: EPI, echo-planar imaging; SPSP, spectral-spatial.
- For slice-selective spectroscopy only.
- For spiral imaging only.
- For EPI only.
An overview of the applied coils and experimental setups can be found in Figures S2 and S3.
Data reconstruction and quantification were performed in MATLAB (MathWorks).
3.1 Q-ratio measurements
To determine the noise regime, Q-ratio measurements were performed with two (16.06 and 32.12 MHz) geometrically identical in-house built C single-loop coils ( cm) using the dual probe method26 (two geometrically decoupled pick-up coils, cm, Figure S2A) and using an E5071C network analyzer (Agilent Technologies). The Q-ratio was determined for various loads with the single-loop coil placed at varying distances ranging from 5 to 110 mm between the conductive coil structures and the subject's chest (Figures S3A and S4).
3.2 Relaxometry experiments in vitro
To examine the field dependency of relaxation times, and values of hyperpolarized [1-C]pyruvate in blood were determined in vitro using C MRS at 1.5T and 3T.
Relaxation parameters were measured simultaneously on 1.5T and 3T scanners using geometrically identical in-house built C transmit-receive volume saddle coils ( cm, length cm, Figures S2B and S3B). For each measurement, 250 mM neutralized hyperpolarized [1-C]pyruvate solution was dissolved in fresh venous pig blood to achieve concentrations between 12.5 and 250 mM (neat). The pyruvate-blood mixtures were then divided into two samples to ensure consistent polarization and concentration between measurements at both field strengths. All experiments related to blood samples were approved by the Cantonal Veterinary Office.
T relaxation was acquired using a custom slice-selective Carr-Purcell-Meibloom-Gill (CPMG) sequence27 (30 mm slice thickness) with 1024 echoes and an echo-spacing of 10 ms. T relaxation times were obtained as the average from the even and odd echoes' monoexponential fit of the spectral maxima.
T relaxation was determined using dynamic slice-selective pulse-acquire spectroscopy (5 flip angle, 25 mm slice thickness) with 10 acquisitions separated by 10 s. T relaxation times were fitted monoexponentially from the averaged first three free induction decay (FID) samples according to: with s and .
To investigate the impact of T relaxation-induced signal loss on the SNR field comparison, a simple two-stage bolus timing model28 (Figure S6) was implemented in MATLAB to simulate the SNR loss due to longitudinal relaxation of hyperpolarized pyruvate prior to injection (stage 1, neat pyruvate) and postinjection until myocardial bolus peak (stage 2, varying pyruvate-blood concentrations). The model was parameterized based on the experimentally determined T relaxation times at 1.5T and 3T, respectively.
3.3 Computer simulations
Based on the theoretical elaborations from Section 2, noise resistance values, absolute noise levels, and intrinsic SNR of a hyperpolarized C MR signal using fixed and adaptive acquisition bandwidth were simulated in MATLAB to analyze SNR performance at different field strengths.
Theoretical noise behavior was investigated for field strengths between 0.5T and 3.5T and for coil radii of cm representing a range of target anatomies. Based on that, the corresponding relative SNR scaling was simulated for fixed and adaptive acquisition bandwidth, and for target depths (distance of the coil to the target organ) of cm. For the noise resistance values according to Equation (6), a single-looped copper coil with mm wire thickness (radius) and 29 was simulated at a distance cm to a semi-infinite conducting sample of muscle (Figure S1). Noise contributions according to Equation (7) were simulated for coil and sample temperatures of K, K, and an acquisition bandwidth of kHz. For the final SNR scaling as stated in Equation (8), coil sensitivities were simulated according to the Biot–Savart law with a signal point source. Noise figures of preamplifiers and other receive chain components were considered constant.
Synthetic spectra of hyperpolarized [1-C]pyruvate with downstream metabolites lactate, pyruvate hydrate, alanine, and bicarbonate were simulated with fixed and adaptive acquisition bandwidth based on the intrinsic SNR calculations. Using the experimentally determined values for a realistic in vivo pyruvate concentration in blood (12.5 mM) (Section 3.2), field-dependent scaling of was simulated according to Equation (12). The amplitudes of the individual metabolites were scaled in a qualitative manner to represent an exemplary C spectrum.
3.4 Thermal phantom experiments
Using thermal C urea spectroscopy and imaging, a field comparison between 1.5T and 3T with respect to SNR and field inhomogeneity effects was performed on an anthropomorphic torso phantom (SPECT; Supertech) containing a saline solution ( S/m) in the main part of the torso, and a myocardial compartment filled with gadolinium-enriched thermal (nonhyperpolarized) C urea (4.5 M) (Figure S3C).
Measurements were conducted on clinical 1.5T and 3T scanners with geometrically identical in-house built single-loop ( cm) C transmit-receive coils (Figure S2C).
3.5 Hyperpolarized in vitro experiments
In addition to the thermal phantom experiments, an in vitro field comparison between 1.5T and 3T was performed for hyperpolarized C pyruvate spectroscopy and imaging.
250 mM neutralized [1-C]pyruvate solution was injected approximately 30 s after dissolution into test tubes embedded into boxes filled with a TX151 solidifying powder-water mixture ( S/m) as illustrated in Figure S3D. For each dissolution, slice-selective spectroscopy, nonselective spectroscopy, as well as spiral and EPI images were acquired consecutively. Data acquisition was synchronized between 1.5T and 3T scanners using the same hyperpolarized pyruvate solution and geometrically identical in-house built single-loop ( cm) C transmit-receive coils (Figure S2C).
Spectroscopic data were acquired using slice-selective and nonselective pulse-acquire spectroscopy with fixed acquisition bandwidth. Spectral SNR and pSNR were determined according to Equation (14).
Imaging was performed with spiral and EPI readouts with fixed acquisition bandwidth. Image SNR and pSNR were determined according to Equation (15).
3.6 Hyperpolarized in vivo experiments
In vivo data were acquired in anesthetized healthy female pigs (Swiss Large White “Edelschwein”) on clinical 1.5T and 3T systems with geometrically identical dual-loop ( cm) C transmit-receive Helmholtz-like surface coils (PulseTeq; Chobham) (Figure S2D). For each measurement, 0.7 ml/kg of 250 mM neutralized hyperpolarized [1-C]pyruvate solution were injected approximately 20 s postdissolution over 10 s into the femoral vein. Two injections following dynamic metabolic spectroscopy or imaging, respectively, were performed per animal. Dynamic data were acquired during suspended ventilation using cardiac synchronization and triggering based on ECG at 1.5T, and peripheral pulse unit (PPU) at 3T due to a poor ECG signal. All experiments were performed in accordance with the Swiss Animal Protection Law and Ordinance.
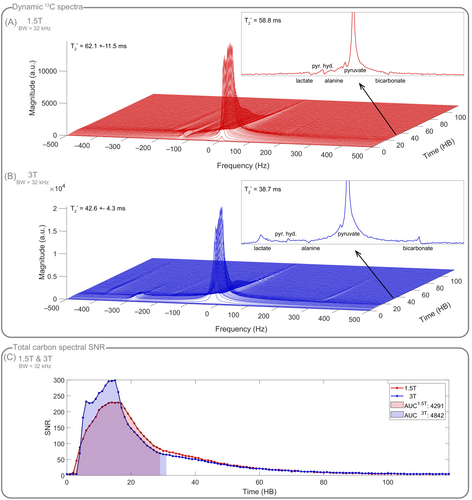
Spectroscopic data were acquired using slice-selective pulse-acquire spectroscopy with fixed acquisition bandwidth. Spectral SNR was calculated in the time domain from the maximum FID magnitude and the standard deviation of the noise tail (200 samples) for each dynamic frame separately, yielding the SNR time curve for the total carbon signal (lactate, pyruvate hydrate, alanine, pyruvate, and bicarbonate). The area under the curve (AUC) was calculated by signal integration of the total carbon SNR over peak dynamic scan time.
In addition to metabolic imaging, H field maps for off-resonance correction were obtained using multi-echo acquisition,10 and anatomical reference 2D cine cardiac images were acquired using a cardiac gated balanced steady-state free precession gradient echo sequence.10
4 RESULTS
4.1 Q-ratio measurements
In accordance with the theory, the Q-ratios of the 32 MHz coil were higher for all subject loads and coil-subject distances compared to the 16 MHz coil, and the Q-ratios decreased with increasing distance of the coil to the subject, asymptotically approaching a ratio of 1, i.e. (Figure 2).
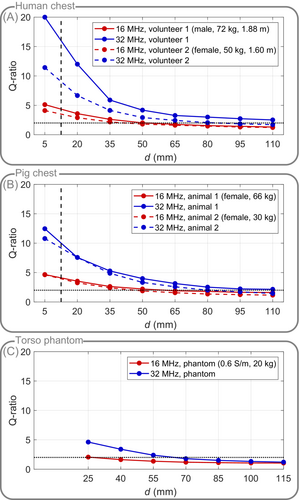
For both humans and pigs, the measured Q-ratio at minimum coil-subject distance (5 mm) was larger than 4 for both resonance frequencies, and thus, sample noise exceeds coil noise. However, considering padding and patient protection results in a minimum distance for typical in vivo coils of approximately 10-15 mm. Hence, at a realistic coil-subject distance of 12.5 mm (interpolated), the experimentally determined Q-ratios were 3.5 or higher for in vivo loads. Loading with the torso phantom has a larger effective distance due to its acrylic wall, resulting in a maximum Q-ratio of 2.1 for the 16 MHz coil.
S11 measurements performed along with the S21-based Q-ratio measurements (Supporting Information Figure S4) can be found in Supporting Information Figure S5.
4.2 Relaxometry experiments in vitro
As expected, relaxometry measurements for pyruvate-blood concentrations between 12.5 mM and 250 mM (neat) yielded longer values and shorter values at 1.5T compared to 3T as depicted in Figure 3. The relative differences between relaxation times at 1.5T compared to 3T across all pyruvate concentrations in blood average and .
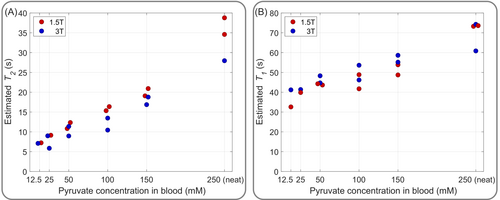
Due to the reduced amount of blood relative to pyruvate, and hence, reduced exposure to paramagnetic iron, both and relaxation parameters increase for higher pyruvate-blood concentrations at both field strengths.
The estimated transverse relaxation times are between 6 and 39 s, and hence, even for low concentrations of pyruvate in blood still relatively long. Assuming field inhomogeneities of ppm, yields according to Equation (12) for a realistic in vivo pyruvate-blood concentration of 12.5 mM ( s, s) a scaling of 1.9915 between 1.5T and 3T which deviates less than 0.5% from the theoretical scaling of . Based on that, the results verify Equation (12), and by exploiting this longer at lower fields, the acquisition bandwidth can be adapted proportionally to to increase SNR (Equation 13) without increasing field inhomogeneity effects.
Using the two-stage bolus timing model (Figure S6) together with the measured values from Figure 3B, yields the T relaxation-induced SNR loss at 1.5T and 3T as reported in Table S1. The average SNR gain across all measured pyruvate-blood concentrations at 3T compared to 1.5T solely due to longer , amounts to a negligible () percentage points, and therefore, T relaxation can be neglected in the theoretical SNR predictions for the field comparison.
4.3 Computer simulations
As demonstrated in Figure 4A–C on the left, simulations of theoretical noise contributions suggest that small coils with 2.5 cm radius are coil noise-dominated for field strengths up to T, while increasing the coil radius to 10 cm results in sample noise dominance for the clinically relevant range of field strengths T. For body imaging, in particular for cardiac applications, typically coils with large radii are used, and hence, sample noise exceeds coil noise. However, in larger coils, the absolute noise voltages are in general higher due to the increased electrical- and sample-induced noise seen by the coil, and therefore, the optimal coil size has to consider also the depth of the target organ, which is examined in Figure 4A–C on the right. In case of fixed acquisition bandwidth, the SNR penalty at 1.5T compared to 3T is less than 5% for a coil with 5 cm radius although sample and coil noise are of similar order at 1.5T. While the SNR penalty increases to 23% for small coils with 2.5 cm radius, the SNR is about the same at both field strengths for larger coils with 10 cm radius. For adaptive acquisition bandwidth, SNR is comparable between 1.5T and 3T even for small coil radii of 2.5 cm, and increases up to 46% SNR gain at 1.5T compared to 3T for coils with 10 cm radius. Nevertheless, the overall noise for a 10 cm coil is about eight times (3T) and six times (1.5T) higher than for a 2.5-cm coil.
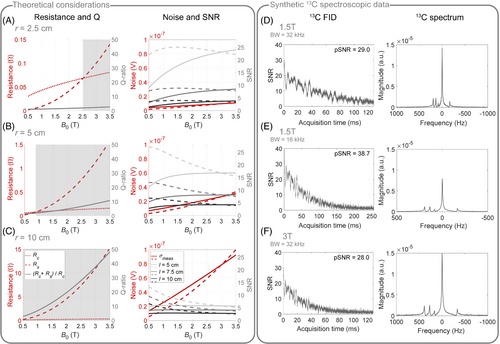
As illustrated in Figure 4D–F, exemplary simulated C spectroscopic data at 1.5T and 3T demonstrate that SNR is comparable between 1.5T and 3T at identical acquisition bandwidths (D F). Comparing both spectra illustrates the reduced spectral span of the metabolites at 1.5T compared to 3T, which, together with the twice longer at 1.5T, can be utilized to reduce the acquisition bandwidth by up to a factor of two (E) in order to effectively increase SNR by at 1.5T versus 3T.
4.4 Thermal phantom experiments
As no hyperpolarization was used for the thermal C urea torso phantom, SNR at 1.5T is expected to be half that of 3T for fixed acquisition bandwidth. While spiral imaging yielded the expected SNR ratio of 0.5, spectral and EPI SNR ratios deviated about 20% and 12% to the disadvantage of 1.5T, respectively (Figure 5A).
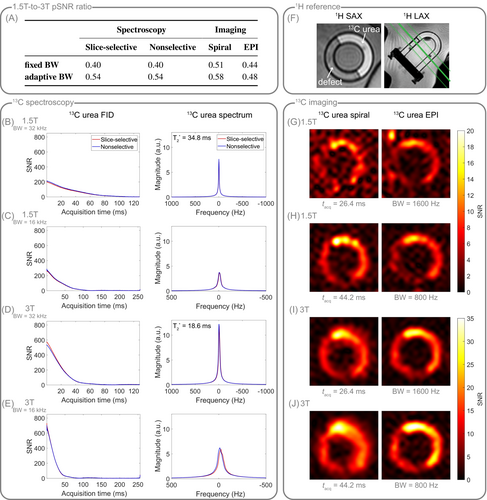
For adapting the acquisition bandwidth by a factor of , SNR is expected to scale with according to Equation (10) at thermal polarization. For the spectroscopic data, retrospectively reducing the bandwidth at 1.5T by a factor of two, yielded the expected SNR improvement of approximately (Figure 5A–E). For spiral imaging, the acquisition windows of the low- and high-bandwidth images were 44.2 and 26.4 ms, respectively, resulting in a bandwidth scaling of , and thus in an SNR ratio of between 1.5T and 3T, which is verified by the data. In EPI, the readout does not start in k-space center, and hence, reducing the acquisition bandwidth by half does not behave as predicted but still improves SNR by 10%.
Spiral and EPI images (Figure 5G–J) demonstrate that reducing the acquisition bandwidth generally improves SNR, even at 3T, but at the cost of increased field inhomogeneity effects like blurring (spiral) and stretching (EPI), as well as reduced effective spatial resolution (H / J versus G / I). In general, blurring is noticeably reduced at 1.5T compared to 3T, even for low acquisition bandwidth at 1.5T (H) and high acquisition bandwidth at 3T (I). Reducing the acquisition bandwidth at 1.5T visibly increases SNR compared to the higher bandwidth acquisition without severely suffering from blurring or stretching, respectively (H vs. G), whereas at 3T, reducing the bandwidth qualitatively leads to more blurring and stretching, respectively, but less SNR improvement (J vs. I). The optimal acquisition bandwidth, which maximizes SNR while retaining spatial resolution, is largely dependent on , and therefore, longer readouts are generally favorable at 1.5T.
4.5 Hyperpolarized in vitro experiments
Using hyperpolarized [1-C]pyruvate spectroscopy in vitro, for identical acquisition bandwidths, the ratio of the spectroscopic SNR obtained at 1.5T and 3T amounts to (slice-selective) / (nonselective), and thus agrees with the expected theoretical SNR ratio of 1 (Figure 6A). Retrospectively reducing the bandwidth by a factor of two at 1.5T allows to increase SNR, resulting in a 1.5T-to-3T SNR ratio of (slice-selective) / (nonselective), which matches the expected SNR ratio of .
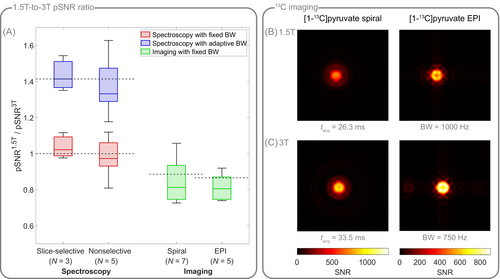
For spiral and EPI images (Figure 6A–C), the SNR ratio between 1.5T and 3T amounts to and , respectively. Due to different gradient hardware at 1.5T and 3T, acquisition bandwidths varied between field strengths (Table 1), resulting in a bandwidth scaling of (spiral) / 1.33 (EPI), and thus in an expected SNR ratio of (spiral) / (EPI) between 1.5T and 3T, which deviates 5 % (spiral) / 7% (EPI) from the experimentally determined SNR ratio.
4.6 Hyperpolarized in vivo experiments
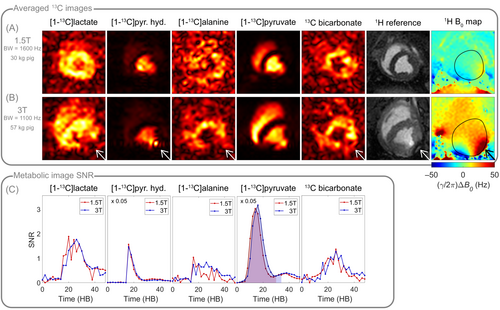
The following presented in vivo data (Figures 7 and 8) were acquired at 1.5T and 3T in two different pigs (30 kg at 1.5T and 56.5 kg at 3T).
In vivo dynamic cardiac spectroscopy of hyperpolarized [1-C]pyruvate and its downstream metabolites at 1.5T and 3T with fixed acquisition bandwidth yielded a 1.5T-to-3T SNR ratio of 0.89 based on the AUCs of the total carbon SNRs (Figure 7).
For dynamic EPI of hyperpolarized [1-C]pyruvate and its downstream metabolites at 1.5T and 3T, SNR time curves of the individual metabolites, and the 1.5T-to-3T pyruvate AUC ratio of 0.9 confirm that comparable SNR was achieved between field strengths (Figure 8) despite the lower EPI bandwidth at 3T (Table 1) due to different gradient hardware, leading to a bandwidth scaling of , and hence in an expected SNR ratio of between 1.5T and 3T. The typical off-resonance effects in the inferior region of the myocardium are significantly reduced at 1.5T, both in metabolic C images and H cine images. Improved shimming is apparent in the corresponding H field maps. Further in vivo data acquired at 1.5T can be found in Figure S8.
5 DISCUSSION
In this work, the potential of hyperpolarized C MRS and MRI at 1.5T compared to 3T has been demonstrated in silico, in vitro, and in vivo.
Theoretical considerations combined with simulations have shown that the SNR of hyperpolarized MR signals at identical acquisition bandwidths is independent of the field strength for typical coil setups. By adaptively changing the acquisition bandwidth proportional to the static magnetic field, motivated by reduced spectral span and longer at lower field strengths, we predicted that net SNR gains of up to 40% at 1.5T compared to 3T can be achieved.
Simulation results are subject to assumptions, such as sample noise dominance, long , and comparable relaxation among field strengths, which were validated based on experimentally determined Q-ratios and relaxation parameters, respectively. Scanner system-related noise contributions, for example, from receive chain electronics or low-noise amplifiers LNAs,31 were considered field-independent and therefore neglected in the theoretical SNR considerations. While typical hardware is capable to operate at frequencies down to 10 MHz, this frequency range is not a focus during system design, and hence the filter characteristics of the RF cabin and receive chain might need to be adjusted and optimized. Moreover, SNR simulations were based on a signal point source rather than a realistic target shape. Considering not only the depth but also the shape of the target would underline the requirement for larger coils, and hence favorable SNR scaling in many in vivo applications. The remaining uncertainties caused by the simplifications are not believed to substantially affect the conclusions drawn herein.
In addition to the simulations, a thorough field comparison between 1.5T and 3T was performed on thermal phantom and hyperpolarized in vitro C data. It is important to note that in vitro experiments were conducted under identical conditions, namely coil design, transmit–receive RF chains including integrated preamplifiers, acquisition sequence, phantom design, as well as same hyperpolarized [1-C]pyruvate solution and equal duration from dissolution to scan time. Spectroscopy and imaging results verified that for thermal polarization, SNR at 1.5T is about half the SNR at 3T, while hyperpolarization allowed to mostly retain SNR when going from 3T to 1.5T. Reducing the acquisition bandwidth allowed to increase SNR at 1.5T in both cases as expected. All results were within a maximum error margin of 20% for thermal and 7% for hyperpolarized C MR.
For the phantom and in vitro SNR field comparison using spiral imaging, the increased point spread function widening at 3T due to stronger field inhomogeneities, and the associated lower resolution and hence increased SNR, have not been considered. Consequently, for spiral imaging, the expected 1.5T-to-3T SNR ratio is effectively lower.
Grid-like artifacts were observed in the EPI images of the thermal phantom after averaging (Figure S7). Albeit these artifacts appear at both field strengths, they are less severe at 3T, and therefore, EPI SNR scaling for the thermal phantom might have been compromised to the disadvantage of 1.5T.
Finally, in vivo feasibility of hyperpolarized [1-C]pyruvate metabolic spectroscopy and imaging at 1.5T was demonstrated in the pig heart. Both spectroscopy and imaging data showed comparable SNR between 1.5T and 3T, while B artifacts were noticeably reduced at 1.5T, which supports the elaborated hypotheses. However, in contrast to the presented in vitro experiments, in vivo data were not acquired exclusively under identical conditions due to experimental complexity. Data were obtained in different pigs using equally prepared hyperpolarized pyruvate solutions. Nevertheless, polarization duration, and time from dissolution to injection were comparable, and identical coils and sequences were used for data acquisition. For a fair comparison, data with similar injection bolus timing and duration were chosen, however, the diversity of image qualities (Figure S8) suggests that intersubject variability caused by subject size, weight, metabolic state, and heart rate, impact SNR to a large degree. Hence, the in vivo data presented in Figures 7 and 8 are solely representing exemplary data quality at 1.5T. In addition to intersubject variability between animals, intrasubject variability caused by metabolic condition, positioning, preparation, and different hyperpolarized dissolutions impair direct comparison of hyperpolarized metabolic imaging for consecutive measurements in one animal in two different scanners. Therefore, a conclusive in vivo field comparison is not feasible in a direct experimental implementation, but requires a high sample size to be statistically meaningful, which is not only demanding but also ethically controversial.
In summary, as predicted theoretically and by simulations, our hyperpolarized in vitro and in vivo data showed comparable SNR between 1.5T and 3T without bandwidth scaling while reducing field inhomogeneity effects, which is consistent with previous work of hyperpolarized Xe and He lung MRI comparing 1.5T and 3T5, 7, 32 as well as field strengths 1.5T.6
A major limitation of the in vitro and in vivo measurements is that the imaging bandwidths were not the same at 1.5T and 3T (Table 1) due to different gradient hardware settings. More precisely, the bandwidth at 3T was lower compared to 1.5T which improves SNR scaling to the advantage of 3T so that we observed lower SNR at 1.5T than at 3T although equal SNR was expected. Nevertheless, we compensated for that during the evaluation as explained in the corresponding Results sections.
Reducing field strength in hyperpolarized MRI offers two advantages that need to be traded off against each other: On the one hand, if acquisition bandwidth is kept constant, which retains SNR, unwanted field inhomogeneity effects like blurring, geometrical distortions, or signal dephasing are reduced. On the other hand, lowering the acquisition bandwidth with reduced field strength can increase SNR at the cost of reduced spectral separability and similar B artifacts. As shimming is generally more robust at lower field, B effects are still partly reduced. This trade-off has to be balanced for each experiment individually depending on the applied acquisition strategy. Furthermore, reducing bandwidth for readouts which do not start in the k-space center, such as EPI, will prolong echo times, limiting the net SNR gain in practice. Consequently, the effective impact on image quality with respect to SNR and B effects is subject to thorough sequence design on a per-case basis.
In metabolic imaging, spectral separation of metabolites either by spectrally selective excitation,33-35 or by echo shift encoding36, 37 poses a challenge. At lower fields, the reduced chemical shift leads to longer echo times which partly counteract the longer , thus limiting the available SNR gain. In particular selective excitation of [1-C]pyruvate and its downstream metabolites at 1.5T is very challenging due to the small chemical shift of 50 Hz between pyruvate hydrate and lactate/alanine, respectively, which imposes a minimum total RF pulse duration. MRS of hyperpolarized C pyruvate on the other hand is generally less limited by the lower frequency separation of peaks at lower fields, and hence, fully benefits from longer at 1.5T compared to 3T. Nevertheless, the resulting constraints of reduced spectral separation on the acquisition heavily depend on the hyperpolarized substrate and hence chemical shifts of the peaks.
While this work is based on large single- or dual-loop coils ( cm), often coil arrays of multiple smaller loops are used to improve the detection sensitivity without limiting the field of view,21 or for making use of parallel imaging.38 For hyperpolarized C body imaging, the individual loops of such arrays typically have radii around 5 cm38, 39 (or corresponding rectangular sizes with similar areas40), for which sample noise still slightly exceeds coil noise at 1.5T (Figure 4). However, our Q-ratio measurements showed that the 16 MHz single-loop coil with 10 cm radius is already at the limit and hence coil arrays with small loops might be coil noise-dominated and therefore not beneficial at lower fields.
Especially for cardiac applications, where large coil diameters are common, hyperpolarized MRI at 1.5T is a promising alternative to 3T as it showed less off-resonance-related artifacts and dephasing near venous vessels and lung spaces. Furthermore, ECG triggering is more reliable at 1.5T, and thus the need of repositioning the ECG electrodes or switching to peripheral pulse oximetry devices due to poor ECG signals, as often necessary at 3T, can be avoided. Lastly, hyperpolarized MR at 1.5T offers the possibility to integrate C metabolic imaging into the clinical workflow facilitating multi-modal cardiovascular MR.
6 CONCLUSION
We have demonstrated that hyperpolarized C MRS and MRI are not only feasible but also suitable at clinical 1.5T setups offering comparable or even better SNR compared to 3T. In particular for cardiac metabolic imaging, hyperpolarized MRI at 1.5T proved to be capable of enhancing image quality by increasing SNR or by reducing B-induced artifacts when compared to 3T. Consequently, hyperpolarized C MRI at 1.5T allows addressing challenges with respect to SNR and off-resonance effects, which are currently seen in hyperpolarized metabolic imaging at 3T.
ACKNOWLEDGMENTS
The authors would like to acknowledge Miriam Weisskopf and Christian Stoeck for animal handling and care.
Open Research
DATA AVAILABILITY STATEMENT
The simulation code of Section 3.3 is publicly available at https://gitlab.ethz.ch/ibt-cmr-public/13c_field_comparison_simulation.git.


