Interventional cardiac MRI using an add-on parallel transmit MR system: In vivo experience in sheep
Funding information
Supported by the Medical Research Council (MRC) developmental pathway funding, grant MR/N027949; the Wellcome/Engineering and Physical Sciences Research Council (EPSRC) Centre for Medical Engineering, grant WT 203148/Z/16/Z; and the British Heart Foundation (BHF), grant FS/20/26/34952.
Abstract
Purpose
We present in vivo testing of a parallel transmit system intended for interventional MR-guided cardiac procedures.
Methods
The parallel transmit system was connected in-line with a conventional 1.5 Tesla MRI system to transmit and receive on an 8-coil array. The system used a current sensor for real-time feedback to achieve real-time current control by determining coupling and null modes. Experiments were conducted on 4 Charmoise sheep weighing 33.9-45.0 kg with nitinol guidewires placed under X-ray fluoroscopy in the atrium or ventricle of the heart via the femoral vein. Heating tests were done in vivo and post-mortem with a high RF power imaging sequence using the coupling mode. Anatomical imaging was done using a combination of null modes optimized to produce a useable B1 field in the heart.
Results
Anatomical imaging produced cine images of the heart comparable in quality to imaging with the quad mode (all channels with the same amplitude and phase). Maximum observed temperature increases occurred when insulation was stripped from the wire tip. These were 4.1℃ and 0.4℃ for the coupling mode and null modes, respectively for the in vivo case; increasing to 6.0℃ and 1.3℃, respectively for the ex vivo case, because cooling from blood flow is removed. Heating < 0.1℃ was observed when insulation was not stripped from guidewire tips. In all tests, the parallel transmit system managed to reduce the temperature at the guidewire tip.
Conclusion
We have demonstrated the first in vivo usage of an auxiliary parallel transmit system employing active feedback-based current control for interventional MRI with a conventional MRI scanner.
1 INTRODUCTION
Metallic interventional devices pose a risk in MRI because they are susceptible to RF-induced currents, which can produce dangerous tissue heating.1-3 Additionally, visualizing standard guidewires with MRI is difficult. Together, these factors present substantial obstacles to MRI-guided cardiovascular interventions. This is unfortunate considering that MRI provides improved soft-tissue contrast and can provide functional measures such as flow and eliminates radiation dose.4, 5 Similar risks of RF-induced heating are present for any elongated conductive device used in cardiac interventions, including guidewires, exchange wires, or braided catheters.
Many approaches have been proposed to solve the 2 major challenges of using guidewires in MR for interventional procedures; safety and visualization. Guidewire safety might be acheived using low RF power6 or lower B0 field strength (i.e., lower frequency) systems.7 Operating at low power in a conventional MRI scanner can provide a safety margin but with tradeoffs in imaging performance required for visualization of both anatomy and guidewires.6 Low field-strength scanners are a promising alternative but are not widely available. Alternatively, devices made from materials such as plastic or fiberglass have been investigated.8 Although reducing the risk from heating, these may not have suitable mechanical properties for all types of intervention. For visualization, a range of approaches is possible, including the use of susceptibility-related effects,9, 10 auxiliary contrast markers,11, 12 or some form of a local signal detector mounted on or integrated into the device.13-15 In like manner, detecting signal at the device tip has been achieved by modifying guidewires with active components,12, 16, 17 but these modification approaches require development of bespoke interventional devices.
The physical mechanism responsible for unsafe RF-induced currents is RF coupling between transmit coils and the guidewire. This depends on both the electric field tangential to the guidewire and the sensitivity of the wire to transfer energy to the tip, both of which are spatially varying in magnitude and phase.2, 18, 19 Adjustment of the spatial distribution of incident electric field is not possible with a conventional single channel transmit MRI system but can be achieved using parallel transmission (pTx).20, 21 For interventional work, Gudino et al.21 demonstrated this in vivo using simulated RF fields to predict and therefore minimize induced currents based on knowledge of the path of a wire through space. Etezadi-Amoli20 et al. presented a framework for computing safe modes for excitation using current sensor measurements that can be made in real time. The advantage of this second approach is that it allows for an active feedback mechanism independent of the imaging being undertaken. This is important because the coupling depends on details of the device, including the length (especially the inserted length), diameter, and presence or absence of electrical insulation.22, 23 Furthermore, during a typical procedure such as a cardiac intervention, the insertion length and location of the guidewire are constantly changing, suggesting the need for an active and real-time RF-induced current control system.
Following Etezadi-Amoli et al., if the coupling between each transmit coil element and the guidewire can be quantified, then a series of pTx operation “modes” can be defined. These can be classified as either coupling modes (CM), which induce currents in the guidewire; or null current modes (NM), which null currents20, 24, 25 at the point of measurement. Although these modes can generate/null currents, they do generate RF magnetic fields ( ); thus, they can allow MRI to proceed but with very different safety profiles.26 NMs restrict RF-induced currents well in MR imaging of deep brain stimulators24, 25, 27 and guidewires.21 In contrast, the CMs can produce dangerously high guidewire currents usually not used for imaging. However, coupling modes can enhance the transmit fields adjacent to the guidewire; thus, by working at ultralow transmit amplitude CMs, they can be used for safe device visualization.26, 27 A similar effect has been achieved using birdcage coils.28
Aside from 2-channel birdcage devices used by modern 3 Tesla MRI systems, commercial pTx systems are typically restricted to ultrahigh field MRI. However investigational pTx systems have been described in the literature.29-31 We have designed and built an “auxiliary” active pTx device that can be used to augment a standard MRI scanner, enabling 8-channel transmission with dynamic control of CM and NM achieved through real-time measurement of currents on inserted guidewires.32 In this work, we describe first experience of deploying this device for interventional cardiac MRI using standard guidewires in an in vivo sheep model, including both safety assessment and device visualization.
2 METHODS
2.1 Design overview and implementation
This study was carried out using an unmodified 1.5 Tesla system (Magnetom Aera, Siemens Healthcare, Erlangen, Germany). A schematic diagram of the dynamic auxiliary pTx system, which is described in full in Ref. [32] is shown in Figure 1. In the brief, the pTx system receives the scanner’s high-power RF output, attenuates, and splits this into 8 parallel channels with equal amplitudes. It then uses low-power vector modulation to implement per-channel amplitude and phase control before re-amplification by a bank of 8 RF power amplifiers.
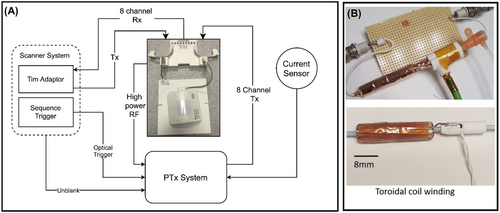
Real-time monitoring of the RF-induced currents into the guidewire was achieved using an inductively coupled toroidal current sensor.33 The sensor was built from 1 mm-diameter transformer wire coiled in the long-axis direction through a 5 mm-diameter plastic tube, providing space for the guidewire to pass through the tube Figure 1B. The sensor was wrapped with copper foil to block incident RF energy, and a 10 m shielded balanced twin-pair line was attached to the coil and connected to a balun. This same sensor was also used for direct excitation of the guidewire in some experiments, described later.
The auxiliary pTx system was controlled using a bespoke MatLab (R2015A, MathWorks, Natick, MA)-based user interface (see Supporting Information Figure S1) running on a PC, which also acted as a data logger recording guidewire currents. This architecture facilitated mode updates between individual RF pulses; however, because it was asynchronous and interrupt-based, it did not provide full dynamic pTx,34 which was not necessary for our application.
- To control the modes of coupling actively and continuously to the guidewire while operating transparent to the scanner so that the scanner maintains all functionality and control over the transmit RF signal. This was achieved by ensuring the total pTx system gain (from coil connector to transmit array) had a default value of unity.
- To require minimal physical connections to an unmodified scanner (see Figure 1A). The system connected to a standard RF output available on the MRI scanner bed via the total imaging matrix plug intended to connect to local transmit coils. Other essential connections were the RF amplifier unblanking signal, which is located under a removable cover, and an optic-fiber trigger pulse that is typically used for functional MRI.
The custom-built transceiver 8-channel surface coil array used (RAPID Biomedical, Rimpar, Germany) was composed of 3 main parts: an interface box and 2 surface arrays (anterior and posterior), each consisting of 4 coil elements.33 The interface box was connected to the scanner’s total imaging matrix adaptors and handled routing of the outgoing high-power RF signal and returning (modulated and re-amplified) per-channel pTx RF signals.
2.2 MRI sequence integration
2.2.1 RF-coupling measurement
A detailed description of the RF-coupling measurement can be found in Ref. [20]. In short, a coil-to-guidewire coupling matrix C is required to compute the system RF-coupling mode. It is measured frequently during any invasive procedure to account for potential changes in RF coupling. This is achieved by adding an off-resonance pulse (to avoid interacting directly with the magnetization) into a chosen target pulse sequence. An example is illustrated in Figure 2, which shows a single-shot turbo spin echo (ssTSE) sequence modified by adding a trigger event followed by 20 ms rectangular pulse with amplitude 40V and frequency offset 5 kHz (parameters can be set on the scanner console). On receiving the trigger, the pTx system sets all channels to 0 output power, commencing the measuring cycle during the 5 kHz rectangular pulse, which cycles through the transmit channels 1 at a time while the digitizer records the resulting current-sensor signal to obtain C.

Singular value decomposition of C results in a matrix V of right singular vectors that specify the required operational modes.20 For measurements from n current sensors, the first n columns of V correspond to per-channel weightings (RF shims) for the CMs; the remaining columns form matrix  and define the NMs.26 Depending on the choices made within the software, a new RF-shim computed from updated C can be immediately applied to the subsequent RF pulses or simply logged, with a maximum update time of 50 ms. For the experiments reported this type of measurement was integrated into a ssTSE sequence, which was used for guidewire visualization using CM excitation26; and a balanced steady-state-free-precession (bSSFP) sequence for anatomical imaging, usually exploiting NM. For ssTSE, 1 measurement event was used per TR; for bSSFP, events were included at a frequency of once per full image frame to avoid interrupting the steady state too often.
2.2.2 RF-shimming using null modes
 homogeneity and respects per-channel peak power limits can be calculated as described in Ref. [26]. The RF shim calculation requires
  maps for each coil in the array, which were obtained as described below (section 2.3.1). The result of this calculation is a complex vector of weights, w, to be applied to each channel. Previous work described a “static” scenario in which w is not dynamically updated. In this work, for real-time RF-induced current nulling, w must be updated regularly and potentially at the same rate at which C is updated because C will change as the guidewire is manipulated. Recomputing w can take several seconds; instead, a real-time RF shim wrt is rapidly estimated from the optimal RF shim using the most recently determined set of NMs
  :
:
 (1)
(1)This is guaranteed to yield a safe combination according to the newly updated coupling measurement but not necessarily to yield an optimally uniform  field; safety is prioritized. The software was configured such that either option is possible, the intention being that during a slow period (guidewire is inserted into the body but not actively manipulated) a full calculation of w can be performed, whereas during active manipulation the real-time updates continue to maintain safety by using wrt.
2.3 Experiments
Imaging experiments were performed on phantoms and an animal model. All experiments involved the use of a single standard nitinol guidewire with a polyurethane outer coating of 0.89 mm diameter (RF+GA35153M, Terumo Corporation, Tokyo, Japan). In some of these experiments, the coating was stripped from the tip of the guidewire (~2 mm exposed), and the guidewire length itself was trimmed to enhance potential heating effects (details below). All other devices, such as the introducer sheath, were made of plastic only such that the guidewire was the only potential source of heating and was the focus for all measurements. In all cases, a single current sensor was used, located externally within 10 cm of the entry point of the guidewire into the phantom or body of the animal.
Throughout all MR experiments, the temperature at the tip of the guidewire was monitored using a fiber-optic temperature probe (LumaSense Technologies, Inc. Santa Clara, California). The optic fiber was attached at several locations to the guidewire with nylon thread such that the temperature sensor was flush with the guidewire tip. The guidewire tip was selected for temperature monitoring because it is accepted from the literature that this would be the site for worst-case heating.24, 35, 36
2.3.1 MR imaging protocols
For piloting, the pTx system was operated in a predefined quadrature mode (quad) in which each channel has the same amplitude and a fixed phase relationship. At the start of the imaging session for each intervention, per coil  mapping was performed using presaturated TurboFLASH37 with 2 averages; this is a standard vendor sequence but was modified such that the
  -encoding saturation and the imaging readout pulse could be cycled between channels of the pTx system. To ensure sufficient signal in each imaging acquisition, all channels were activated in an “interferometric” approach38 instead of activating only 1 channel per acquisition. Trigger pulses were added to the sequence to signal to the pTx system to switch RF shim as required. Because neither the coil nor the subject was moved during the MRI-guided procedure experiments, it was assumed that these initial field maps would remain pertinent for the entire examination.
A standard bSSFP cine sequence was used for anatomical imaging. This had 1.8-mm in-plane resolution and 6-mm slice thickness (FOV: 340 mm × 298 mm) with TR/TE 2.70 ms/1.16 ms, flip angle 44°, 2 signal averages, GRAPPA factor 2, and retrospective cardiac gating with 25 phases, total scan time 29 s.
In vivo visualization
Visualization of the guidewire was performed using CM excitation with ssTSE at low net average power as described in Ref. [26]; the power level was adjusted manually to get the best visualization result. The ssTSE was demonstrated to provide optimal guidewire visualization because it has a signal profile that is highly sensitive to variations in flip angle.26 The method uses a projection through an 80 mm-thick slab. Echo train length of 86, 62% phase partial-Fourier reconstruction, and GRAPPA 2 were used to give a TE of 41 ms. A TR of 3000 ms was used to prevent saturation effects during in vivo test conditions. The nominal resolution was 1.76 mm in plane with a FOV of 450 mm × 450 mm. In phantom experiments, a TR/TE of 300 ms/36 ms was used.
An alternative method of direct guidewire excitation was also attempted. In this case, the current sensor was connected directly to the output of 1 RF power amplifier. This approach was attempted using the ssTSE sequence just described, as well as a bSSFP sequence with a variable frequency offset to reduce off-resonance artifacts from air–tissue interfaces. The RF power was adjusted manually to improve image quality.
2.3.2 Phantom experiments
A 14 L container filled with polyacrylic acid gel made according to the ASTM International standard39 was used to test performance of the pTx system. The properties of the gel were measured as relative permittivity 79.0 ± 1.0 and conductivity 0.531 ± 0.006 Sm−1. A 140 cm-long guidewire with stripped tip was placed approximately axially (i.e., in the scanner z direction) into the gel, then exiting the phantom through a hole and trailing along the scanner bed. The short guidewire length was chosen to demonstrate a case of extreme heating. Guidewire visualization as described above was performed in the phantom.
Worst-case heating was demonstrated by running a bSSFP scan at high power for 6 min with the following parameters: TR/TE = 3.38 ms/1.67 ms, flip angle = 70°. In practice, the maximum power was limited by the peak on 1 channel. After each heating acquisition, the temperature returned to baseline. This heating protocol was used in all heating experiments, in phantom, in vivo, and post-mortem.
2.3.3 Animal study
The major objective of these tests was to validate that the pTx system could operate safely and maintain low temperatures at the tip of a guidewire while also performing structural MRI. The ability of the system to aid visualization of the guidewire was also investigated. Experiments were performed using a combined MRI and X-ray angiography suite (Artis Zee, Siemens Healthcare) installed in adjacent rooms. All procedures involving animals were approved by the Animal Research Ethics Committee (CEEA 50 - France) and performed in accordance with the European rules for animal experimentation. Animal experiments were conducted both in vivo and post-mortem on Charmoise sheep (N = 4) weighing 33.9-45.0 kg. The sheep model was selected for having heart dimensions, body weight, and physiology similar to humans. Premedication was performed by intramuscular injection of ketamine (10-20 mg/kg, Axience, Pantin, France), acepromazin (0.1 mg/kg, Vetoquinol, Lure, France), and buprenorphine (9 µg/kg, Virbac, Carros, France). Anesthesia was then induced with an intravenous injection of propofol (1 mg/kg, Mylan, France) and maintained by oral–tracheal gaseous inhalation (15 breath per min) of 1%-3% Isoflurane (Axience, France) in 50/50 oxygen/air using a MR-compatible ventilator (Aestivia, General Electric, Fairfield, CT). Heart rate, body temperature, and blood oximetry were monitored continuously (Maglife, Schiller, France) until completion of the procedure. The subjects were euthanized by lethal IV injection of 80 mg/kg of exagon (Axience, France). After anesthesia was induced, standard nitinol guidewires were inserted using X-ray angiography with access via the femoral vein into the right ventricle of the heart. Subjects were placed in the supine position for both X-ray insertion and subsequent MR imaging.
In vivo heating
To test different heating scenarios, guidewires of different lengths were used, in some cases with the insulating coating stripped from the tip because this represents a worst-case heating scenario.2 Stripped coating is referred to as a stripped tip, whereas intact insulating coating is referred to as insulated tip from hereon. In subject 1, a shortened guidewire 140 cm long with stripped tip was used. This guidewire was inserted with a 60 cm-long 13Fr sheath to prevent abrasion or puncture of vessels from the exposed guidewire tip, which was left in place during imaging. In the remaining 3 subjects, experiments were performed using a standard unmodified guidewire 260 cm-long and with an insulated tip (RF-PA35263M, Terumo Europe), or a modified guidewire as detailed in Table 1; the guidewire length was modified to 164 cm to account for a longer 96 cm-long plastic 13Fr sheath. Once the guidewire was in the desired place, the sheath was retracted to expose about 4 cm of the guidewire’s distal end. In subject 4, the sheath was completely removed after placement of the guidewire in the right heart ventricle. Exchange of wires was performed under X-ray guidance. Each subject was euthanized after the final imaging experiment to allow for further heating tests to be conducted post-mortem to exclude the effects of blood flow effects on heating.
| Subject | Length | Tip | Visualization | Sheath Length |
|---|---|---|---|---|
| 1 45 kg | 140 cm | Stripped | CM | 60 cm |
| 2 44 kg | 164 cm | Stripped | CM | 96 cm |
| 3 38 kg | 260 cm | Insulated | CM | 96 cm |
| 164 cm | Stripped | CM/direct | 96 cm | |
| 4 33 kg | 164 cm | Stripped | CM/direct | Pulled out |
- CM: visualization using coupled mode excitation; direct: use of the current sensor as a transmitter; pulled out: removing the sheath after placing the guidewire; and stripped: wires with stripped coating at the tip.
3 RESULTS
3.1 Phantom tests
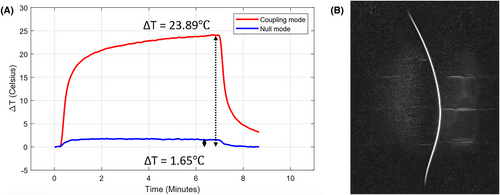
A temperature increase of 23.9℃ was measured at the guidewire tip inside the gel phantom while operating at CM after 6 min of scanning, as shown in Figure 3A. In contrast, when operating in the NM at equivalent RF power level, the observed maximal temperature increase was 1.65℃. The measured average total forward power was 40W and 38W for CM and NM, respectively. The visualization of the guidewire using CM excitation and ssTSE sequence is presented in Figure 3B. The average total forward power during the visualization sequence was 2.6W, and there was no observable temperature increase.
3.2 In vivo imaging
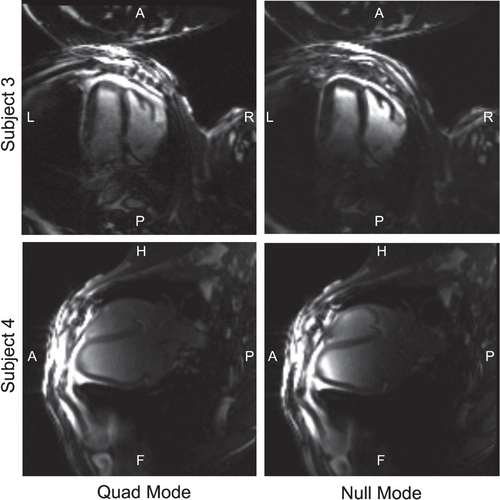
Figure 4 illustrates single frames from cine bSSFP images of subjects 3 and 4 in 4-chamber view. The “quad” mode image uses the transmit array with predefined and fixed RF shim between coils (not guaranteed to be safe), whereas the NM image uses a safe RF shim consisting of only NM optimized to produce a uniform excitation in the heart. Acceptable image quality is achievable when only using NMs. The use of a surface array resulted in brighter signal at the surface; note that receive sensitivity correction was not applied. Figure 5 shows measured B1 maps for subjects 3 and 4.
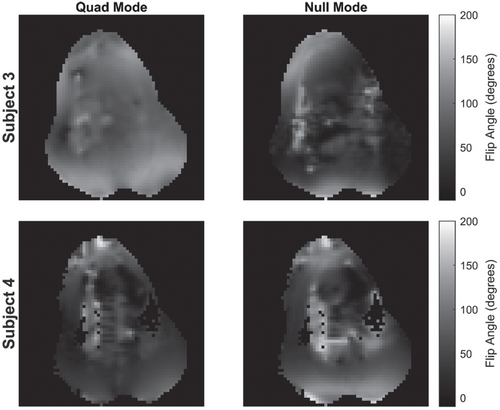
 (flip angle) maps for subjects 3 and 4 in quad and null mode (nominal flip angle 80°). The axial plane is shown in all maps
3.3 In vivo heating
Table 2 shows the measured temperature at the guidewire tip, taken both in vivo and post-mortem during high-power heating test scans. Reported temperature changes are differences between 30 s averages (see Supporting Information Figure S2 for a full temperature profile), taken immediately before and at the end of each 6 min scan (in subject 1, 2 min scans were used), and the Standard deviation of the temperature during this period. Average total power of approximately 100W was used for both NM and CM temperature measurement.
| Subject | Guidewire Length | Tip Condition | Temperature Change (℃) | |||
|---|---|---|---|---|---|---|
| In vivo | Post-mortem | |||||
| Coupling | Null | Coupling | Null | |||
| 1 | 140 | Stripped | 4.14 ± 0.05 | 0.38 ± 0.07 | 6.02 ± 0.06 | 0.47 ± 0.07 |
| 2 | 164 | Stripped | 0.39 ± 0.17 | 0.13 ± 0.06 | 2.14 ± 0.02 | 0.15 ± 0.03 |
| 3 | 164 | Stripped | 0.08 ± 0.04 | 0.07 ± 0.02 | 3.21 ± 0.03 | 0.04 ± 0.02 |
| 4 | 164 | Stripped | 0.33 ± 0.03 | 0.26 ± 0.03 | 2.75 ± 0.03 | 1.25 ± 0.02 |
- The average temperature change over a 30 s period in the plateau region and the Standard deviation during this period are shown.
In subject 1, the temperature change during CM excitation was 4.14℃ in vivo and 6.02℃ post-mortem. When the NM was implemented, a total temperature change of 0.38℃ in vivo and 0.47℃ post-mortem was observed. In the remaining 3 subjects, the temperature change in the CM ranged from 0.08℃ to 0.39℃ in vivo and 2.14℃ to 3.21℃ post-mortem. In the NM, the temperature change ranged from 0.07℃ to 0.26℃ in vivo and 0.04℃ to 1.25℃ post-mortem. In the case when an insulated tip guidewire was used, a very small temperature elevation was measured, 0.03 ± 0.02℃ in vivo and 0.06 ± 0.04℃ post-mortem, using the CM. The temperature at the tip of the guidewire was not observed to change during direct excitation.
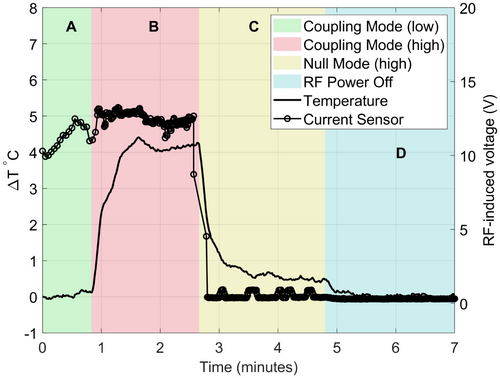
In Figure 6, the instantaneous current on the guidewire at the current-sensor location is plotted along with the temperature at the guidewire tip. The time course is divided into 4 periods in which different mode settings, and RF power levels were used. Periods A and B both used CM but with low average power (visualization) and high average power (heating test) sequences, respectively. Note that the current measurement relates to peak rather than average power; thus, it can be high even in a low average power sequence as in period A. The slight increase in measured current during period A can be attributed to an adjustment made to the amplitude of the output of the pTx system prior to beginning the heating test in period B. During period A (low average power), no temperature change was detected; whereas in period B (high average power), a temperature increase of ~4℃ was observed. During period C, the NM excitation led to negligible measured current, and the observed heating fell to ~0.5℃ while still operating at high average power. In period D the RF power was shut off and the temperature returned to baseline.
3.4 In vivo visualization
Figure 7A shows an example of CM visualization with ssTSE from subject 1 in sagittal view. Although the guidewire is visible, the SNR is low and the signal fades toward the guidewire tip, with bright regions coming from the proximity to anterior and posterior coil arrays. In the other 3 subjects that used either the 164 cm- or 260 cm-length guidewires, the achieved contrast was even less to the point that the wires were not visible. For this reason, the direct excitation method (using the toroidal current sensor to excite the guidewire) was used as an alternate. Figure 7B shows a sagittal image acquired with bSSFP in subject 4. The guidewire is visualized with signal present from surrounding anatomy. In Figure 7C, a 4-chamber view of the heart is shown, acquired with the bSSFP using B1-shimmed NM excitation. The same view is shown in Figure 7D, also acquired with bSSFP but with direct excitation of the guidewire, using approximately 12W average RF power. In this view, the guidewire is hyperintense in the location of the right ventricle, whereas it is hypointense on Figure 7C.
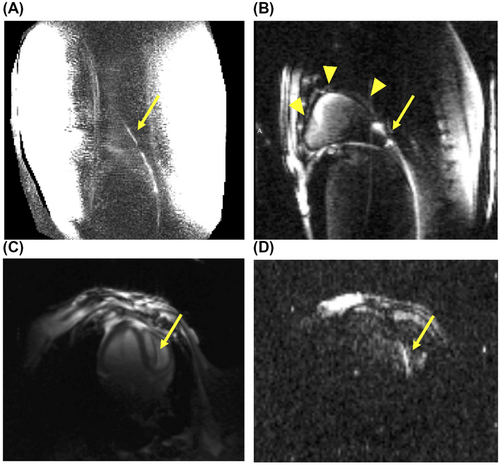
To better understand the limitation in the CM visualization, we pulled the guidewire out in 10 cm intervals twice and took a ssTSE image at each interval position using the CM in subject 4 (see Supporting Information Video S1). In Supporting Information Figure S3, images are shown for 3 different insertions lengths. It is evident that reducing the insertion length leads to clearer visualization using this method.
Figure 8 shows an example of measured coupling C (Figure 8A,B) for 2 positions acquired about 15 s apart as the guidewire was retracted by approximately 5 cm within the heart of 1 subject while acquiring NM anatomical images. It can be seen that the measured induced current in the NM remains low (Figure 8D) in both cases, despite the distribution of coupling across the channels and the total strength of coupling (Figure 8C) changing significantly in this time.
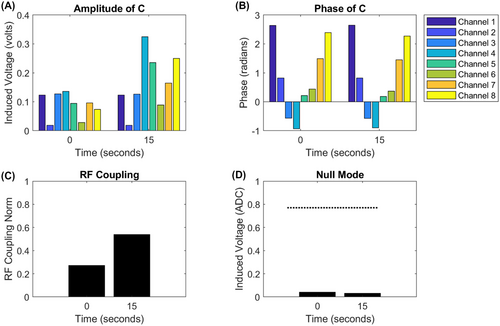
 ) changes substantially. (D) The measured current when applying a null mode excitation at these 2 positions remained low. The dashed line is the value when the coupling mode is selected
4 DISCUSSION
This work demonstrated in vivo interventional MRI using a dynamically controlled auxiliary pTx system attached to a conventional MRI scanner with current sensor measurements as active feedback. Structural MRI using standard sequences was shown to be possible with a standard nitinol guidewire in place with < 1℃ heating observed even when insulation was stripped from the guidewire tip to create worst-case conditions. Visualization of the guidewire itself using pTx coupling modes was easily achieved in phantom experiments (Figure 3B), where the overall extent of the guidewire shaft was nicely visualized in the FOV in accordance with previous reports from ourselves26 and others,13 yet they proved to be more challenging in vivo (Figure 7). However, in separate testing using direct low power excitation via the sensor coil and the cardiac array as a receiver, much more effective guidewire visualization was achieved in vivo, which suggests a potentially useful approach worthy of further investigation. Visualization and heating in phantom tests were generally more extreme than that seen in vivo.
Structural images in vivo were generally artefact-free, but some image nonuniformity was observed, with brightness decreasing quickly away from the surface of the body (Figures 4 and 7C). This is to be expected because the surface transmit–receive coil produces a less uniform field than a body transmitter, and receiver sensitivities of the array were not compensated in reconstruction. We also noted that the shape of the sheep’s torso being rather peaked on the anterior side led to nonuniform loading of the coil, exacerbating this effect; measured  fields (Figure 5) were variable in their overall uniformity. We expect this would be reduced in a human torso with some optimization.40 Further development might improve imaging performance by including additional receive-only elements to improve signal reception. The coil array design focus in this work was on RF coupling control.
CM excitation in phantom experiments was observed to create large temperature increases, which were effectively nulled when operating in NM, as expected. In subjects 3 and 4, small temperature differences between the CM and NM were seen in vivo, but no unsafe conditions (heating > 1°) were observed even for high-power scans. Heating tests in vivo showed systematically lower temperature increases than phantom tests; significant increases were only detected for stripped wires post-mortem in 3 out of 4 cases. The explanation for this latter result is that the cooling effect of blood flow masked any temperature change in vivo, as also reported by Campbell-Washburn et al.6 Small temperature increases (0.5℃-1.25℃ after 6 min) were seen when using NM excitation; this was also seen in phantom tests. This effect likely occurs because the current sensor was located outside the phantom/animal and hence may not fully characterize the currents present at the guidewire tip. Similar results were reported in phantoms,20 where performance was improved by adding a second current measurement inside the phantom using a B1-map–based approach. Use of MRI to obtain the second current measurement has the disadvantage of requiring an interruption to continued imaging, which motivates the use of external sensors as in this work. In a preliminary study, we have investigated alternative current sensor placement strategies41 and found that a single external current-sensor could reduce the heating effect for all scenarios. In subject 1, the temperature change with the CM was the largest. We believe this was because a shorter guidewire was used, which might be closer to the resonant length.2
Another key observation from our study was that unmodified (i.e., “insulated tip”) wires did not generate any observed unsafe conditions. The presence of an insulating polyurethane layer would be expected to reduce heating at the tip; similar results were reported in Ref. [6]. However, that study did still show heating effects for “insulated” wires at “normal” SAR levels, whereas our experiments did not. Potential temperature increases could have been masked by blood flow, although another explanation may be the use of a small local transmit array in this work compared with a body birdcage coil in Ref. [6]; preliminary evidence from a separate study at 3 Tesla also supports this hypothesis.42 The insertion length can also influence heating because it causes resonant length to change, as shown by Yeung et al.22
Temperature measurements were made only at the guidewire tip because this is the location where the most heating is expected.2, 21 This is particularly true for our configuration because the local RF transmit coil has a small footprint and is far from the entry point of the guidewire into the body. Additionally, we evaluated the potential for heating in prior simulation studies and found that the dominant location for any heating effects was always the wire tip.41 Nevertheless, future evaluation prior to human use could aim to verify the lack of heating at other points such as the entry point.
Visualization of the guidewire by CM excitation produced variable results across animal subjects, although it was found to work robustly in phantoms.26 The guidewire was only weakly visualized in the first subject, which had a shorter and stripped-end guidewire; in the remainder of subjects, it was consistently not seen at all. The large difference between phantoms and in vivo could indicate systematic differences between the strength of the RF-induced currents. The mechanism for such differences is unknown but might be a consequence of the blood’s high conductivity, which may be behaving as a coaxial shield around the guidewire. In subjects 3 and 4, the direct excitation method provided consistent visualization of the guidewire. This method has been demonstrated previously,13 although in that case the toroid was also used for MR signal detection. The images obtained (Figure 7B) show strong signal from the guidewire but also a significant degree of background signal, which was suspected to be due to coupling between guidewire and transmit coils because the latter were not detuned; interaction between these fields may also explain the transition from hyper- to hypo-enhancement of the wire when moving toward the tip (Figure 7B). A future improvement would be to add detuning circuitry, which we hypothesize would largely resolve this issue. Additionally, we have so far only tested direct excitation with wires with stripped tips; performance with fully insulated wires is a subject for further investigation.
In subject 4, we assessed the efficacy of CM visualization as the guidewire was pulled out of the body and found it became better visualized as the internal length was shortened (Supporting Information Figure S3). This implies that the inserted length influences the RF-induced currents on the guidewire and may also explain the differences in performance between the (larger) animal model and (smaller) phantom. This result also provides evidence that the coupling conditions will change during an intervention, supporting the need for active control as used in our device. Further, Figure 8 indicates that a relatively small change of position of a guidewire could lead to a change in relative coupling to different coil elements.
Although temperature changes were validated with guidewires in fixed positions, active control using this system was previously tested and is described in Ref. [43].
4.1 Limitations and challenges for future human use
Although X-ray guidance was used to enable accurate positioning, the methods presented offer the potential to remove the need for X-rays if wires can be visualized robustly. As demonstrated, direct excitation of the guidewire is a viable visualization technique.
A key limitation for safe use in humans is that the pTx system does not actively monitor SAR, and the fact that the scanner’s RF output is independently amplified by our system means that the scanner’s own SAR modelling is unable to track the true SAR. This was acceptable for the purpose so far; however, to be suitable for use on humans, monitoring of all RF power amplifiers (amplitude and phase)44 is needed.
In addition, before human use is possible the current sensors would need to be redesigned to either be sterilizable or disposable. A degree of further miniaturization would also be desirable to allow for multiple sensor readings to be taken simultaneously, potentially improving current nulling performance. The device has so far been tested using a single sensor with a single inserted guidewire. More complex interventions using multiple conductive guidewires or braided catheters may also need to be examined to allow more complex future use.
Finally, the system was controlled by a standard PC running MatLab (R2015A, MathWorks), which was sufficient for these experiments, although the lack of a real-time operating system was a limitation that was overcome in our experiments by adding dead-time to allow for variable time delays.
5 CONCLUSION
We have demonstrated in vivo imaging of a standard guidewire using a dynamically controlled auxiliary pTx system combined with a conventional scanner. The system could provide safe anatomical imaging using standard protocols with adaptive RF-induced current control. We also demonstrated a fast-constrained RF shimming method with adaptive adjustment as the NM change. Overall, the study provides evidence that it is feasible to deploy a pTx system added on to otherwise unmodified MRI systems for procedures with standard guidewires, and that active control can achieve and sustain null modes of operation that control guidewire currents while still allowing MR images to be obtained.
ACKNOWLEDGMENT
Funding for this project is provided by the Medical Research Council (MRC) developmental pathway funding (MR/N027949), the Wellcome/Engineering and Physical Sciences Research Council (EPSRC) Centre for Medical Engineering (WT 203148/Z/16/Z), and the British Heart Foundation (FS/20/26/34952). For the purpose of Open Access, the author has applied a CC BY public copyright licence to any author-accepted manuscript version arising from this submission.
CONFLICT OF INTEREST
The authors Raphael Tomi-Tricot and Merylene Delcey are employees of Siemens Healthcare.


