Interleaved water and fat MR thermometry for monitoring high intensity focused ultrasound ablation of bone lesions
Abstract
Purpose
To demonstrate that interleaved MR thermometry can monitor temperature in water and fat with adequate temporal resolution. This is relevant for high intensity focused uUltrasounds (HIFU) treatment of bone lesions, which are often found near aqueous tissues, as muscle, or embedded in adipose tissues, as subcutaneous fat and bone marrow.
Methods
Proton resonance frequency shift (PRFS)-based thermometry scans and T1-based 2D variable flip angle (2D-VFA) thermometry scans were acquired alternatingly over time. Temperature in water was monitored using PRFS thermometry, and in fat by 2D-VFA thermometry with slice profile effect correction. The feasibility of interleaved water/fat temperature monitoring was studied ex vivo in porcine bone during MR-HIFU sonication. Precision and stability of measurements in vivo were evaluated in a healthy volunteer under non-heating conditions.
Results
The method allowed observing temperature change over time in muscle and fat, including bone marrow, during MR-HIFU sonication, with a temporal resolution of 6.1 s. In vivo, the apparent temperature change was stable on the time scale of the experiment: In 7 min the systematic drift was <0.042°C/min in muscle (PRFS after drift correction) and <0.096°C/min in bone marrow (2D-VFA). The SD of the temperature change averaged over time was 0.98°C (PRFS) and 2.7°C (2D-VFA).
Conclusions
Interleaved MR thermometry allows temperature measurements in water and fat with a temporal resolution high enough for monitoring HIFU ablation. Specifically, combined fat and water thermometry provides uninterrupted information on temperature changes in tissue close to the bone cortex.
1 INTRODUCTION
MRI-guided high intensity focused ultrasound (MR-HIFU) allows non-invasive treatments of various conditions1 by thermal ablation, and its effectiveness for treatment of patients with painful bone metastases has been clinically demonstrated.2 Pain reduction in these patients is achieved by ablation of the periosteum in the proximity of the metastases. MRI is a reliable guidance technique for HIFU, due to its excellent soft-tissue contrast and its capacity to map tissue temperature changes.3 Temperature mapping is used to ensure that sufficient energy is delivered to reach an adequate thermal dose in the target zone, while preventing damage to surrounding healthy tissues.
In clinical procedures, proton resonance frequency shift (PRFS)-based thermometry has become the most used MR thermometry (MRT) technique for aqueous tissues.5-7 Key factors are that the proton resonance frequency of hydrogen nuclei in water molecules varies linearly with temperature,4 and is almost independent of tissue type. Moreover, PRFS thermometry has an easy implementation with rapid gradient echo (GRE) sequences.8
For the treatment of bone lesions, existing clinical protocols also rely on PRFS thermometry. Therefore, during treatments, temperature information is only available in voxels containing aqueous tissues, like muscle or tumor tissue.7 Pure adipose tissues, as subcutaneous fat, and mixed adipose tissues, as bone marrow, are often found in and around bones. Thus, frequently, a mixture of fat- and water-based tissues is present in the target area. Moreover, the energy deposition within the ultrasound beam path can cause unwanted injuries in the area closest to the transducer.9 Therefore, the heating should be monitored also in the subcutaneous fat.10, 11 For these reasons, temperature monitoring in both water and fat is desired for treatment of bone lesions.
The low water content and the absence of hydrogen bonding between fat molecules compromise the performance of PRFS thermometry in adipose tissues.7 Alternative methods have been proposed to monitor temperature in fat, most of which have focused on T1,12, 13 of which the temperature coefficient (in ms/°C) has been shown to be similar for the most prominent fat peak in different adipose tissues.14
To monitor temperature in an environment with both water and fat, Hey et al proposed a simultaneous PRFS/T1 measurement technique using the variable flip angle (VFA) method. Aiming for real-time thermometry, they implemented the method using 2D GRE-echo planar imaging (EPI) sequences.15 However, in 2D, the nonuniform flip angle (FA) profile in the slice direction causes errors in T1 estimates and compromises the accuracy of T1 mapping in fat.16, 17
In more recent methods for simultaneous PRFS/2D-VFA thermometry,18 a rescaling factor was applied to the FAs, to correct both for slice profile effects and for B1 inhomogeneity. The rescaling factor was estimated experimentally for given T1 values and was assumed to apply for all FAs between 5° and 90°. However, in these methods, PRFS thermometry was performed with short echo time (TE),15, 18 which limits the precision in PRFS temperature maps. Simultaneous measurements of PRFS and T1 need to balance the precision of both measurements, leading to compromises for the echo time and the FA choice.
Here, we propose a 2D water-fat MR thermometry method based on an interleaved framework,19 in which two sequences are independently optimized for the two tissue types: temperature in aqueous tissues is monitored using a PRFS sequence and in fat using 2D-VFA scans. The 2D-VFA settings are chosen to deliver accurate and precise T1 estimates over a range of T1, and T1 maps are corrected for slice profile effects based on simulation that include the full slice profile.20 The potential of this technique to provide temperature information in all soft tissues for monitoring MR-HIFU ablation of bone lesions was tested in ex vivo experiments. The stability of the method was investigated under in vivo conditions.
2 METHODS
All experiments were performed with a clinical 1.5T MR scanner (Philips Achieva, Best, The Netherlands). Image processing was done offline using MatLab 2018a (Mathworks, Natick, MA).
2.1 Identification of water and fat voxels
Prior to temperature mapping, it is crucial to identify water and fat voxels, to select which of the two temperature readouts will be applied. A three-point Dixon image was acquired to provide water and fat images.21, 22 Voxelwise, fat signal fraction maps were estimated using  , where
  are the signal intensities in the reconstructed in-phase and fat image, respectively. An empirically chosen threshold,
  was then used to select the voxels in adipose tissues, that is, subcutaneous fat and bone marrow, as identified on anatomical images.
2.2 Calculation of temperature maps
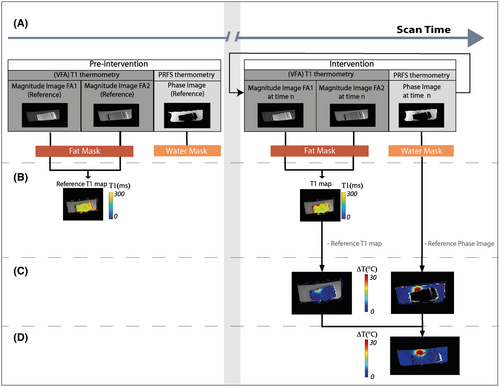
A framework allowing fast switching between pulse sequences19 was used to interleave acquisition of one PRFS scan with one 2D-VFA T1 scan, which consists of two T1-weighted (T1w) images at different FAs (Figure 1). For temperature monitoring, we acquired a set of five reference PRFS phase maps and five reference VFA T1 maps before heating and continued acquiring interleaved PRFS and 2D-VFA images during the heating and cool-down phases (Figure 1A).
2.2.1 VFA-based fat MR thermometry
 (1)
(1) , M0 is the equilibrium magnetization, and θ is the FA. After acquiring the signal at two FAs, T1 was estimated from Equation (2) by determining the slope of S/sin θ vs S/tan θ.23
Since the method was applied in 2D, a correction for the slice profile effect was applied.24, 25 We corrected the VFA T1 maps by means of a T1 look-up table (LUT), obtained by Bloch simulations including slice profile effects. Briefly, for an input T1 value and two FAs, the steady state signals were calculated and used to find the apparent longitudinal relaxation time using the conventional VFA T1 estimation. The apparent T1 includes the effects of the non-uniform slice excitation. Finally, by repeating the simulation for a range of T1 values, and FAs, an LUT was created from which a slice-profile corrected T1 can be retrieved based on the apparent T1. In this procedure, B1 inhomogeneity is compensated for by scaling the FAs. A T1 LUT with scan parameters as applied in the experiment was generated once prior to the MRT experiment.
 (2)
(2)2.2.2 PRFS-based water MRT
 (3)
(3)2.3 Ex vivo MR-HIFU heating experiment
Interleaved MRT was tested in an ex vivo experiment using HIFU heating. Experiments were performed on a clinical HIFU platform (Sonalleve MR-HIFU V2; Profound Medical, Mississauga, Ontario, Canada). Images were acquired using the integrated two-element coil inside the tabletop of the HIFU system and a 16-element flat array coil.
The phantom consisted of a water tank, in which an excised lower hind leg of a pig was immersed (Figure 2) in degassed water. The intrinsic focus of the ultrasound transducer is an ellipsoid with dimensions of 2 × 2 × 7 mm3, defined by the −3 dB level, where the longest dimension is along the ultrasound beam direction. MR thermometry was performed during 7 min. The heating experiment consisted of 50 s before heating, 60 s of HIFU sonication at 1.2 MHz with a constant acoustic power of 40 W and a cool-down period of 350 s.
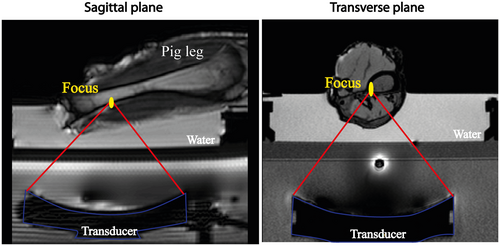
A transverse temperature mapping slice was positioned through the focus. For PRFS-MRT, sequence parameter settings included binomial water selective excitation, TE = 19 ms, TR = 37 ms, FA = 20°, EPI factor = 11, phase encoding bandwidth 40 Hz/pixel. For VFA-MRT, TE = 4.6 ms, TR = 10 ms, FA = 6°-40°, readout bandwidth 136 Hz/pixel. For both sequences, 200 × 200 mm2 FOV was used, with an acquired voxel size of 2 × 2 × 7 mm3; number of dummy excitations for dynamics = 150, RF spoiling phase increment = 117°. Temperature maps were generated 6.1 s apart, that is, the duration of a cycle of two 2D-VFA scans and one PRFS scan. In-plane B1 inhomogeneities were corrected using B1 maps, acquired using the actual FA imaging method26: TR1 30 ms, TR2 150 ms, TE 4.40 ms, FA 60°.
2.4 Non-heating demonstration on a volunteer
An in vivo demonstration was performed in one healthy volunteer without heating, with the approval of the institutional review board of the University Medical Center Utrecht (NL53099.041.15), and written informed consent was obtained from the volunteer. A transverse MRT slice was positioned in the lower leg of the volunteer. The same sequences and parameter settings as in the phantom experiment were used. A 16-element receive coil was used for signal reception.
Water and fat regions were set using three-point Dixon images,21, 22 as before. Using the method described above, 2D-VFA-based temperature maps were calculated in fat. To assess precision, a map of the temporal ΔTfat SD was generated.
Finally, the capability of the proposed method to spatially resolve temperature changes (ie, as a temperature mapping technique) was evaluated. To this end, we first applied a rotationally symmetric Gaussian filter30 with SD of one pixel for spatial low-pass filtering of the calculated temperature change maps. The range and the drift of the apparent temperature variations were characterized with their 10th (P10) and 90th (P90) percentile values and the slope of the linear regression of the estimates over the 7 min scan duration. P10, P90, and the slope of the linear fit were evaluated in 3 voxels each, in the muscle and the bone marrow.
3 RESULTS
3.1 Ex vivo MR-HIFU heating experiment
Using 2D-VFA-MRT, it was possible to detect the temperature changes in fat caused by HIFU heating. The temperature evolution was followed in three locations (Figure 3A): two voxels in the bone marrow at different distances from the focal point and one voxel in an adipose tissue layer near the focal point (Figure 3B). A temperature rise of 20°C was seen in the bone marrow behind the cortex. The three curves show that the voxel closest to the focal point has the largest temperature change, whereas in the other locations, a lower temperature change is detected.

Close to the focal point, two voxels in muscle and bone marrow show a temperature peak ~120 s after the beginning of the experiment (Figure 3C). In the cool-down phase, the behavior of these voxels differs substantially: the temperature in fat decreases rapidly and returns to baseline, whereas the muscle maintains an elevated temperature after the sonication ended.
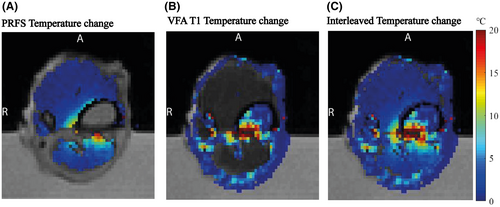
The combined water-fat temperature change map at 120 s, Figure 4C, shows a heated region that is continuous across the water-fat boundaries. A temperature rise of over 20°C was detected in the focal point area. Between 6 mm and 10 mm from the focal point, the detected temperature increase was still over 10°C. These observations are consistent with heat transfer from a region of intense heating at the bone cortex, which served as a heat source for surrounding tissues. However, in the cortical bone no temperature information was available, owing to a lack of MR signal.
Videos showing the whole MR-HIFU experiment are provided as Supporting Information Video S1, which is available online).
3.2 Non-heating demonstration on a volunteer
The temporal SD map of ΔTfat in fat voxels of a volunteer leg shows that σ(ΔTfat) < 1°C in the subcutaneous fat and 2-3°C in the bone marrow (Figure 5A). We observed that σ(ΔTfat) is high where SNR is low, probably due to differences in coil sensitivity. Moreover, σ(ΔTfat) increased up to 8°C at the fat-muscle interfaces, probably caused by partial volume effects.
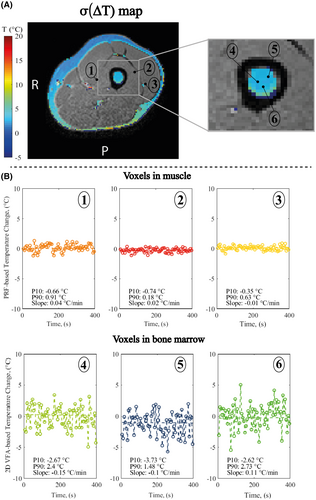
Since the method is envisioned to be used as a mapping technique, the stability of temperature changes was estimated for individual locations (Figure 5B). For all the estimates, the temperature drift was below 0.5°C/min. The spread of the apparent temperature variations at the individual timepoints was further characterized by P10 and P90. For 2D-VFA-MRT, P10 was found between −2.5°C and −3.7°C, P90 between 1.5°C and 2.7°C. For PRFS-MRT, P10 was found between −0.74°C and −0.35°C, P90 between 0.18°C and 0.91°C.
4 DISCUSSION
In this study, we have demonstrated the use of an interleaved scanning approach that enables monitoring temperature changes both in aqueous tissues (with PRFS-MRT) and in adipose tissues (with 2D-VFA-MRT). This method could aid monitoring HIFU treatments of bone metastases, for which both adipose and aqueous tissues can be found in the vicinity of the target. The feasibility of this approach was investigated in an MR-HIFU sonication experiment on an ex vivo porcine bone phantom. The method was shown to provide temperature measurements in nearly all tissues in the slice, both fatty tissues, and in any voxels containing sufficient water signal. Finally, the method was shown to be precise and stable enough for being used as a mapping technique in an in vivo experiment, with a temperature SD below 3°C in the bone marrow and negligible systemic temperature drift identified over the scan duration.
With interleaved MRT, it becomes possible to monitor complex heating behavior. In our experiment, this approach allowed to detect temperature change caused by transfer of heat generated by the intersection of the ultrasound beam with the cortex27 into the tissues surrounding the focal area.
MRT is generally used to measure temperature change rather than absolute temperature. Therefore, for the utility of the method, precision and stability over time change here are key parameters. Based on the precision measurements in bone marrow in vivo, we expect that temperature rises of the order of 3°C can be detected. Moreover, the temperature estimates in our experiments were computed continuously for 7 min, which resembles the time window of the HIFU sonication protocol (pre-scanning, sonication,28 cool-down10) in clinical care. During this time, the 90th percentile of apparent temperature change observed in the single voxels in bone marrow was 1.5-2.7°C, which was likely caused by noise in the 2D-VFA source images. For HIFU ablation, the aim is to achieve temperatures above 60°C in the target area (ie, temperature changes of more than 23°).29 Therefore, with the precision and the stability observed in our experiment, we expect that this method could improve the monitoring of temperature changes caused by HIFU ablation in the anatomy imaged.
Adding fat temperature information is relevant for treatment of bone metastases and tumors, where both the target and the surrounding area can contain adipose tissues.30 Temperature mapping in water and fat may improve monitoring of heating also during other clinical applications of HIFU in target areas containing aqueous and adipose tissues, such as breast13 and pancreas.31
While this study has demonstrated the temperature monitoring ability of the proposed technique, there are several limitations that must be addressed before this sequence may be offered for clinical use.
First, the image processing and temperature estimations were performed offline; therefore, the potential of interleaved MRT to perform real-time treatment monitoring has not been tested yet. To apply interleaved MRT, water and fat masks were used. However, in case of motion during the scan session, a mismatch of fat and water voxels can occur between the mask (created prior to MRT) and the images from MRT scans. For our use case, that is, MRT for HIFU therapy of bones, this is less problematic as patients are usually sedated but for other applications this mismatch could be mitigated by registration techniques or dynamic updates of the mask image, for example, using a multi-echo MRT pulse sequence, as was used by Poorman et al.32
The selection of the water and fat regions is key in view of the poor results of T1 thermometry in voxels with mixed water and fat contributions. Here, a visualization approach based on masks was adopted to avoid partial volume effects. However, the problem could also be solved in acquisition, with fat/water suppression and water–fat separation methods.33
Moreover, fat thermometry relies on the VFA approach, which is known to be susceptible to B1 inhomogeneties.34 In this work, we acquired a B1 map to correct for B1 inhomogeneities. However, in case of more homogeneous B1 fields, B1 corrections might be omitted to save time.
Finally, the 6 s overall acquisition time of the technique described here imposes a minimum duration on the heating time, to enable temperature monitoring. In particular the time required to reach the steady state adds to the scan time for the VFA method. This issue has been addressed by Svedin et al,35 who proposed to only acquire dynamic images at one FA during the MRT experiment, thus improving the VFA temporal resolution.
5 CONCLUSIONS
In conclusion, interleaved PRFS and 2D-VFA T1 thermometry enables temperature monitoring in fat and water for MR-HIFU treatments, showing the heat distribution inside and outside the bone across tissues of different composition. As such, the method holds potential for monitoring MR-HIFU in patients with bone lesions, thus contributing to the safety of treatments.
ACKNOWLEDGMENTS
This research is supported by the Dutch Technology Foundation STW (now NWO Domain Applied and Engineering Sciences), the Dutch Cancer Society and PPP allowance of Top Sector Life Sciences & Health. The authors thank the volunteer, Dr. Alex Rem for help with the laser experiments, and Gerrit Takke for providing the pig leg phantoms.


