Reproducibility of 2D GluCEST in healthy human volunteers at 7 T
Funding information: National Institute of Biomedical Imaging and Bioengineering of the National Institute of Health (P41-EB015893) and the National Institute of Neurological Disorders and Stroke (R01NS087516, 1R01DA037289-02, and 1R01CA201295)
Abstract
Purpose
To investigate the reproducibility of gray and white matter glutamate contrast of a brain slice among a small group of healthy volunteers by using the 2D single-slice glutamate CEST (GluCEST) imaging technique.
Methods
Six healthy volunteers were scanned multiple times for within-day and between-day reproducibility. One more volunteer was scanned for within-day reproducibility at 7T MRI. Glutamate CEST contrast measurements were calculated for within subjects and among the subjects and the coefficient of variations are reported.
Results
The GluCEST measurements were highly reproducible in the gray and white matter area of the brain slice, whether it was within-day or between-day with a coefficient of variation of less than 5%.
Conclusion
This preliminary study in a small group of healthy volunteers shows a high degree of reproducibility of GluCEST MRI in brain and holds promise for implementation in studying age-dependent changes in the brain.
1 INTRODUCTION
Glutamate is a major excitatory neurotransmitter and is involved in many aspects of brain function.1-3 In addition, alterations of the glutamatergic system may contribute to the underlying pathophysiology of many neurological and neuropsychiatric disorders.4, 5 For example, elevated glutamate likely contributes to “excitotoxic” neuronal cell loss in Alzheimer's disease through overstimulation of glutamatergic receptors.6-9 Decreased glutamate is observed in animal model of Alzheimer's disease and in patients with advanced pathology,10-13 particularly within the hippocampus, and is positively correlated with the progressive loss of glutamate transporter proteins in brain regions associated with memory and cognitive function.14, 15
Although altered glutamate levels are implicated in the pathogenesis of neurological and neuropsychiatric diseases, glutamate has also been shown to decrease with age in the neurotypical brain.16-18 To distinguish glutamate changes that may occur as a normal part of the aging from those associated with disease, it is vital to have a sensitive in vivo marker for brain glutamate. The ability to accurately monitor changes in glutamate will potentially provide better diagnostics and aid in the development of early therapeutic intervention.
Most published studies for measuring age-related changes in glutamate in vivo have used single-voxel proton MRS (1H MRS) at field strengths of 4 T or less.16-19 However, the utility of 1H MRS for accurately measuring glutamate is limited due to the severe overlap of glutamine resonances with glutamate along with contributions from macromolecules at field strengths of 4 T or less.19, 20 Recently there were 2 additional 1H MRS studies done at 7 T, in which the coefficient of variations for glutamate were reported to be 4 to 13%, whereas for glutamine it was between 10 and 33%.21, 22 With a recently developed imaging technique glutamate can be measured with higher sensitivity and at higher resolution by exploiting its CEST properties (glutamate-weighted CEST, or GluCEST) at 7 T.23-25 Approximately 70 to 75% of GluCEST value has been shown based on theoretical as well as experimental studies is due to glutamate.23, 26 An advantage of this imaging method is that the glutamate measurements are devoid of any glutamine contamination. The GluCEST technique has been implemented in studies of mouse models of Alzheimer's disease, which demonstrated the sensitivity of the method to detect decreased concentrations of glutamate in diseased mice compared with healthy, age-matched controls.10, 27, 28 In the mouse model of Parkinson's disease, increased GluCEST was measured from the striatum compared with the healthy controls.26, 29 This method was also used in studying the Huntington's disease mouse model in which the decreased GluCEST was measured in the striatal region of the brain.30 This technique has also been demonstrated in a proof-of-principle study in human brain23 and was recently used in small studies to show differences in brain glutamate levels between patients compared with healthy controls.25, 31
The GluCEST tool is promising for assessing brain glutamate. However, before GluCEST can be implemented in larger clinical studies, the reproducibility of the measurement in healthy subjects must be established. This is a particularly important consideration, as neurotypical brains may also experience age-dependent changes in glutamate, which vary by sex and reproductive status of the individual.16-18 The goal of the current work is to demonstrate reproducibility of GluCEST measurements in the brains of healthy volunteers. Here we use single-slice 2D GluCEST imaging to measure the reproducibility of glutamate in healthy human subjects at 7 T. For this initial reproducibility study of GluCEST in human brain, we performed multiple scans on 6 healthy volunteers over a maximum period of 8 months. We show that GluCEST MRI provides highly reproducible measurements in the human brain, both within individual subjects and across a small group of healthy adults.
Future work will focus on showing age-dependent changes and possible effects of sex and reproductive status on GluCEST in healthy subjects. Ultimately, this work will provide a foundation for future clinical studies seeking to show glutamate alterations in patient populations.
2 METHODS
All human studies were conducted under an approved University of Pennsylvania Institutional Review Board protocol. Written, informed consent was obtained from each volunteer. Seven healthy volunteers (6 males, 1 female) aged 28 to 66 years old (45 ± 14.54 years) participated in the study. Imaging was performed on a 7T Siemens scanner (Erlangen, Germany) with a Siemens volume coil transmit/32-channel receive proton head phased-array coil. Four scans were acquired on each subject (n = 6). Two of these scans were acquired on the same day for assessment of within-day repeatability. The time period to complete all scans ranged from 3.5 months to 8 months (Table 1). For 3 of the subjects, 1 additional scan was acquired. A seventh subject was also included and had 2 scans acquired on the same day. This subject is included only in the within-day results.
| Subject | Age (years),gender | GMGluCEST ± SD(% asymmetry)a | GMGluCESTmean | GMGluCESTSD | GMGluCESTCOV (%) | WMGluCEST ± SD(% asymmetry)a | WMGluCESTmean | WMGluCESTSD | WMGluCESTCOV (%) | ||
|---|---|---|---|---|---|---|---|---|---|---|---|
| 1 | 26, M | Day 1 | 7.87 ± 1.36 | 7.92 | 0.26 | 3.27 | Day 1 | 4.83 ± 1.91 | 4.59 | 0.17 | 3.74 |
| Week 3 | 8.3 ± 1.17 | Week 3 | 4.55 ± 1.75 | ||||||||
| Month 6b | 7.72 ± 1.34 | Month 6 | 4.42 ± 1.76 | ||||||||
| Month 6b | 7.8 ± 1.36 | Month 6 | 4.57 ± 1.89 | ||||||||
| 2 | 32, M | Day 1 | 7.7 ± 1.26 | 7.73 | 0.24 | 3.13 | Day 1 | 4.41 ± 1.76 | 4.39 | 0.11 | 2.6 |
| Week 2 | 8.04 ± 1.32 | Week 2 | 4.54 ± 1.82 | ||||||||
| Month 3.5b | 7.45 ± 1.32 | Month 3.5 | 4.3 ± 1.65 | ||||||||
| Month 3.5b | 7.72 ± 1.42 | Month 3.5 | 4.3 ± 1.79 | ||||||||
| 3 | 37, M | Day 1 | 7.54 ± 1.68 | 7.62 | 0.20 | 2.65 | Day 1 | 4.46 ± 1.8 | 4.48 | 0.14 | 3.14 |
| Month 1.5 | 7.97 ± 2.16 | Month 1.5 | 4.67 ± 2.07 | ||||||||
| Month 4b | 7.46 ± 2 | Month 4 | 4.45 ± 2.08 | ||||||||
| Month 4b | 7.53 ± 1.86 | Month 4 | 4.28 ± 1.89 | ||||||||
| Month 8 | 7.59 ± 1.8 | Month 8 | 4.52 ± 1.94 | ||||||||
| 4 | 52, F | Day 1b | 7.49 ± 1.1 | 7.56 | 0.07 | 0.91 | Day 1 | 4.37 ± 1.69 | 4.46 | 0.16 | 3.68 |
| Day 1b | 7.64 ± 1.4 | Day 1 | 4.26 ± 1.68 | ||||||||
| Month 2 | 7.48 ± 1.24 | Month 2 | 4.5 ± 1.68 | ||||||||
| Month 2 | 7.58 ± 1.19 | Month 2 | 4.48 ± 1.69 | ||||||||
| Month 6 | 7.59 ± 1.25 | Month 6 | 4.7 ± 1.78 | ||||||||
| 5 | 62, M | Day 1b | 7.81 ± 1.69 | 7.82 | 0.16 | 2.06 | Day 1 | 4.84 ± 1.6 | 4.88 | 0.12 | 2.44 |
| Day 1b | 7.65 ± 1.2 | Day 1 | 4.87 ± 1.55 | ||||||||
| Month 4.5 | 7.79 ± 1.48 | Month 4.5 | 4.77 ± 1.54 | ||||||||
| Month 5 | 8.04 ± 1.38 | Month 5 | 5.05 ± 1.62 | ||||||||
| 6 | 66, M | Day 1 | 7.46 ± 1.29 | 7.49 | 0.31 | 4.09 | Day 1 | 5.05 ± 1.57 | 5.16 | 0.14 | 2.68 |
| Month 1 | 7.16 ± 1.15 | Month 1 | 4.99 ± 1.41 | ||||||||
| Month 4 | 7.96 ± 1.26 | Month 4 | 5.33 ± 1.66 | ||||||||
| Month 6b | 7.58 ± 1.03 | Month 6 | 5.24 ± 1.53 | ||||||||
| Month 6b | 7.3 ± 1.87 | Month 6 | 5.18 ± 1.75 | ||||||||
| 7 | 37, M | Day 1b | 7.64 ± 1.07 | 7.68 | 0.06 | 0.74 | Day 1 | 4.55 ± 1.71 | 4.60 | 0.06 | 1.38 |
| Day 1b | 7.72 ± 1.45 | Day 1 | 4.64 ± 1.81 | ||||||||
- a The mean and SD values reported here were without applying any smoothing filter.
- b Within-day scans.
- COV, coefficient of variation
To accurately obtain consistent slice locations between imaging sessions, we used a coregistration program, ImScribe (accessible at https://www.med.upenn.edu/cmroi/imscribe.html). It uses high-resolution T1-weighted images and the slice information from a subject's initial scan as a target template for subsequent scans and performs affine coregistration that provides information for slice placement as illustrated in Supporting Information Figure S1.
For each subject, an axial slice located about 3 to 4 mm above the corpus callosum for adequate gray/white matter separation was selected. For every subsequent scan, ImScribe was used to identify slice coordinates to maintain consistent slice positioning. The 2D GluCEST imaging parameters were slice thickness = 5 mm, in-plane resolution = 1 × 1 mm2, matrix size = 256 × 256, gradient-echo readout TR = 7.4 ms, TE = 3.5 ms, read-out flip angle = 10 º, averages = 2, SHOT TR = 8000 ms, shots per slice = 1, and a saturation pulse of B1rms = 3.06 μT with 800-ms-long saturation pulse train consisting of a series of 99.8-ms Hanning-windowed saturation pulses with a 0.2-ms interpulse delay (100-ms pulse train). Saturation flip angle was 3772 º. The CEST images were acquired at varying saturation offset frequencies from ±1.8 to ± 4.2 ppm (relative to the water resonance set to 0 ppm) with a step size of 0.2 ppm. For gray and white matter segmentation, we have also collected the data with these same parameters at offset frequencies of ±20 ppm and ±100 ppm to generate magnetization transfer ratio map. To compute B0 maps for correction of B0 field inhomogeneity, water saturation shift referencing images32 were collected from ± 0 to ± 1 ppm (step size = 0.1 ppm) with a saturation pulse of B1rms = 0.29 μT with 200-ms duration and imaging parameters identical to those used for CEST as described previously. A relative B1 map was generated from 2 images obtained using square preparation pulses with flip angles of 30 ° and 60 °. The total acquisition time including the anatomical image, CEST images, and B0 and B1 field maps was approximately 12 minutes for each imaging session. The CEST contrast maps for the imaging slice were generated using in-house MATLAB (MathWorks, Natick, MA) routines as described by Cai et al.23 Glutamate-weighted CEST image contrast values are reported in percent asymmetry. The B0-corrected and B1-corrected GluCEST contrast maps were averaged for each subject's entire gray matter (GM) and white matter (WM) to compute the coefficient of variation (COV) for the reproducibility studies. Gray and white matter segmentation was done on the same slice with the magnetization transfer ratio map, using a K-means cluster algorithm33 with the number of segments set to 3 (gray, white, and CSF).
Gray matter and WM measures were also assessed between days and within days using linear mixed models to account for the dependency of the repeated measures. For the between-day models, GM and WM were modeled using time as a grouped discrete covariate in which days less than or equal to 50 were the first group, days 51 to less than or equal to 150 comprised the second, and the third group consisted of days greater than 150. This was done to help balance the sample as well as to prevent assuming a linear trend in the response over time, while conserving degrees of freedom. Repeated measures were adjusted for using subject-level random intercepts. For days in which there were 2 scans, only the first was included. The subject who only had 1 day with 2 scans was not included in the between-day analysis. For the within-day models, the session number (first or second) was included as a categorical covariate and repeated measures were also adjusted for using subject-level random intercepts. F-statistics were calculated using Satterthwaite approximations of degrees of freedom. All of the statistical analyses were performed on R v3.4.3 using the Ime4 and ImerTest packages.34-36
3 RESULTS
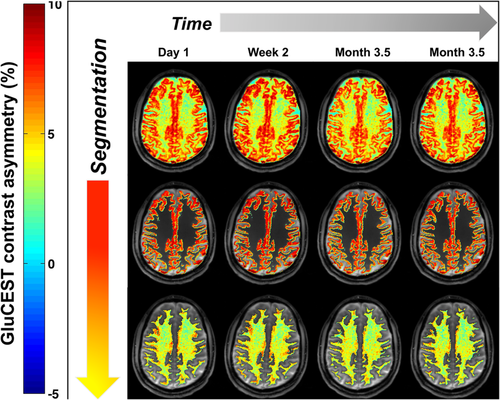
The B0-corrected and B1-corrected CEST maps for 1 of the subjects are shown in Figure 1 and for all subjects/time points are shown in Supporting Information Figure S2; the results for each subject and each scan are listed in Table 1.

Glutamate CEST (GluCEST) map of the entire slice (top) of a young healthy volunteer (32 years old) and segmentation of GluCEST map based on gray matter (center) and white matter (bottom) for within-day and between-day scans
3.1 Within-day results
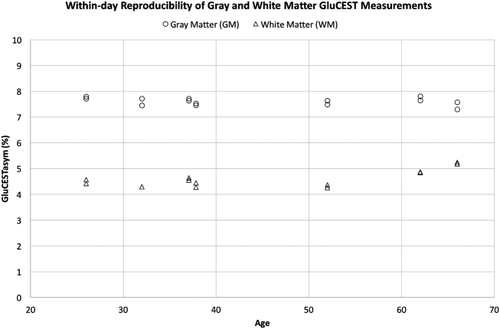
The results for same-day scans are shown in Figure 2 (n = 7). Subject 6 is included despite the presence of motion in their second scan of within-day, visible in the CEST maps (Supporting Information Figure S2). The GluCEST contrast was calculated for each slice acquired on the same day for each subject, and the GM and WM were segmented. For GM, the COV for within-day scans from the subjects was about 2% (with an individual subject range of 0.66% to 2.66%) and similar for WM (COV about 2% [0% to 2.75%]). The linear mixed models showed that there were no differences between the 2 within-day scans for both GM (F = 0.179, P = .687) and WM (F = 0.056, P = .821).

Within-day GluCEST measurements of gray matter (GM, circles) and white matter (WM, triangles) for each individual subject
3.2 Between-day results
For the between-day results, the first scan of the within-day and all of the other single scans from different days were used for calculating the COV. For GM, the COV for between-day scans from the subjects was about 4% (with an individual subject range of 0.81% to 4.39%, and similar for WM (COV of about 4% [2.24%-4.55%]). The linear mixed models showed that there were no differences between scans for both GM (F = 0.202, P = .820) and WM (F = 0.417, P = .668).
3.3 Intrasubject scan results
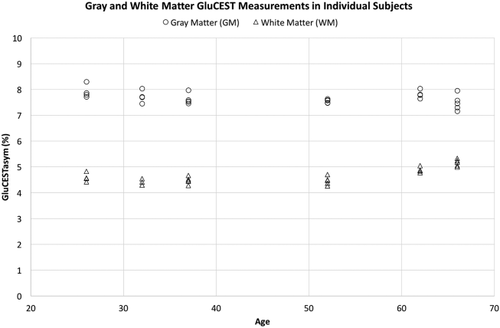
The GluCEST contrast values for each subject (n = 6) were calculated for every scan (Figure 3) (either 4 or 5 scans, see Table 1), and the values for GM and WM were averaged to calculate each individual subject's COV. For GM, the individual COV ranged from 0.91% to 4.09%. For WM, the individual COV ranged from 2.44% to 3.74%.

GluCEST measurement of GM (circles) and WM (triangles) from all scans of each individual subject
3.4 Intersubject scan results
The GluCEST group averages (n = 6) were calculated for both GM (7.69 ± 0.16) and WM (4.66 ± 0.3). The intersubject COV was determined from these averages: GM COV = 2.15%, WM COV = 6.44%. Individual GluCEST values from each subject are given in Table 1. Modeling all GM measures for these 6 subjects by both within-day scan session as well as between-day time groups, the P values for session and time are .431 (F = 0.649) and .852 (F = 0.161). For WM, the P values for the effects of session and time are .142 (F = 2.355) and .382 (F = 1.014).
4 DISCUSSION AND CONCLUSIONS
Glutamate CEST imaging has emerged as an ideal tool for use in neurological studies. This technique provides greatly enhanced spatial resolution compared with traditional spectroscopic methods, allowing for a whole-slice assessment of glutamate levels across varying regions of anatomy. To the best of our knowledge, this is the first human GluCEST study at 7 T that determines the reproducibility of the measurements. This study shows that GluCEST MRI provides highly reproducible measurements both within individual subjects and across a small group of individuals. Specifically, the COV was less than 5% in GM and WM regions of the brain for all subjects, both within and across days. Based on the small-reproducibility COV, this method is sensitive to detect any physiological changes above 5%.
The GluCEST technique has been used in studying the seizure foci in temporal lobe epileptic patients, and showed increased GluCEST contrast on the ipsilateral hippocampus compared with the contralateral hippocampus.25 In addition, the GluCEST was shown to be a potential biomarker for patients on the psychosis spectrum.31 In these studies, the GluCEST saturation pulse parameters used were slightly different than those used in the current study. Furthermore, the regions of the brain that were investigated in the prior studies were also different from those investigated in the current study. Accounting for these differences, the GluCEST results from this study are consistent with those reported in previous studies.
As previous work37 has noted, there are likely several sources that contribute to variation in our measurements. These include motion artifact and B1 correction based on segmentation. We attempted to reduce motion artifact by using an approach that comfortably immobilized the head while the individuals were being scanned. However, we cannot rule out possible effects of motion. In the future, the inclusion of advanced, fast navigator sequences (e.g., EPI) collected throughout GluCEST acquisition will enable estimation of subject motion and correction during each scan. As our B1 correction used in this study depends on the accuracy of the GM and WM segmentation, we are working on a voxel-based B1 correction strategy. We acknowledge several other limitations of the current manuscript, including a limited sample to assess age or gender effects; however, we anticipate that future studies will systematically investigate these important questions.
Here, our initial attempt at establishing reproducibility demonstrates that GluCEST MRI provides highly reproducible measurements in human brain, both within individual subjects and across a small group of healthy adults. Additional work needs to establish the reproducibility of GluCEST within and across specific regions of the brain. Nonetheless, we anticipate that this assessment of reproducibility lays the groundwork for further age-dependent and sex-differences studies of glutamate, and for detecting subtle changes in glutamate in psychiatric and neurological disorders.
ACKNOWLEDGMENT
This project was supported by the National Institute of Biomedical Imaging and Bioengineering of the National Institute of Health through grant Number P41-EB015893, and the National Institute of Neurological Disorders and Stroke through grant numbers R01NS087516, 1R01DA037289-02, and 1R01CA201295.


