31P T2s of phosphomonoesters, phosphodiesters, and inorganic phosphate in the human brain at 7T
Abstract
Purpose
To determine the phosphorus-31 T2s of phosphomonoesters, phosphodiesters, and inorganic phosphate in the healthy human brain at 7T.
Methods
A 3D chemical shift imaging multi-echo sequence with composite block pulses for refocusing was used to measure one free induction decay (FID) and seven full echoes with an echo spacing of 45 ms on the brain of nine healthy volunteers (age range 22–45 years; average age 27 ± 8 years). Spectral fitting was used to determine the change in metabolic signal amplitude with echo time.
Results
The average apparent T2s with their standard deviation were 202 ± 6 ms, 129 ± 6 ms, 86 ± 2 ms, 214 ± 10 ms, and 213 ± 11 ms for phosphoethanolamine, phosphocholine, inorganic phosphate, glycerophosphoethanolamine, and glycerophosphocholine, respectively.
Conclusion
The determined apparent T2 for phosphoethanolamine, glycerophosphocholine, and glycerophosphoethanolamine is approximately 200 ms. The lower apparent T2 value for phosphocholine is attributed to the overlap of this resonance with the 3-phosphorous resonance of 2,3-diphosphoglycerate from blood, with an apparent shorter T2. Omitting the FID signal and the first echo of phosphocholine leads to a T2 of 182 ± 7 ms, whereas a biexponential analysis leads to 203 ± 4 ms. These values are more in line with phosphoethanolamine and the phosphodiesters. The short T2 of inorganic phosphate is subscribed to the fast reversible exchange with γ-adenosine triphosphate, which is mediated by glyceraldehyde-3-phosphate dehydrogenase and phosphoglycerate kinase within the glycolytic pathway. Magn Reson Med 80:29–35, 2018. © 2017 The Authors Magnetic Resonance in Medicine published by Wiley Periodicals, Inc. on behalf of International Society for Magnetic Resonance in Medicine. This is an open access article under the terms of the Creative Commons Attribution NonCommercial License, which permits use, distribution and reproduction in any medium, provided the original work is properly cited and is not used for commercial purposes.
INTRODUCTION
In vivo phosphorous-31 (31P) MR spectroscopy provides an in situ window on cell energy and phospholipid membrane metabolism. Because these processes are crucial in the development and sustenance of a healthy brain function, 31P MR spectroscopy has been applied in the investigation of the healthy brain 1-3 and brain diseases such as schizophrenia 4, 5, bipolar disorder 6-8, Alzheimer's disease 9, 10, attention deficit hyperactivity disorder 11, Parkinson's disease 12, epilepsy 13, 14, multiple sclerosis 15, 16, and brain tumors 17-19.
Although 31P MRS on clinical 1.5T MR systems is hampered by low signal-to-noise ratio (SNR) and low spatial, temporal, and spectral resolution, the development of human high field (3T) and ultrahigh field (7T) systems alleviates these restraints. However, the increased spectral resolution at 7T impairs the chemical shift range over which homogeneous radiofrequency (RF) excitation and refocusing can be performed. Additionally, ultrahigh field MR leads to more RF deposition as compared to MR at lower field strengths.
The first in vivo 31P study of the human brain at 7T by Lei et al. 1 was published in 2003. In that study, the T1 and T2 of phosphocreatine (PCR) and adenosine triphosphate were determined. Accurate knowledge of MR relaxation parameters is essential in optimizing spectroscopy pulse sequences for repetition time and echo time (TE), and is required for absolute quantification of metabolites. In addition, relaxation properties may provide information about the molecular dynamics of metabolites and tissue susceptibilities.
Here we report on the T2s of the 31P metabolites in the chemical shift range of 2.9 to 6.9 parts per million (ppm), that is, the phosphodiesters (glycerophosphocholine (GPC) and glycerophosphoethanolamine (GPE)), inorganic phosphate (Pi), and the phosphomonoesters ((phosphocholine (PC) and phosphoethanolamine (PE)), using multi-echo acquisitions with incorporation of imperfections in flip angles. To the best of our knowledge, this is the first report on the T2s of these metabolites in the human brain at 7T.
In previous work, we determined the T2s of these metabolites in healthy breast tissue 20 and breast cancer tissue 21 at 7T. Of particular interest in these studies was a much shorter T2 for Pi in breast cancer tissue than in healthy breast tissue, which we attribute to upregulated glycolysis in breast cancer tissue, causing reversible exchange between Pi and adenosine triphosphate (ATP). Because the glyceraldehyde-3-phosphate dehydrogenase (GAPDH) mRNA expression of the human cortex is among the tissues with the highest expression 22, and the GAPDH enzyme mediates this Pi–ATP exchange 22, we hypothesized to observe a short T2 of Pi in the brain as well.
METHODS
Nine healthy volunteers who gave written informed consent were scanned on a 7T whole-body MR scanner (Philips, Best, The Netherlands) with a dual-tuned 31P-1H head coil (MR Coils BV, Zaltbommel, the Netherlands). The scan protocol consisted of basic imaging for positioning, B0 map for image-based shimming with a shim tool (MR Code BV) based on FASTERMAP 23, and a 31P flip-angle series (block pulses with step 15 degrees) in the nominal range 315 to 420 degrees to calibrate the flip angle in obtaining an actual flip of 360 degrees. After B0 shimming and 31P pulse calibration, a multi-echo 3D chemical shift imaging scan (Fig. 1) with spherical k-space sampling was performed (repetition time = 6 s; field of view = 280 × 280 × 280 mm3; matrix = 8 × 8 × 8; bandwidth = 7,000 Hz; 256 data points on a full echo; ΔTE = 45 ms; amplitude of (excitation) RF field (B1) = 40 μT), acquiring one free induction decay (FID) and seven full echoes. Proton decoupling was not used because the in vivo spectral line width at 7T is larger than the scalar coupling constants.
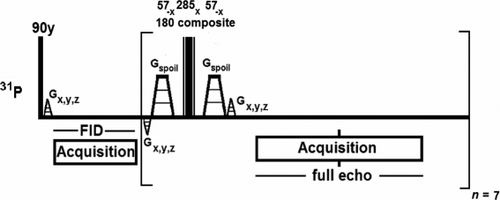
Multi-echo spectroscopic imaging sequence with composite block pulses for refocusing, used in combination with a dual-tuned phosphorus-31–hydrogen-1 (31P-1H) birdcage head coil at 7T.
 (1)
(1) (2)
(2) (3)
(3)Acquired 31P data were spatially Hanning-filtered; FID data was first-order phased by circular shifting the first missing data points resulting from the delay between pulse and acquisition. All data were zero-filled in the time domain. After Fourier transform, the spectra were zero-order phase-corrected (based on the absolute full echo signal), and a baseline correction was applied to the FID spectrum to correct for the baseline rollover artefact as a result of the first missing data points. For each volunteer, one voxel was chosen for analysis. Because the nominal voxel size is 35 × 35 × 35 mm3, the effective voxel size after Hanning filtering spans a large part of the brain. A voxel center location was central in the left–right and anteroposterior directions of the brain and a few centimetres below the skull in a feet-head direction. This corresponds to the voxel with the highest SNR for optimal T2 analysis. Spectral fitting was performed with jMRUI 5.2 24 using the AMARES algorithm 25. Line widths of PE, PC, GPE, GPC were kept identical and free; and the line width of Pi was free. All metabolites were fitted using Gaussian line shapes. Chemical shift of metabolites was fixed within a 0.3 ppm range. After spectral fitting, the calculated amplitudes of the metabolites within FID and echoes were fitted to Equation [2]. The Cramér–Rao lower bounds of the spectral fitting were used as uncertainties in the exponential fitting with Equation [2]. The fitted T2 values per metabolite and per volunteer were variance-weighted to obtain a best average T2 value per metabolite. To enable the acquisition of seven echoes, the sampling times for FID and echo acquisitions were kept relatively short, leading to a small truncation artefact in the spectra. This artefact was removed (for viewing purpose only) by replacing the truncated tail of the experimental time domain data by the tail of the fitted time domain data obtained from jMRUI 5.2.
RESULTS
In Figures 2a,2b, the results for the simulations of the multi-echo sequence with 180-degree refocusing block pulses and refocusing composite block pulse are compared, respectively. It is clear that with 180-degree block pulses at B1 = 40 μT, the first echo already shows a drop in intensity to approximately 90%, within the 4-ppm range of interest of approximately 4.7 ppm. A better refocusing performance is seen with the composite block pulse, although a small drop in intensity can be observed, particularly on the edges of the 4-ppm range of interest.
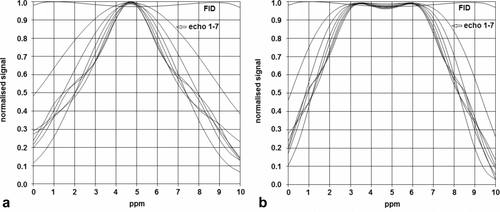
Simulated signal for the free induction decay (FID) and the subsequent seven echoes of the multi-echo spectroscopic imaging sequence shown in Figure 1. (a) Refocusing with 180 ° block pulses; (b) refocusing with composite 57°-x285°x57°-x block pulses. The transmitter offset was 4.7 parts per million (ppm), and the amplitude of (excitation) radiofrequency (RF) field (B1) = 40 μT.
Applying the multi-echo sequence with composite block refocusing pulses will lead to a small underestimation of the T2 of metabolites, which can be corrected by taking into account the pp profile of Figure 2b, for which the deviation can be fitted as an exponential decay given by Equation [1]. The results of fitting the corrective pp time constants, T2pp,m, at the different chemical shifts of the metabolites, are shown in Figure 3.

Pulse performance (pp) time constants T2,pp,m fits to Equation [1] at the metabolite chemical shifts of phosphoethanolamine (PE), phosphocholine (PC), inorganic phosphate (Pi), glycerophosphoethanolamine (GPE), and glycerophosphocholine (GPC). RF pulses were on resonance at 4.7 ppm and with a B1 = 40 μT.
The numerical values of the pp time constants T2,pp,m in seconds, which were fitted at the different chemical shifts, are summarized in the second column of Table 1. An example of the chosen voxel localization for analysis, a full FID spectrum, and the multi-echo spectra in the chemical shift range 2 to 8 ppm for one volunteer are shown in Figure 4.
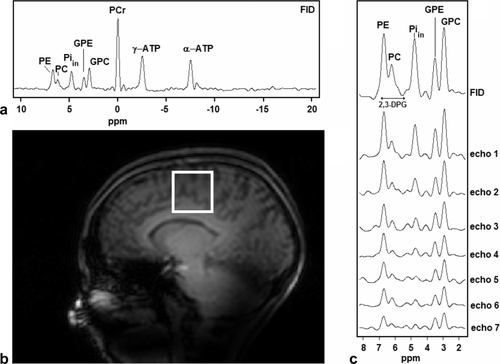
(a) Scout image with chosen voxel in the brain of a healthy volunteer. (b) Full 31P MRS spectrum derived from the 90° pulse acquired FID. Note the lack of β-adenosine triphosphate (β-ATP) signal due to limited excitation bandwidth. (c) Example of brain 31P spectra (obtained from FID and echoes) from the selected voxel of this volunteer. The possible range of the chemical shift of the 2,3-diphosphoglycerate (2,3-DPG) signals, as indicated in the figure, is 5.4 to 6.9 ppm for 7.3 ≤ pHi ≤ 7.4 and 1% ≤ oxygenation ≤ 98%, respectively.
| Metabolite | T2,pp,m/s | T2,/ms |
|---|---|---|
| Phosphoethanolamine (PE) | 2.6 | 202 ± 6 |
| Phosphocholine (PC) | 14.4 | 129 ± 6 |
| Inorganic phosphate (Pi) | 9.0 | 86 ± 2 |
| Glycerophosphoethanolamine (GPE) | 2.5 | 214 ± 10 |
| Glycerophosphocholine (GPC) | 2.3 | 213 ± 11 |
- 31P, phosphorus-31; pp, pulse performance.
Because the refocusing bandwidth of the composite pulses is limited to approximately 4 ppm, only a small chemical shift range of the 31P spectrum spanning the phosphodiesters and phosphomonoesters is shown for the multi-echo spectra. The T2 fits of the different 31P metabolites obtained from fitting the spectra at the different TEs for this volunteer are shown in Figure 5.
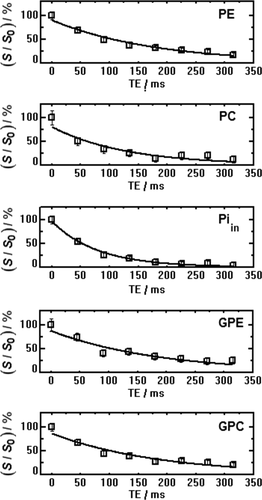
T2 Fits of the 31P metabolites in the phosphodiester to phosphomonoester range of the data from the same volunteer, as shown in Figure 4. S/S0 is relative signal intensity.
The truncation artifact that arises due to the relatively short TE (45 ms) and subsequent short sampling time (18.3 ms for the FID and 36.6 for a full echo) is illustrated in Figure 6. Figure 6a shows the spectrum of an almost fully sampled FID (55 ms sampling); Figure 6b shows the same spectrum but truncated after 18.3 ms (zero-filled to the original size); and Figure 6c shows the partial removal of the artifact (for viewing purpose) by using the tail of the FID as obtained by spectral fitting in jMRUI 5.2.
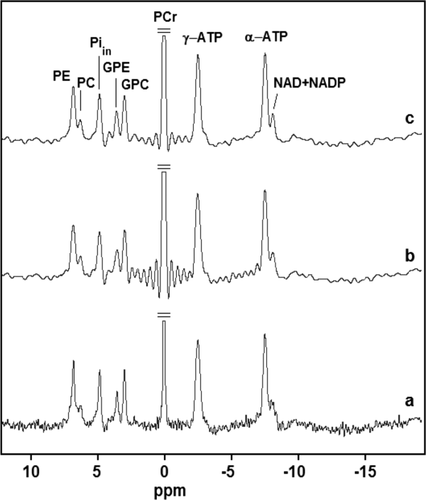
(a) Example of a spectrum of an almost fully sampled FID (Tacq = 55 ms); (b) spectrum of a truncated FID (18.3 ms); and (c) spectrum of the truncated FID after filling the truncated time domain data with fitted data from jMRUI 5.2. All FIDs were zero-filled to the same number of points. NAD, nicotinamide adenine dinucleotide; NADP, nicotinamide adenine dinucleotide phosphate.
Averaged multi-echo spectra for the group of nine volunteers are shown in Figure 7.
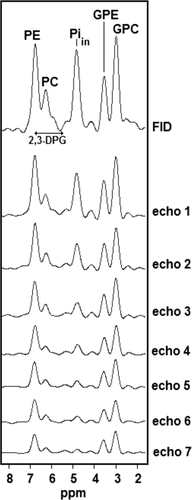
Averaged brain 31P MR spectra of the nine healthy volunteers (obtained from FID and echoes). For each volunteer, a voxel was chosen corresponding to the location, as shown in Figure 4a. The possible range of the chemical shift of the 2,3-DPG signals, as indicated in the figure, is 5.4 to 6.9 ppm for 7.3 ≤ pHi ≤ 7.4 and 1% ≤ oxygenation ≤ 98%, respectively.
An overview of all metabolite calculated T2 values with the standard deviation of the fit for the nine subjects is shown in Figure 8. The last column in the graph shows the variance-weighted average of the metabolite T2 over the nine volunteers. Numerical values of the variance-weighted averages of the metabolite transverse relaxation constants, T2, are summarized in the third column of Table 1.
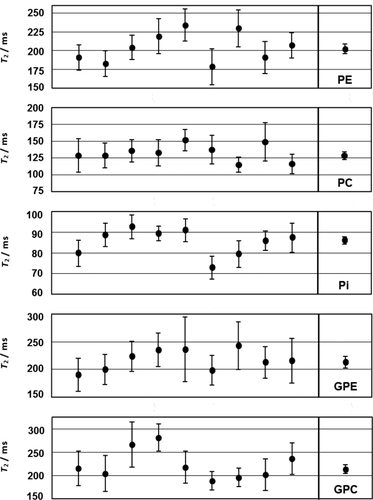
Fitted T2 Equation [2] values (standard deviation) of PE, PC, Pi, GPE, and GPC at 7T of the brain of nine healthy volunteers. The last plotted point for every metabolite is the variance weighted mean of the nine volunteers.
DISCUSSION
The determined time constants for correction of the pulse performance of the refocusing composite block pulse are in the range of 2.3 s to 14.4 s at the chemical shift of the metabolites investigated. With an intrinsic metabolic T2 of 200 ms, this amounts to a correction that is in the range of 1% to 8%; however, with an intrinsic metabolic T2 of 100 ms, the correction is only 1% to 4%.
The spectra derived from the FID and echo acquisitions, as depicted in Figure 4, clearly show signals from PE, PC, intracellular Pi (Piin), GPE, and GPC; however, there appear to be a few more signals visible. Due to the truncation artefact, it is difficult to distinguish between real signals and artefacts. The phosphomonoester signals (PE + PC) of the FID spectrum seem somewhat broadened. It is possible that two signals from 2,3-diphosphoglycerate (2,3-DPG), which is abundantly present in red blood cells, could contribute to the signal of PC, and to a lesser extent to PE in the FID spectrum. The visibility of these two 31P signals from 2,3-DPG in the brain has been previously inferred 26, 27. The chemical shift of the 2,3-DPG signals is highly dependent on the intracellular pH and the oxygenation of the red blood cells. For 7.3 ≤ pHi ≤ 7.4 and 1% ≤ oxygenation < 98%, the chemical shift (referenced to PCr) of the 2P signal ranges from 5.4 to 6.2 ppm, whereas the chemical shift of the 3-phosphorous signal ranges from 6.2 to 6.9 28-30. This spans the range of the phosphomonoesters PC and PE, with PC approximately 6.25 ppm and PE approximately 6.8 ppm. From a concentration perspective, 2,3-DPG from blood can contribute significantly to the signal of PC, although the impact of 2,3-DPG will probably be limited to the FID signal and possibly the first echo because the blood flow and the spoiler gradients around the refocusing pulses will dephase these signals substantially in the later echoes. Cerebral blood volume in healthy adults is approximately 3.8% of cerebral volume 31, whereas the normal 2,3-DPG concentration in packed red cells is 4.5 to 5.1 mM 32 and in normal haematocrit (males and females combined) is 36% to 50% 32. Combined, this leads to a cerebral 2,3-DPG concentration ranging from 0.061 to 0.099 mM. With two 31P signals for one molecule of 2,3-DPG, the contributing signal to the PME signals is in the range of 0.12 to 0.2 mM. From autopsies, it is known that the normal concentration range of PC in the brain is 0.30 to 0.40 mM 33. Consequently, the PC signal as obtained by 31P MRS could be 67% too high (upper limit) due to the contributing signals from 2,3-DPG.
The signal labeled Piin has a left shoulder of approximately 5.3 ppm that could be extracellular Pi. Extracellular phosphate in the brain has been identified previously by Ren et al. 2, who also measured the T1 of the intracellular and extracellular phosphate signals in the brain. The origin of the signal at 4.3 ppm is not clear and is not confined to the spectra of the single volunteer in Figure 4. On averaging the spectra from all volunteers, this signal remains visible (Fig. 7). We are inclined to identify it as a truncation artefact, as shown in Figure 6; however, Pi in an acidic environment of pH of approximately 6.7 could possibly also explain the signal. Low pH values are not uncommon in, for instance, lysosomes; and a series of eight Pi signals at different pH have also been reported in the normal isolated dog brain, spanning the chemical shift range of 4.07 to 5.17 ppm 34.
The T2s of PE, GPE, and GPC that were determined in the brain at 7T are comparable and approximately 200 ms. The apparent T2 of PC is most likely too low because it is possibly influenced by the 3P and 2P signals of 2,3-DPG from blood, which have a shorter apparent T2 than PC (due to blood flow and spoiler gradients around the refocusing pulses), as can be seen from the subsequent echo spectra in Figures 4 and 7. Upon omitting the FID and first echo signal for the T2 fits of PC, a variance-weighted T2 of 182 ± 7 ms is found. Fitting the T2 of PC with a two-component model, taking into account a variable fraction of non-PC signal with a variable T2, leads to a variance-weighted T2 = 203 ± 4 ms for PC. Here, we first determined an average T2 and an average fraction for the underlying non-PC signal for the group of nine volunteers by fitting the individual PC data with the following constraints: 140 ms ≤ T2 (PC) ≤ 350 ms; fraction non-PC signal between 10% and 67%; and 0 ms ≤ T2 (non-PC) ≤ 75 ms. This leads to a fraction of non-PC signal of 52% and T2 (non-PC) = 37 ms when averaged over all nine volunteers. These values were subsequently used, and fixed, to fit the individual T2 data of PC for the nine volunteers. Variance weighting of these individual T2s of PC then leads to the variance-weighted T2 value of 203 ± 4 ms. These values are more in line with the T2s of PE and the phosphodiesters.
Phosphorus spectroscopy, utilizing polarization transfer, indeed shows a much cleaner signal in the phosphomonoester range in the human brain because the underlying non-PC and non-PE signals are not amplified, as compared to a direct detection acquisition 35, 36.
The rather short T2 of Piin of only 86 ± 2 ms is likely caused by exchange with γ-ATP via the reversible reactions involving the GAPDH and phosphoglycerate kinase enzymes of the glycolytic pathway. It is known that GAPDH mRNA expression of the human cortex is high 22. The short T2 time of Piin is corroborated by a short T1, which was measured by Ren et al. 2, who found a 40% shorter T1 for intracellular Pi as compared to extracellular Pi in the healthy human brain at 7T. These authors also attributed the shorter T1 of Piin to exchange with γ-ATP. In addition, saturation transfer measurements in rat brain at 11.7T revealed that the extracellular inorganic phosphate Piex is insensitive to saturating γ-ATP, whereas the signal of the intracellular pool Piin is reduced, designating a cytosolic origin for exchange between Pi and γ-ATP 37. Note that saturation transfer measurements in skeletal muscle, with the aim of measuring the mitochondrial Pi to γ−ATP flux, always lead to extreme high values as compared to other methods 38. Here also, the cause is sought in the exchange between Pi and γ-ATP through the glycolytic pathway 38. Indeed, the T2 of Piin from skeletal muscle is much shorter than, for instance, the T2 of the phosphodiesters or PC 39, 40 signals from skeletal muscle. Recently, we measured the T2 of 31P metabolites in healthy breast tissue and breast cancer tissue. For Pi in healthy breast tissue, we found 180 ± 4 ms 20, whereas the T2 of Pi in breast cancer tissue was 87 ± 8 ms 21. Here, it also seems likely that the short T2 of Pi in breast cancer tissue is caused by the exchange of Pi with γ-ATP via the glycolytic pathway because cancer cells have up-regulated glycolysis.
CONCLUSION
We determined the apparent T2s of PE, GPC, and GPE to be approximately 200 ms and that of PC to be approximately 129 ms. We attribute the lower apparent T2 value of PC to the overlap of this resonance with the 3P and 2P resonances of 2,3-DPG from blood, with a shorter T2. Omitting the FID signal and the first echo of PC leads to a variance-weighted T2 of 182 ± 7 ms, whereas a biexponential fit leads to a variance-weighted T2 for PC of 203 ± 4 ms. The short T2 of Pi of only 86 ms is subscribed to the fast reversible exchange with γ-ATP, which is mediated by GAPDH and phosphoglycerate kinase within the glycolytic pathway.


