Decoding the effect of photoperiodic cues in transducing kisspeptin-melatonin circuit during the pubertal onset in common carp
Nehareeka Dan and Harsh Shah are joint first authors
Abstract
This study unravels the intricate interplay between photoperiod, melatonin, and kisspeptin to orchestrate the pubertal onset of Common carp. Female fingerlings exposed to long days (LD) exhibited a hormonal crescendo, with upregulated hypothalamic-pituitary-ovarian (HPO) axis genes (kiss1, kiss1r, kiss2, gnrh2, gnrh3) and their downstream targets (lhr, fshr, ar1, esr1). However, the expression of the melatonin receptor (mtnr1a) diminished in LD, suggesting a potential inhibitory role. This hormonal symphony was further amplified by increased activity of key transcriptional regulators (gata1, gata2, cdx1, sp1, n-myc, hoxc8, plc, tac3, tacr3) and decreased expression of delayed puberty genes (mkrn1, dlk1). In contrast, short days (SD) muted this hormonal chorus, with decreased gnrh gene and regulator expression, elevated mtnr1a, and suppressed gonadal development. In in-vitro, estradiol mimicked the LD effect, boosting gnrh and regulator genes while dampening mtnr1a and melatonin-responsive genes. Conversely, melatonin acted as a conductor, downregulating gnrh and regulator genes and amplifying mtnr1a. Our findings illuminate the crucial roles of melatonin and kisspeptin as opposing forces in regulating pubertal timing. LD-induced melatonin suppression allows the kisspeptin symphony to flourish, triggering GnRH release and, ultimately, gonadal maturation. This delicate dance between photoperiod, melatonin, and kisspeptin orchestrates common carp's transition from juvenile to reproductive life.
1 INTRODUCTION
Puberty in teleosts signifies a crucial developmental phase when individuals attain sexual competency, orchestrated by signals from the hypothalamic-pituitary-gonad (HPG) axis (Dufour & Rousseau, 2007; Jalabert, 2005; Okuzawa, 2002; Patiño, 2002; Schulz & Goos, 1999; Schulz, 2002; Weltzien et al., 2004; Zanuy et al., 2001). This intricate process is deeply influenced by factors such as photoperiod control (Bromage et al., 2001), nutritional status, and induced triploidy in farm culture (Benfey, 1999).
Various components of the HPG axis play pivotal roles in initiating puberty and subsequent gonadal maturation in fish (Okuzawa, 2002). Among the emerging regulators is the RF amide peptide kisspeptin (Kiss) 1 and 2, identified by Parhar et al., 2004 in tilapia. These peptides, secreted by hypothalamic kisspeptin neurons, activate the downstream axis by binding to their cognate receptor GPR54. Conversely, cues from environmental changes influencing circadian rhythm via the photoperiod hormone melatonin can act as suppressors of puberty. These alterations are particularly significant for seasonal and annual breeders. Migaud et al.'s (2010) work on temperate fish species underscores the crucial role of seasonal changes in day length, individually or in conjunction with temperature, in synchronizing seasonal reproduction and influencing breeding periodicity.
In line with other vertebrates, melatonin in fish serves as a conventional messenger of photoperiod or Zeitgeber, with plasma melatonin titers remaining high during short days and low during long days (Maitra & Hasan, 2016; Reiter et al., 2009).
The study by Parhar et al., 2004 in tilapia demonstrated that the expression of kiss1r rises at puberty, subsequently falling under continuous light exposure. This suggests that natural light may influence the transcriptional mechanisms governing kiss1r expression. Similarly, in zebrafish, kiss1r rises during pubertal onset, indicating the involvement of the kiss1/kiss1r pathway in fish puberty (Van Aerle et al., 2008). Administering external kisspeptin to Catla catla fish increased the expression of reproductive genes (gnrh, lh, and fsh), leading to the onset of puberty (Rather et al., 2016). In Nile tilapia, kisspeptin administration elevated estradiol and testosterone levels in blood plasma, along with increased gonadotropin expression in the brain (Park et al., 2016), a trend observed in a recent study on Senegalese sole (Oliveira et al., 2020).
Nevertheless, the interaction between melatonin and kisspeptin during pubertal onset remains elusive. Recent evidence suggests that changes in photoperiod can either delay or expedite pubertal onset, as seen in the decreased expression of kiss1r/gnrh mRNA in male European seabass during spermatogenesis under the influence of photoperiod (Alvarado et al., 2015). Given the nascent state of in-depth studies and recognizing this knowledge gap, this study aims to investigate the impact of different photoperiod regimes on kisspeptin activation in Common carp (Cyprinus carpio) during pubertal onset and explore the potential interplay between melatonin and kisspeptin in the brain.
2 MATERIALS AND METHODS
2.1 Fish maintenance
Common carp fish fingerlings (age 2–3 months) were selected by examining physical characteristics like their abdomen, with swollen fish being chosen and identified as females. They were sourced from reliable brooders (A-new Maharaja fisheries), ensuring uniformity in size (1-4 cm) and weight (0.2–0.5 g). Upon arrival at the laboratory, the fingerlings were placed in well-aerated tanks filled with chlorine-free water and allowed to acclimate for 5 days. The water parameters, including temperature (maintained at 27 ± 2°C), pH (7.1 ± 0.5), and dissolved oxygen (3.9 ± 0.02 mg/L), were carefully regulated. The fish were nourished with commercial fish pellets (Optimum - All Life Stages 3 in 1 Fish Food for Carp, Goldfish and Cichlid Spirulina 6% Floating Type-mini pellet, Bangsaothong, Thailand) and to ensure optimal conditions, 30% of the water was refreshed every alternate day, providing a constant supply of oxygen-enriched freshwater.
2.2 Experimental regimen
Female fish were systematically allocated into three groups: Control (12 h:12 h), Long day (18 h: 6 h), and Short day (6 h: 18 h), with each group comprising ten individuals, denoted as n = 10. This designated treatment regimen (150 lux) persisted for 21 days. On the 22nd day, the fish was anesthesised using 1% clove oil (Apollo Pharmacy) (Fernandes et al., 2017) in ice-cold water, followed by sacrifice. Subsequently, the brain and gonads were meticulously dissected and preserved at −20°C for subsequent processing. Blood samples, crucial for hormonal analysis, were obtained through tail ablation, and processing of these samples was initiated within a 4 h timeframe from collection.
2.3 Gonadosomatic Index (GSI)
2.4 17β-HSD and 3β-HSD enzyme activity
The substrates, DHEA (Sigma: 700087P) and 17β-estradiol (E2, HiMedia: TC346), were initially dissolved in 200–500 μL of dimethyl formamide (DMF) (Sigma: 227056) and ethanol (Sigma: V001298), respectively. The resulting stock solution (1 mM) was prepared in 0.1 M Tris-HCl (HiMedia: TC073). The color reagent was crafted by combining 40 mg INT (SRL: 40686), 10 mg PMS (Sigma: P9625), and 0.5 mL Tween-20 (HiMedia: MB067) in 50 mL distilled water, stored in an amber bottle. Notably, PMS was excluded from the reagent for the enzyme assay. The phthalate buffer was formulated by adding 2.55 g Potassium Hydrogen Phthalate (SRL: 80633) to 51 mL 0.1 N HCl and 2.5 mL Tween-20, adjusting the pH to 3.0 and reaching a final volume of 250 mL with distilled water.
Ovarian homogenate (20–30 mg) was prepared in 5 mL of 0.1 M Tris-HCl Buffer (pH – 7.8) and centrifuged at 10,000 rpm for 30 min at 4°C. The resulting supernatant served as the enzyme source. The assay took place in 1 mL of 0.1 M Tris-HCl buffer (pH – 7.8), comprising 1 mL nicotinamide adenine dinucleotide (NAD) (500 μM) (SRL: 26759), and 1 mL of either the substrate DHEA (200 μM) for 3β-HSD or the substrate 17β-estradiol (E2, 200 μM) for 17β-HSD. The reaction was initiated by adding the enzyme (100 μL) and the color reagent INT (500 μL). This mixture was incubated for 1 h at 37°C, and the reaction was terminated by adding 2 mL of phthalate buffer. Absorbance was measured at 490 nm. Enzyme activity was calculated from the standard curve correlating NADH concentration to absorbance. For the standard curve, graded concentrations of NADH (0–60 μM) (SRL: 77268) were reacted with 1 mL of 0.1 M Tris-HCl and 500 μL color reagent. After color formation, 2 mL of phthalate buffer was added to stop the reaction, and absorbance was read at 490 nm. Protein content was determined using the Bradford (SRL: 19219) assay. Enzyme activity was calculated from the NADH standard curve and expressed as enzyme activity per milligram of protein (Maharjan et al., 2010; Qujeq, 2002; Shivanandappa & Venkatesh, 1997).
2.5 Hormonal titers
Blood collection was executed using the tail ablation method after the designated treatment period. Subsequently, hormonal assays for FSH (E0039FI), LH (E0040FI), and melatonin (E0003FI) were conducted using Bioassay Technology Lab kits.
2.6 Immunohistochemistry
The hypothalamus was carefully dissected using a stereo microscope (Labomed – LUXEO-2S) meticulously dissected and preserved in 4% paraformaldehyde (SRL: 158127). For slide preparation, tissues underwent dehydration through graded ethanol concentrations (50% to 100%, 30 min each) and then in xylene (30 min, twice) (SRL: 242812). Subsequently, the tissues were embedded in wax blocks using Paraplast plus (Sigma: P3683), and sections were obtained on slides coated with poly-l-lysine (Sigma: P9155).
The slides were subjected to xylene (10 min, twice) and gradient ethanol washes (100% to 50%, 5 min each) to facilitate deparaffinisation and rehydration. Antigen retrieval was accomplished by treating the sections with 0.1% trypsin (HiMedia: TCL007) in PBS for 30 min at 37°C, followed by a wash with TBST (5 min), and subsequent incubation in blocking buffer (3% BSA in TBST) for 2 h. Following the blocking step, slides were washed with TBST (5 min) and incubated overnight with the primary antibody at 4°C. The following day, after another round of washing with TBST, secondary antibody incubation was carried out for 2 h in the dark. Subsequently, DAPI staining (HiMedia: TC229) was performed for 20 min, followed by a wash with TBST, and fluorescence images were captured using a fluorescence microscope (Axio Vert A1, Carl Zeiss, Oberkochen, Baden-Württemberg, Germany) (Basting et al., 2021).
2.7 Histology
Post-dissection, the ovaries were fixed in 4% paraformaldehyde. After dehydration in graded ethanol concentrations (50%–100%, 30 min each), they underwent immersion in xylene (30 min, twice), followed by embedding in paraffin wax. Sections of 3 mm thickness were cut, mounted on glass slides pre-coated with poly l-lysine, and rehydrated using graded ethanol concentrations (100%–50%, 5 min each).
Subsequently, the sections were stained with Haematoxylin (HiMedia: S034) for 5 min, followed by 1% Eosin (HiMedia: S007) for an additional 5 min, per the provided manual. The resulting sections were meticulously examined and photographed using a light microscope (Basting et al., 2021).
2.8 Histone acetylation
2.9 Primary culture of brain
The fish brain was delicately dissected using sterilized equipment and washed three times with PBS (pH: 7.4). The diencephalon was identified and finely chopped before being transferred to a 1.5 mL tube for centrifugation at 2000 rpm (2 min). The resulting pellet, containing neurons, underwent treatment with collagenase type-I (Thermo, Waltham, Massachusetts, USA: 17100-017) for 20 min at 28°C in a shaking water bath. Subsequently, the tubes containing neurons were centrifuged at 2000 rpm for 5 min to eliminate collagenase, and the pellet was washed thrice with L-15 media (HiMedia: AL011S) supplemented with 15% FBS (Thermo: 26140079) and 1% gentamicin (HiMedia: A005).
- 1.
Control (C)
- 2.
0.01 μM - low melatonin (LM)
- 3.
0.1 μM - high melatonin (HM)
- 4.
0.01 nM - low estradiol (LE)
- 5.
0.1 nM - high estradiol (HE)
- 6.
0.01 nM - low estradiol + 0.01 μM melatonin (LEM)
- 7.
0.1 nM - high estradiol + 0.1 μM melatonin (HEM)
- 8.
0.01 μM - low melatonin + 0.01 μM luzindole (LLM)
- 9.
0.1 μM - high melatonin + 0.1 μM luzindole (HLM)
2.10 Quantitative real-time PCR
Tissues or cells underwent a single wash with PBS before homogenizing with RNAiso plus (TaKaRa: 9109) for RNA isolation. The RNA obtained was quantified using a nanodrop spectrometer (Shimadzu BioSpec-nano) and subsequently utilized for cDNA synthesis (ThermoFisher: 4368814). Primers for the candidate genes were meticulously designed using NCBI software, as outlined in Supplementary Table 1.
Quantitative real-time PCR was executed using SYBR Green master-mix (ThermoFisher: A25742) for 40 cycles, following the protocol by Pandya et al., 2020. The “Ct value” was employed to calculate the relative expression of the gene of interest using Microsoft Excel, and graphical representations were generated using GraphPad Prism software.
2.11 Western blot
Samples were homogenized in RIPA buffer using a homogenizer supplemented with 10% protease inhibitors (Sigma: S8820) and centrifuged at 12,000 rpm for 10 min at 4°C. The resulting supernatant was carefully transferred to a new vial. Total protein content was quantified using the Bradford assay, and samples were prepared in Laemmli buffer (HiMedia: ML021) and then stored at −20°C. A total of 40 μg of protein was loaded, separated by SDS-PAGE with stacking (5%) and separating gel (10%–12%), and transferred to a PVDF membrane (Immobilon). The blots were verified by ponceau-S stain to ensure proper transfer. The blots were cut before hybridization with antibodies.
After blocking in 5% skimmed milk (HiMedia: GRM1254) prepared in TBST for 1 h, the membrane underwent incubation with a primary antibody (Invitrogen) at a dilution of 1:1000 (4°C overnight). This was followed by incubation with a secondary antibody conjugated with HRP (1:250) (Invitrogen) for 2 h. Signals were detected using an ECL reagent (Bio-Rad), and densitometric analysis of the obtained bands on the blotted membrane was conducted using Image J software (Abcam manual). The details of the antibodies used are mentioned in Supplementary Table 2.
2.12 Immunofluorescence
Coverslips, thoroughly washed with methanol, were carefully positioned inside a 12-well plate and coated with Poly l-Lysine. The primary culture was established, with specific doses administered to each well. Following the 7-day treatment period, the media were removed, and cells were washed with PBS before fixing with 70% methanol (SRL: 37152) for 1 min. After another round of PBS washing, cells were blocked with 1% BSA (HiMedia: MB083) in PBST (0.1% Tween−20) for 30 min. This was succeeded by overnight incubation with the primary antibody at 4°C. After washing with PBST, secondary antibody incubation was carried out for 1.5 h in the dark the subsequent day. The cells were then counter-stained with DAPI (15 min), and fluorescence was captured using a fluorescence microscope (Axio Vert A1, Carl Zeiss) as per the Abcam manual.
2.13 Statistical analysis
The results are presented as mean ± SD from three independent experiments conducted in triplicate. To assess the interaction between the treatment groups and the control, one-way ANOVA was executed using GraphPad Prism 8.4.2 (GraphPad Software, Inc.). Densitometry analysis of the western blots and immunofluorescence images was carried out using ImageJ software (NIH). A significance level of **p < 0.01, *p < 0.05 was deemed statistically significant.
3 RESULTS
3.1 In vivo
3.1.1 Analyzing the Gonadosomatic Index (GSI) of ovary
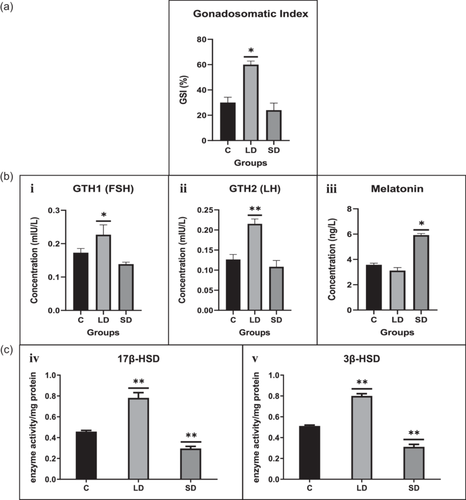
The GSI across all three groups fell within the 24%–60% range. Notably, the LD group exhibited a significant increase in gonadal weight compared to the SD and control groups. Conversely, the SD group displayed a nonsignificant decrease in weight, as illustrated in Figure 1.
3.1.2 Hormonal assay
Hormonal titers for GtH1 (FSH), GtH2 (LH), and melatonin were measured, revealing noteworthy findings. Both gonadotropins (GtH1 and GtH2) exhibited a significant increase under the LD light regime, whereas a decrease was observed in the SD treatment regime. In contrast, melatonin significantly increased in the SD group compared to the control and LD light regimes, as depicted in Figure 1.
3.1.3 Enzyme activity determination
Enzymatic activity of steroidal enzymes in the ovary was assessed, revealing a significant increase in both 17β-HSD and 3β-HSD in the LD photoperiod compared to the control and SD, as depicted in Figure 1.
3.1.4 Quantitative PCR
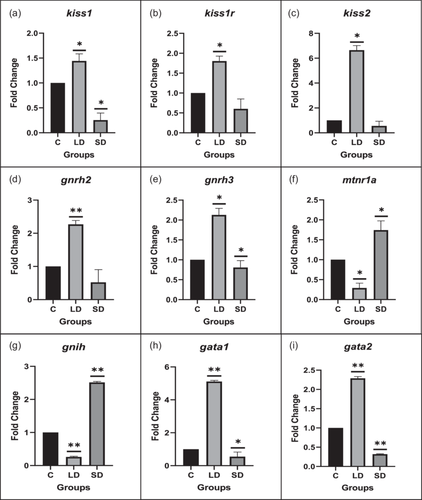
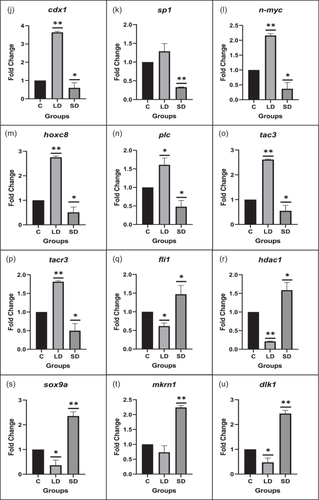
Gene expression analysis was conducted to unravel the crosstalk between kisspeptin and melatonin, and in the LD photoperiod, kiss1, kiss1r, kiss2, gnrh2, and gnrh3 displayed significant upregulation compared to the control. Conversely, mtnr1a and gnih genes significantly increased in the SD photoperiod relative to the control.
Moreover, the expression patterns of transcription factors and signaling molecules governing kisspeptin expression, including gata1, gata2, cdx1, sp1, n-myc, sox9a, fli1, hoxc8, plc, hdac1, tac3, and tacr3, were assessed. All showed a significant increase in the LD photoperiod (except sp1). In contrast, sox9a, fli1, and hdac1 were significantly upregulated in the SD group compared to the control.
Furthermore, key pubertal regulator genes like mkrn1 and dlk1 exhibited a significant upregulation in the SD photoperiod relative to the control, as illustrated in Figure 2.
3.1.5 Protein expression
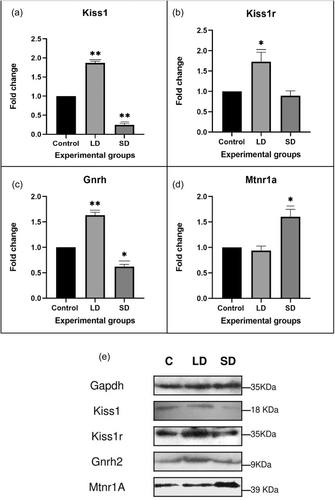
To validate the gene expression data, western blot analysis assessed the protein expression levels of key HPG axis components, including Kiss1, Kiss1R, Gnrh, and Mtrn1A. The protein levels of Gnrh, Kiss1, and Kiss1R exhibited a significant increase in LD exposure. However, the melatonin receptor demonstrated a significant increase in SD exposure, as depicted in Figure 3.
3.1.6 Immunohistochemistry
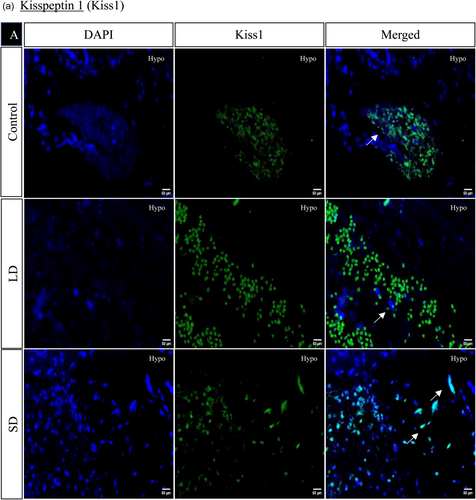
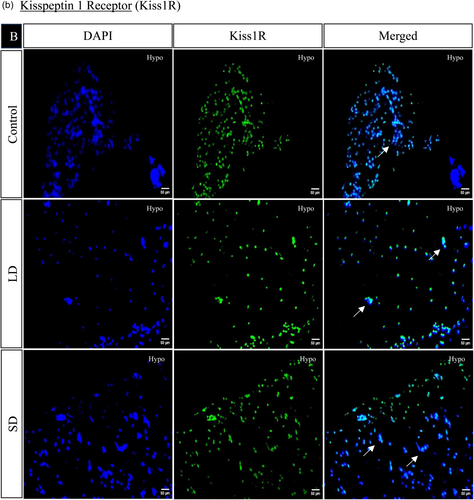
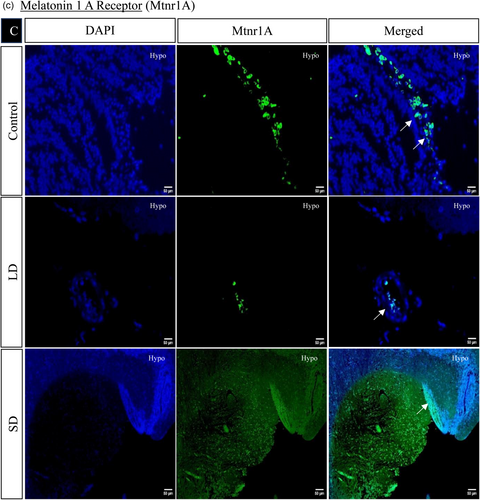
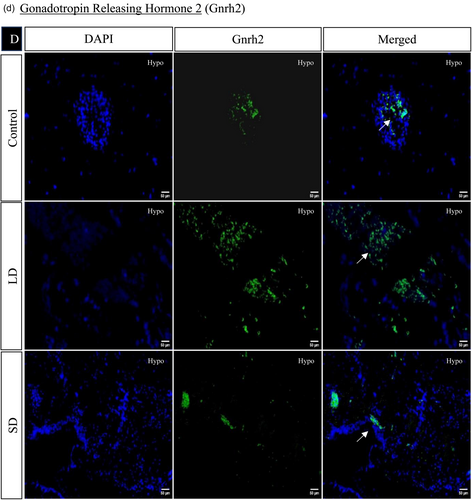
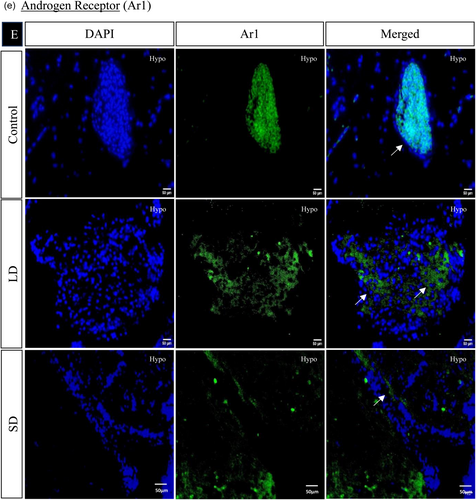
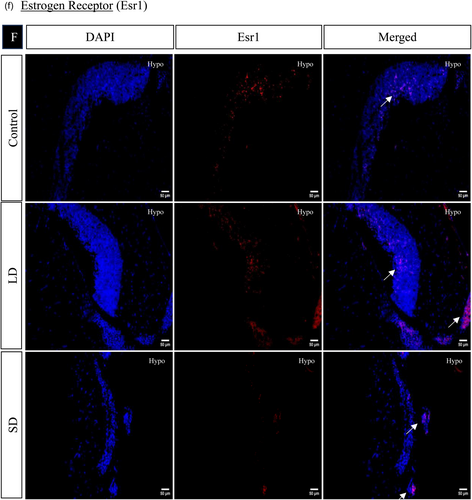
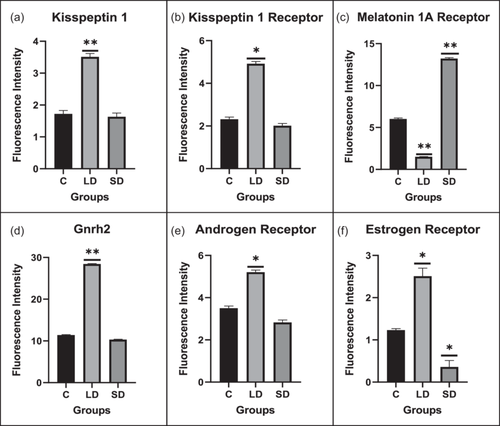
The spatial distribution of proteins, including kisspeptin, kisspeptin receptor, melatonin receptor, Gnrh, estrogen receptor, and androgen receptor in the brain, was examined under LD and SD photoperiod conditions. The localization of kisspeptin, kisspeptin receptor, Gnrh, estrogen receptor, and androgen receptor exhibited a significant increase in LD exposure compared to SD and control. Conversely, the melatonin receptor displayed the opposite pattern, significantly increasing SD exposure compared to LD and control (Figures 4 and 5).
3.1.7 Histone acetylation
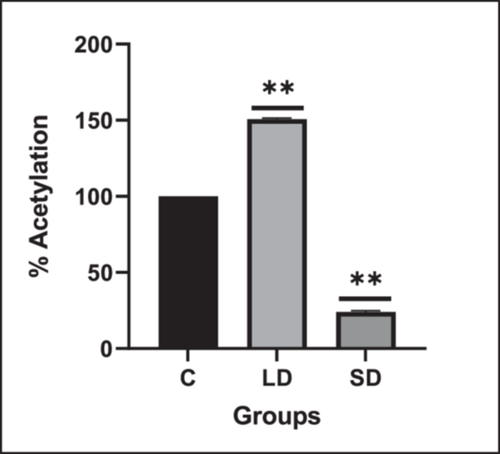
Global histone acetylation levels exhibited a significant upregulation in LD exposure, contrasting with a downregulation in SD exposure compared to the control (Figure 6).
3.1.8 Histology
Ovarian histology was conducted under varying photoperiod conditions. In LD exposure, the oocytes were observed to be in the mid-vitellogenesis stage with an increased number of nuclei. Conversely, under SD exposure, oocytes were in the previtellogenesis stage, with a limited presence of primary oocytes (Figure 7).

3.2 In vitro
3.2.1 Quantitative PCR
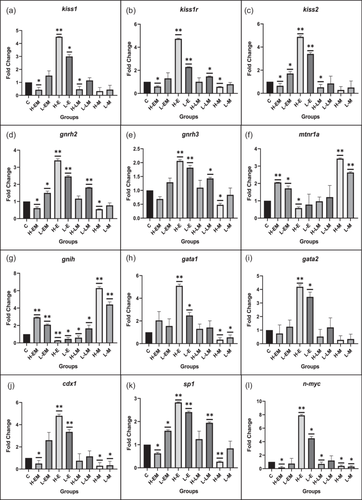
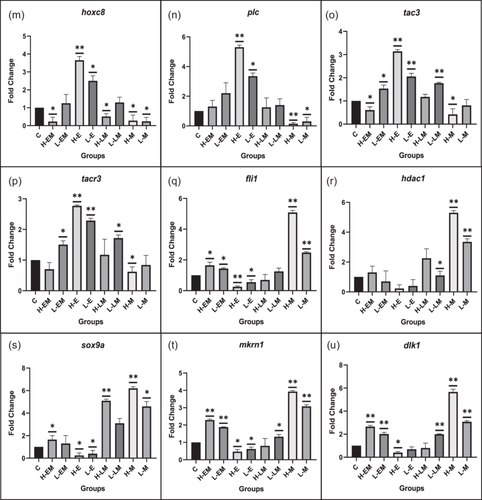
Hypothalamic neuron cell cultures were established, exhibiting round and adherent cell morphology. Gene expression analysis revealed significant alterations in kisspeptin-related genes (kiss1, kiss1r, kiss2) and gonadotropin-releasing hormone-related genes (gnrh2, gnrh3) under various treatment conditions.
In both HE and LE groups, all genes exhibited a significant upregulation. In contrast, the HEM group showed a significant downregulation, except for gnrh3, which displayed a nonsignificant decrease. The LEM group demonstrated a significant increase in kiss2 and gnrh2, with a nonsignificant increase in kiss1, kiss1r, and gnrh3. kiss1r, gnrh2, and gnrh3 genes were upregulated in both HLM and LLM groups, with significance noted in LLM. Conversely, the HM and LM groups exhibited downregulation in all the genes, with significance noted in the HM group of kiss1r, gnrh2, and gnrh3.
Furthermore, melatonin receptor-related genes (mtnr1a and gnih) displayed downregulation in the HE, LE, and HLM groups, particularly in gnih. On the other hand, both genes were significantly upregulated in the HEM, LEM, HM, LM, and LLM groups.
Transcription factors and signaling molecules governing kisspeptin expression, including gata1, gata2, cdx1, sp1, n-myc, hoxc8, plc, tac3, tacr3, fli1, hdac1, and sox9a exhibited varying expression patterns. HM and LM displayed downregulation, except in fli1, hdac1, and sox9a. In contrast, HE and LE showed significant upregulation, except in fli1, hdac1, and sox9a. Pubertal regulator genes, mkrn1, and dlk1, were significantly upregulated in LEM, HEM, LM, HM, and LLM groups while downregulated in LE and HE groups, with significant changes noted in both genes in the respective groups (Figure 8).
3.2.2 Protein expression
In Cyprinus carpio neurons, the protein expression analysis of key markers revealed significant changes under different treatment conditions. Kisspeptin (Kiss1) and kisspeptin receptor (Kiss1R) levels were significantly upregulated in HE and LE groups, while showing a decrease in HM and LM groups, with significance in HM. In contrast, melatonin receptor (Mtnr1A) levels displayed an opposite pattern, significantly upregulated in HM and LM, and downregulated in HE and LE.
The expression levels of transcription factors, including n-Myc, Hdac, Plc1, Fli1, Hoxc8, and c-Jun, were also examined. In both HE and LE, c-Jun, n-Myc, Hoxc8, and Plc exhibited an increase, with significance in c-Jun, n-Myc, and Hoxc8 in both groups and Plc in HE. Conversely, these factors showed an opposite trend in HM and LM, with significance noted for Plc, n-Myc, and Hoxc8 in HM. There was a mixed pattern in HEM, LEM, HLM, and LLM, with some factors upregulated and others downregulated, though non-significantly.
Hdac1 exhibited a decreased expression in HE, LE, HEM, and LEM groups, with significance in HE and LE. Fli1 also displayed a similar expression pattern, with significance in LEM, HE, and LE groups. Both factors showed significant upregulation in HM and LM (Figure 9).

3.2.3 Immunofluorescence
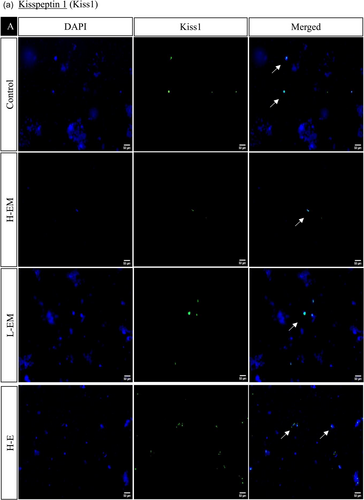
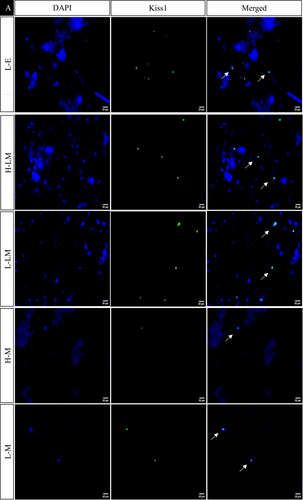
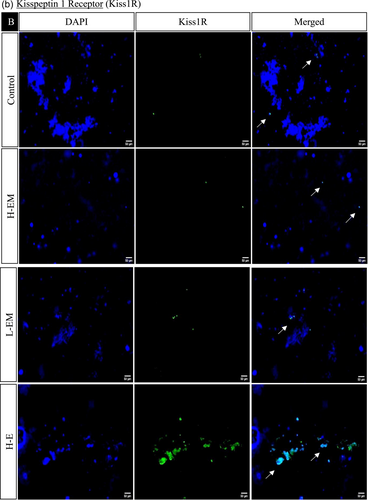
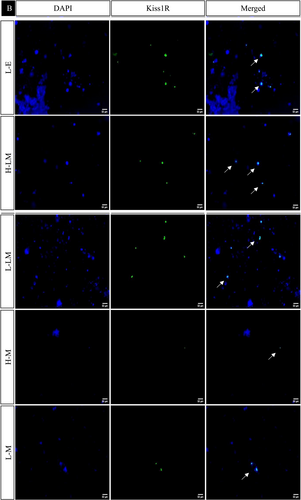
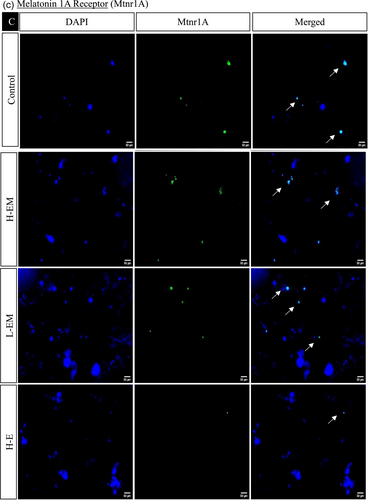
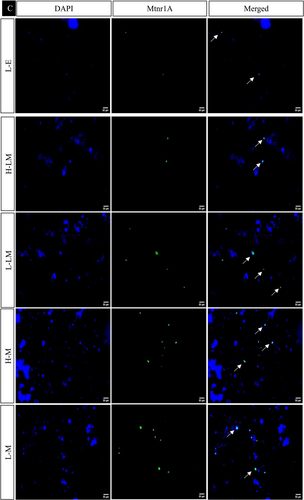
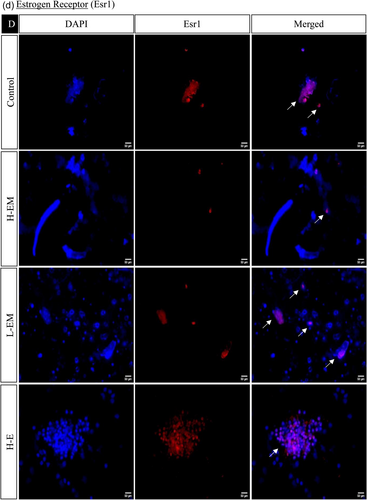
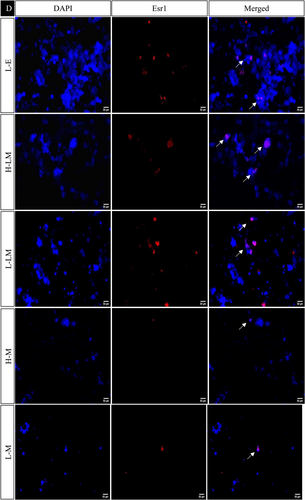
In the hypothalamic region under various treatment regimes, the immunofluorescence analysis revealed distinct localization patterns for kisspeptin, kisspeptin receptor, melatonin receptor, and estrogen receptor.
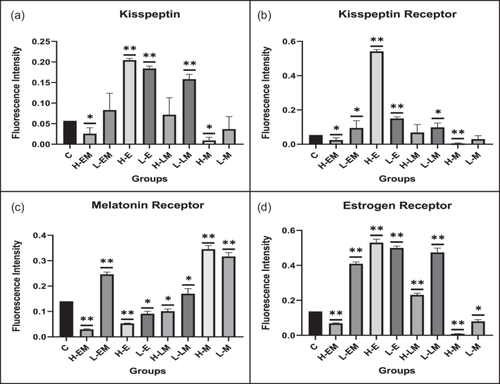
Kisspeptin (Kiss1) and kisspeptin receptor (Kiss1R) exhibited increased expression in LEM, HE, LE, HLM, and LLM groups, with significance observed in the HE, LE, and LLM groups. Conversely, these markers displayed decreased expression in the HEM, HM, and LM groups, with significance in HEM and HM. This pattern was consistent with the observed changes in protein expression.
The estrogen receptor exhibited significantly similar localization patterns to kisspeptin and its receptor. On the other hand, the melatonin receptor showed a significant increase in the LEM, LLM, HM, and LM groups while decreasing significantly in HE, LE, HEM, and HLM groups (Figures 10 and 11).
4 DISCUSSION
This study sheds light on the intricate interaction between kisspeptin and melatonin under diverse photoperiodic conditions during the onset of puberty. Kisspeptin, a pivotal peptide, activates gonadotropin hormones, initiating the central reproductive axis. In contrast, melatonin, a hormone influenced by photoperiod, plays a dual role as a suppressor and gonadostat, with its levels diminishing during puberty. Pubertal onset and sexual maturation are multifactorial processes influenced by external factors such as light, temperature, feed intake, nutrition, water temperature, and stress (Heggberget, 1988; Palstra et al., 2007; Poncin et al., 1987). Notably, photoperiod significantly influences fish spawning patterns. This study establishes a meaningful connection between these two key components, providing valuable insights into the initiation of puberty in Common carp (Cyprinus carpio). The findings hold promise for broader applications in aquaculture practices.
The fish were exposed to two distinct light conditions: short and long days. Notably, an augmentation in gonadal weight was evident during the LD conditions. This aligns with observations in Odontesthes bonariensis females subjected to extended photoperiods, where elevated GSI values and vitellogenic oocytes were noted (Miranda et al., 2009). Consistent with these findings, a study on Cheirodon interruptus demonstrated an increased GSI in response to progressive photoperiod treatment, underscoring the significance of an extended photoperiod for initiating gonadal maturation (Garcia et al., 2018). These parallel results emphasize the pivotal role of light conditions in influencing gonadal dynamics across diverse fish species.
The hormonal assay, focusing on Gth1 and Gth2, and the enzymatic activities of 17β-HSD and 3β-HSD exhibited an upward trend during LD exposure compared to the SD and the control groups. This concurs with findings from a study conducted on Seriola dumerili, where FSH and LH plasma levels were elevated under long photoperiod conditions (Nyuji et al., 2018). Similarly, in Heteropneustes fossilis, a decrease in steroidogenic enzymes was observed under SD photoperiod conditions. These consistent observations underscore the regulatory impact of photoperiod on the endocrine system, influencing hormonal dynamics and steroidogenic enzyme activities across different fish species.
Our comprehensive analysis encompassed both in vivo and in vitro settings to examine the gene expression patterns of the HPG axis. In vivo data illuminated a significant upregulation in gene expression, protein levels, and immunohistochemical localization of kiss1, kiss2, kiss1r, gnrh2, and gnrh3 in the LD group. In contrast, a significant reduction was observed in the SD photoperiod regime compared to the control group. This aligns with findings by Chaube et al., 2020, where melatonin treatment influenced gene expression in the brain based on reproductive stage and temperature conditions, particularly affecting kiss2 and gnrh2 expression in the Catfish Heteropneustes fossilis, thus emphasizing the pivotal role of photo-thermal mechanisms in regulating reproduction.
Moreover, exploration of key transcriptional factors governing kisspeptin expression in the hypothalamus revealed significant increases in cdx1, sp1, gata1, gata2, hoxc8, n-myc, plc, tac3, and tacr3 during LD photoperiod, corroborating their roles as positive regulators of the kisspeptin promoter. As per the prior studies (Goto et al., 2015; Kaiser et al., 1998; Navarro, 2020; Reiches & Ellison, 2022; Semaan et al., 2012; Tng, 2015), these findings underscore the orchestrated upregulation of positive regulators as upstream events leading to heightened kisspeptin expressions during LD conditions. Conversely, negative regulators such as hdac1, fli1, sox9a, dlk1, and mkrn1 displayed a downregulation in the LD photoperiod regime compared to the control group, indicative of a regulatory milieu conducive to pubertal onset (Abreu et al., 2015; Macedo & Kaiser, 2019; Maione et al., 2020).
Further supporting the activation of the feedback circuit, our localization data exhibited increased estrogen and androgen receptors in the hypothalamus under LD conditions compared to the control group. This integrated analysis provides valuable insights into the complex interplay of gene regulatory networks governing reproductive processes in response to photoperiodic changes.
In the context of developmental transitions, Callard et al., 2001 demonstrated a noteworthy observation where the initial minor increase in kiss1r expression at 35 days post-fertilization (dpf) acted as a pivotal stimulus for subsequent elevations in esr1, ar1, and cyp19a2 expression. This cascade is particularly significant as augmented expression of these genes is conventionally associated with elevated plasma levels of androgens and estrogens (Filby et al., 2008).
Interestingly, in mammals, brain regions governing kisspeptin and GnRH neurons, such as the arcuate nucleus and anteroventral periventricular nucleus, are subject to estrogenic influence through estrogen receptor (ESR1) (Smith et al., 2005). Hence, estrogen, a pivotal sex steroid, emerges as a key player in stimulating kisspeptin neurons. This intricate interplay between estrogen signaling and the regulatory networks controlling reproductive hormones underscores the multifaceted nature of the mechanisms orchestrating the onset and regulation of reproductive processes.
In our study, primary hypothalamic cultures were established from prepubertal fish, and subsequent estrogen, melatonin, and luzindole (melatonin inhibitor) treatments over 7 days mirrored the patterns observed in in vivo analyzes. The low (LE) and high (HE) estrogen treatments exhibited a significant upregulation in gene, protein, and localization of HPG axis genes, namely kiss1, kiss1r, and gnrh, accompanied by a downregulation of mtnr1a and gnih compared to the control. This aligns with the in vivo hypothesis, confirming the impact of diverse photoperiod regimes on HPG markers.
Furthermore, we delved into the gene expression alterations of transcriptional regulators governing the kisspeptin promoter. Notably, genes such as gata1, gata2, n-myc, plc, cdx1, sp1, hoxc8, tac3, and tacr3 exhibited upregulation in both LE and HE and downregulation in LM and HM groups. Intriguingly, luzindole administration (HLM and LLM) resulted in increased expression of gata1, sp1, plc, tac3, tacr3, and other transcriptional genes compared to the control, indicating conditions conducive to pubertal onset. Combined estrogen + melatonin treatments yielded nuanced outcomes. For instance, HEM exposure led to the downregulation of cdx1, gata2, sp1, tac3, tacr3, hoxc8, and n-myc, whereas LEM exhibited an increase in all genes except n-myc. This underscores the pivotal role of estrogen and melatonin levels in orchestrating transcriptional regulations and governing kisspeptin expression.
The intricate balance of acetylation and deacetylation patterns is crucial for gene expression during development, shaping the chromatin landscape. Diminished histone acetylation results in chromatin retraction, curtailing gene transcription (Stoney et al., 2017). In this context, studies on gonadal development have spotlighted the significance of H3 acetylation and the pivotal role of histone deacetylase enzymes (Laing et al., 2018; Waghmare et al., 2021; Zhang et al., 2013).
Our investigation precisely evaluated the hdac1 gene and protein expression concomitant with a comprehensive analysis of global histone acetylation patterns in the hypothalamus. Notably, LD exposure exhibited an augmented H3 acetylation pattern relative to SD, the control group, with a concurrent decrease in hdac1 expression. This intriguing finding hints at a potential activation of the kisspeptin promoter. The upsurge in gene expression, in turn, could catalyze activating the HPG axis through the release of GnRH. This nuanced regulatory tapestry underscores the dynamic interplay between histone acetylation patterns and the molecular machinery orchestrating reproductive processes.
Puberty, an epochal event in teleosts, heralds the advent of vitellogenic ovarian development in females. This transformative journey unfolds in distinct stages, commencing with the appearance of vitellogenic oocytes, followed by subsequent phases marked by oocyte maturation and ovulation (Patiño, 2002). Our histological exploration of ovarian dynamics provides a vivid tableau of this intricate process.
In the control group, ovarian histology revealed oocytes in the primary growth phase. A semblance of this pattern persisted in the SD group, manifesting a diminished maturation rate of ova. In stark contrast, the LD group exhibited a notable shift—follicles attained larger dimensions and featured secondary and tertiary vitellogenic follicles. Evidently, LD exposure exerted a stimulatory influence, enhancing ova maturation rates, while SD treatment imposed a quiescent state on the follicular development of Cyprinus carpio. This resonates harmoniously with findings from prior studies conducted on female Pejerrey and Catfish, where similar modulations in reproductive dynamics were observed (Acharjee et al., 2017; Miranda et al., 2009). Thus, our histological odyssey unravels the nuanced orchestration of puberty in teleosts, adding depth to the understanding of ovarian maturation processes.
5 CONCLUSION
Our comprehensive exploration, traversing both in vivo and in vitro experimental landscapes, unearths a rich tapestry of molecular dynamics orchestrating the onset of puberty. Key protagonists in this hormonal symphony—kisspeptin genes (kiss1, kiss2), kisspeptin receptor (kiss1r), and gonadotropin-releasing hormones (gnrh2, gnrh3)—emerge as central players undergoing robust activation. Their signaling counterparts, including gata1, gata2, sp1, cdx1, n-myc, hoxc8, plc, tac3, and tacr3, partake in a synchronous upregulation, underscoring their pivotal roles in steering the pubertal narrative.
Contrastingly, a downregulation narrative unfolds for melatonin receptor (mtnr1a), gonadotropin inhibitor (gnih), and repressors (sp1, fli1, hdac1). This orchestrated modulation culminates in the initiation of puberty, marking a pivotal shift in reproductive dynamics. Our study elucidates the intricate interplay between melatonin, photoperiod, and estrogen, emphasizing their indispensable roles in maintaining optimal kisspeptin levels for pubertal initiation.
Beyond biological insight, our findings bear practical significance for the aquaculture industry. By shedding light on the regulatory mechanisms governing the reproductive cycles of seasonal breeders, our study paves the way for informed breeding strategies, offering a promising avenue for enhancing the value of fish breeding in aquaculture. Thus, this research expands the frontiers of reproductive biology and holds pragmatic implications for sustainable aquaculture practices.
AUTHOR CONTRIBUTIONS
Nehareeka Dan: Investigation; methodology; data curation; writing–original draft. Harsh Shah: Investigation; writing–review and editing; methodology; data curation. Himadri Bhatt: Methodology; investigation. Rahul Ladumor: Methodology; investigation. Ankita Salunke: Methodology. Parth Pandya: Conceptualization; funding acquisition; writing–original draft; project administration; supervision; writing–review and editing; validation.
ACKNOWLEDGMENTS
We express our gratitude to Navrachana University for offering the necessary infrastructure facilities. Additionally, we sincerely thank DST-SERB, Government of India, for funding the current study. The study was funded by SERB-DST, Government of India (Grant Number: CRG/2018/000992).
CONFLICT OF INTEREST STATEMENT
The authors declare that they have no competing interests.
ETHICS STATEMENT
All the animal procurement and protocols were approved by the CPCSEA ethics committee of The MS University of Baroda, Vadodara (Protocol number – MSU-Z/IAEC-2/08-2018) and were in accordance with the ARRIVE guidelines 2.0.
Open Research
DATA AVAILABILITY STATEMENT
The Accession number of primers and antibodies used are available in the methods and supplementary section. All the datasets generated and analyzed during the current study are available from the corresponding author upon reasonable request.


