Are isoforms of capacitating Na+K+-ATPase localized to sperm head rafts?
Abstract
Capacitation begins in the sperm head plasma membrane (HPM). Membrane rafts could house signaling molecules, but although these specialized microdomains have been microscopically visualized in sperm heads, rafts have been isolated for study only from homogenized whole sperm or tails, never purified HPM. Sodium/potassium ATPase (Na+K+-ATPase) is a membrane-bound signaling protein that induces capacitation in bull sperm in response to the steroid hormone ouabain, and its subunit isoforms α1, α3, β1, β2, and β3 are known in HPM. This study hypothesized that rafts exist in the HPM of bull sperm, with Na+K+-ATPase subunit isoforms preferentially localized there. Western immunoblotting (WB) of HPM from fresh, uncapacitated bull sperm (n = 7 ejaculates), and detergent-resistant membranes isolated by density gradient centrifugation from this HPM, contained the raft-marker protein Flotillin-1; the non-raft fraction did not. HPM, raft, and non-raft contained all known Na+K+-ATPase isoforms including, for the first time, the previously unknown α2 isoform. Quantification (ImageQuant Software) found α3 and β1 were relatively dominant isoforms in the HPM raft. WB profiles of raft isoforms differed significantly from HPM and non-raft profiles, with unique banding patterns and amounts, hinting that the capacitation signaling in the now-identified HPM rafts may depend on unique sequences within the isoform structure.
Abbreviations
-
- HPM
-
- head plasma membrane
-
- MAPK
-
- mitogen-activated protein kinase
-
- Na+K+-ATPase
-
- sodium/potassium ATPase
-
- PI3K
-
- phosphatidylinositol 3-kinase
-
- PKA
-
- protein kinase A
-
- PKC
-
- protein kinase C
1 INTRODUCTION
After ejaculation, mammalian spermatozoa must undergo biochemical and physiological modifications in the female reproductive tract to acquire the ability to fertilize an oocyte. These functional changes, termed capacitation (Austin, 1952; Chang, 1951) start at the sperm head plasma membrane (HPM) which is remodeled by cholesterol efflux induced by components of the female reproductive tract (Davis, 1981; Visconti et al., 2002), leading to reorganization of membrane lipids and phospholipids, modified activity of transmembrane proteins, and increased plasma membrane fluidity (Gadella et al., 2008; Nicolson, 2014). These HPM structural modifications aid sperm-zona pellucida binding, acrosome reaction (AR), and membrane fusion during fertilization (Caballero et al., 2012).
Functionally, various signaling pathways are activated during mammalian sperm capacitation, including cAMP/protein kinase A, phospholipase C/PKC (Ickowicz et al., 2012; Rotfeld et al., 2014), phosphatidylinositol 3-kinase(PI3K)/Akt pathway (Aquila et al., 2004), and extracellular signal-regulated kinase 1/2 pathway (Awda & Buhr, 2010; Rajamanicham et al., 2017). These stimulate tyrosine phosphorylation (tyr-p) of sperm proteins (mouse: Visconti et al., 1995; cattle: Thundathil et al., 2006; pigs: Awda et al., 2009 and human: Battistone et al., 2014). We (Thundathil et al., 2006) reported a novel signaling pathway for bull sperm capacitation involving Na+K+-ATPase as a signal transducer in the presence of ouabain, which has since been confirmed (Newton et al., 2010). Ouabain is an endogenous cardiac glycoside that acts as an endogenous steroid hormone in mammals (Schoner & Scheiner-Bobis, 2007) and is present in nanomolar concentrations in bovine semen and vaginal fluids (Daniel et al., 2010). Na+K+-ATPase is a heterodimeric, amphipathic membrane protein present in many cell types, with two main polypeptide subunits, alpha (α), and beta (β). They each have multiple isoforms: α1, α2, α3, α4, β1, β2, and β3 (Geering, 2008). Na+K+-ATPase is concentrated in the HPM (Zhao & Buhr, 1996) and isoforms α1, α3, β1, β2, and β3 have been confirmed and quantified in bull sperm HPM (Hickey & Buhr, 2012). The α subunit contains the binding site for ouabain, which stimulates Na+K+-ATPase signaling (Kaplan, 2002), and the β subunit and its interaction with various α isoforms affects both ouabain-induced signaling (Pierre et al., 2008) and nonsignaling enzyme action (Hilbers et al., 2016). The exact role of β subunit on ouabain receptivity and response is not well defined and the existence of four α and three β isoforms in sperm suggests the possibility of occurrence of different combinations of these subunits forming different isozymes of Na+K+-ATPase.
In somatic cells including cardiac cells, signaling platforms involve specific membrane rafts which regulate various cellular functions. Rafts are discrete membrane domains formed by the aggregation of different lipids, mainly sphingomyelins and cholesterol, which are packed together along with various signaling proteins and glycosylated phosphatidylinositol (GPI) anchored proteins to form a liquid-ordered microdomain (Simons & Toomre, 2000; Simons & Sampaio, 2011). Rafts house various signaling molecules including Src family kinases, G proteins, MAPK, PKC, PLC, PI3K, and some enzymes like receptor tyrosine kinases including epidermal growth factor receptor and platelet-derived growth factor (Calder & Yaqoob, 2007; Chini & Parenti, 2004; Jahn et al., 2009; Simons & Toomre, 2000; Z. Xie & Cai, 2003). Rafts are heterogeneous (Simons & Sampaio, 2011), but certain molecules like GPI-linked protein CD59, the ganglioside GM1, and other proteins like flotillin-1, flotillin-2, and caveolin-1 are enriched in all kinds of rafts and have been used as raft markers (Cross, 2004). Colocalization of several signaling components into a raft enhances molecular interactions making signaling more efficient (Pike, 2006). Due to their structural characteristics, rafts are insoluble in nonionic detergents like Triton X-100 at low temperatures, enabling their isolation by density gradient floatation of homogenized cellular materials (Brown & Rose, 1992; Kawano et al., 2011).
Rafts have been identified and isolated from the spermatozoa of various mammalian species (mouse, guinea pig: Travis et al., 2001; human: Cross, 2004; boar: Khalil et al., 2006; bull: Post et al., 2010; ram: Colas et al., 2012), usually from homogenized whole sperm. Rafts are involved in mammalian sperm capacitation (Khalil et al., 2006), and have been observed to cluster at the apical HPM during capacitation simultaneously with the redistribution, localization, and association of different membrane proteins in zona recognition and AR (Boerke et al., 2014; Brewis & Gadella, 2009; Gadella et al., 2008; Mayorga et al., 2007; Tapia et al., 2012). Although the involvement of Na+K+-ATPase as a signaling molecule in sperm capacitation has been confirmed, the specific subunit isoforms of Na+K+-ATPase involved in capacitation are not yet clear. Since rafts are signaling platforms, ATPase isoforms that are uniquely characteristic of HPM raft domains would have a higher probability of involvement in capacitation-associated signaling. Therefore, we hypothesized that rafts exist in the HPM of bull sperm, and that these HPM rafts contain some ATPase isoforms with distinctive localization and/or features.
2 RESULTS
On arrival, the extended ejaculates had average motility of 80 ± 7.55% (mean ± SE). After washing to remove the extender and 3 h at 37°C, motility declined to 63 ± 9.0%; viability was 73 ± 11.6%. Preliminary experiments (n = 5) confirmed HPM contained all ATPase isoforms with similar molecular weight (MW) banding profiles (data not shown) as typical of fresh ejaculates (Hickey & Buhr, 2012).
2.1 Optical density and protein distribution in the sucrose density gradient
Overall, protein concentration in the sucrose density gradient used for raft isolation increased from the less-dense to more-dense of the six fractions (Figure 1a); the pellet frequently found below fraction 6 was discarded. The fourth fraction had the highest light scattering intensity (p < 0.05; Figure 1b) and was considered the raft fraction. Fractions 1–3 and 6 were combined as “non-raft.” The raft and non-raft fractions contained 2.9% and 35.9%, respectively, of the total HPM protein initially loaded on the gradient. The relative amount of raft and non-raft in the discarded pellet is unknown.

2.2 Western blotting and mass spectrometry
The sensitivity of the primary antibody for each isoform was confirmed by detecting positive signal at the described MW in the manufacturer's positive control in every gel that also aligned with an HPM band, and the complete absence of positive signal in membranes incubated with secondary antibody without primary antibody. The density of alpha-tubulin confirmed the amount of protein loaded into the wells of sodium dodecyl sulfate (SDS) gels but not for raft immunoblots, as tubulin is differentially distributed between raft and non-raft fractions (Wolff, 2009). Aliquots of a pooled bovine kidney preparation were included in every gel as an intergel standard.
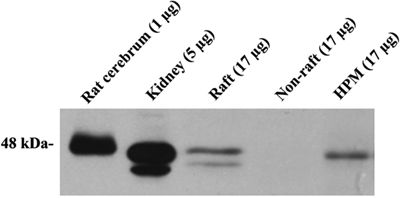
Immunoblots of the HPM and raft, but not the non-raft, fractions were positive for the specific raft marker flotillin-1 (45686 ± 25957; 48747 ± 9903; 0 ± 0; pixel/mg protein in HPM, raft, and non-raft, respectively; n = 7; Figure 2). The raft marker proteins caveolin-1 and flotillin-2 were not detectable in HPM, raft, or non-raft fractions (n = 2).
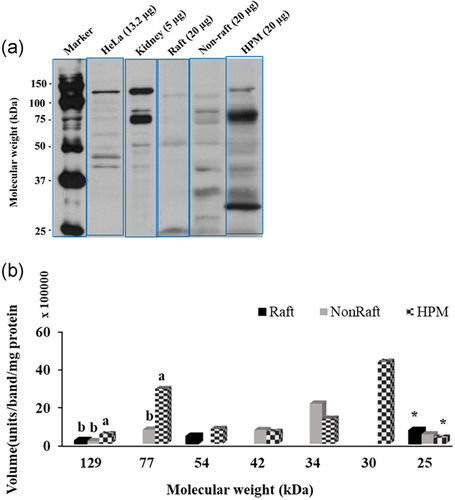
The isoform α2 was detected in bull sperm HPM for the first time. The WB detected seven α2 bands in the HPM (MW range 129 ± 2.3 to 25 ± 0.7 kDa, mean ± SE; Figure 3), of which only three appeared in the raft fraction (129, 54, and 25 kDa). Figure 3b shows the actual amount (volume) of each band; relative to total isoform, each of these three α2 bands was significantly enriched in the raft fraction, being much more concentrated there than in the HPM (for 129 kDa, 15 ± 5.6% of all raft α2 > 5 ± 0.9% of HPM α2; for 54 kDa, 36 ± 13.2% of raft α2 > 7 ± 2.4% of HPM α2; for 25 kDa, 63 ± 18.3% raft α2 > 3 ± 0.9% HPM α2; all p < 0.05).
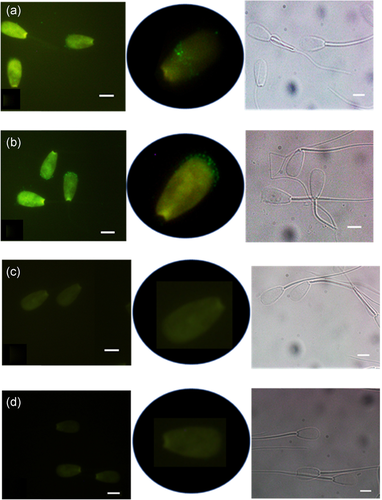
The presence of Na+K+-ATPase α2 on bull sperm was also confirmed by immunofluorescent labeling of sperm with the same specific monoclonal anti-α2, resulting in fluorescence on the sperm head of both intact and permeabilized cells; the sperm tail showed no fluorescence (Figure 4a,b). Intact cells showed uneven patches of α2 fluorescence on the acrosome as well as on the equatorial segment while the permeabilized cells showed more intense patchy fluorescence mainly on the apical acrosome (higher magnification images, Figure 4a,b). Neither intact nor permeabilized sperm incubated with secondary antibody alone (control) fluoresced (Figure 4c,d) confirming the specificity of the antibodies. White field imaging ensured that all sperm and their morphology were assessed (Figure 4a–d).
The α2 detected in western blotting and immunofluorescent labeling was also identified by LC-MS/MS. Aligning the data to both Swiss Prot and the custom database using sequences from NCBInr identified multiple peptides of α2 (at 113.50 kDa) with a percentage coverage (percentage of peptides identified compared to the total sequence of the entire protein) of 8.6 and 42.1, respectively, for the databases. The Swiss Prot database detected six peptide sequences ranging in length from 6 to 13 amino acids and the NCBInr identified five of those same sequence and four additional sequences as characteristics of α2.
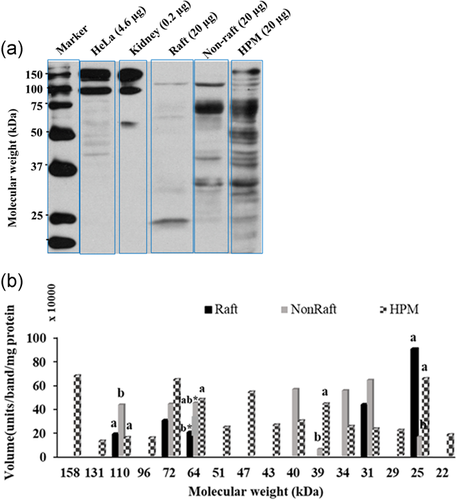
Western blotting detected 16 α1 bands in HPM (MW range 158 ± 2.0 to 22 ± 0.5 kDa), with raft fraction having only five of these and non-raft fraction eight (Figure 5a,b). Relative to total isoform, three of these five raft bands were significantly enriched in the raft fraction compared to HPM (for 110 kDa, 22 ± 7.1% raft α1 > 4 ± 1.1% of HPM; for 72 kDa 28 ± 13.2% raft α1 > 17 ± 4.6% HPM; for 25 kDa, 61 ± 21.5% of raft α1 > 11 ± 3.6% of HPM: p < 0.05).
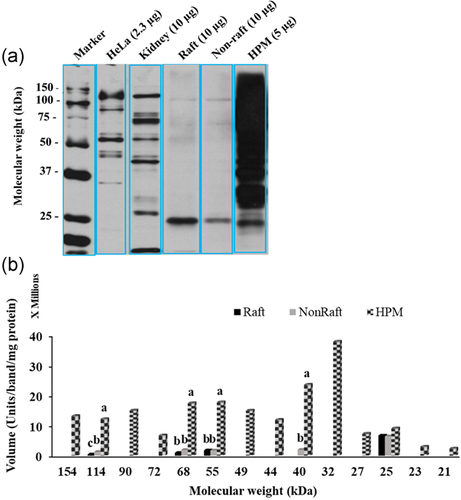
Of the 14 α3 bands present in the HPM (MW range 154 ± 4.0 to 21 ± 0.6 kDa), raft fraction had four and the non-raft fraction five (Figure 6a,b). Both raft and non-raft fractions had bands at 114, 68, 55, and 25 kDa. Compared to total isoform, the 25 kDa band was significantly enriched in the raft fraction compared to the HPM (84 ± 19.3% of raft α3 > 5 ± 1.1% of HPM α3, p < 0.05); all other bands contributed equally to their membrane.
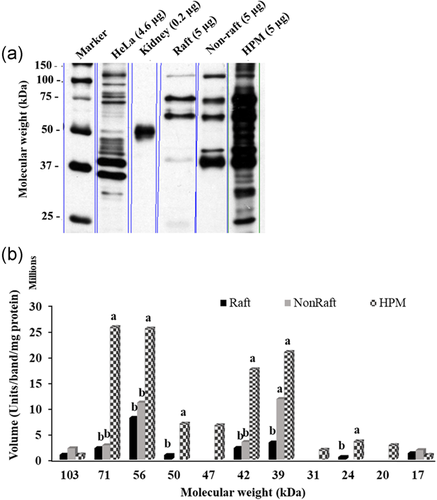
The raft fraction showed eight of the 11 β1 bands present in the HPM (MW range 103 ± 1.84 to 17 ± 0.33 kDa; Figure 7a,b) and had significantly less of the 50 and 24 kDa bands than HPM (p < 0.05). Relative to total isoform, the 56 kDa band was more prominent in the raft fraction than in the HPM (60 ± 14.7% > 21 ± 6.7%; raft > HPM, p < 0.05), while other bands at 71, 50, 42, 39, and 24 kDa were present in equal proportions in both raft fraction and HPM.
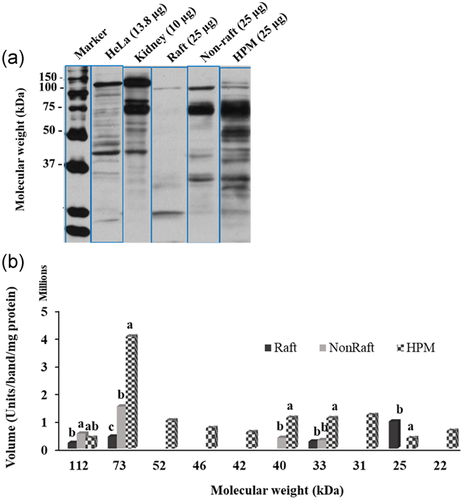
There were 10 β2 bands present in the HPM (MW range 112 ± 1.1 to 22 ± 1.1 kDa); raft had four of those bands (Figure 8a,b). The 25 kDa HPM bands were detected only on the raft fraction and HPM but was highly concentrated and enriched in the raft fraction compared to the HPM (60 ± 13.6% > 3 ± 0.8%; respectively, of all β2 present, raft > HPM, p < 0.05).
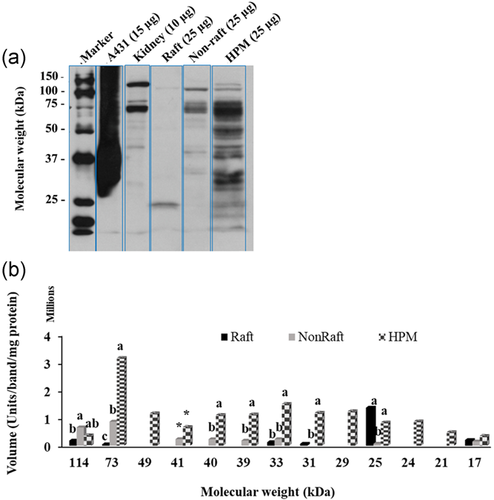
Of the 13 β3 bands present in the HPM (MW range 114 ± 0.9 to 17 ± 0.2 kDa), the raft fraction had six (Figure 9). The 31 kDa band was unique to the HPM and raft fraction but made up a smaller percentage of all the β3 present in the raft fraction than HPM (9 ± 2.3% > 3 ± 1.2%; HPM > raft, p < 0.05). The 25 kDa band was highly significantly enriched in the raft fraction compared to the HPM (71 ± 18.6% of raft β3 > 6 ± 1.6% of HPM; p < 0.05) as was the more minor 114 kDa band (8 ± 2.3% of raft β3 > 3 ± 0.7% of HPM β3, p < 0.05). In contrast, the 73 kDa bands was less prominent in the raft fraction than in the HPM (3 ± 1.1% of raft β3 < 24 ± 6.8% of HPM, p < 0.05).
To know how much of each isoform in the HPM was actually located on the raft and non-raft fractions, we calculated the total amount of each isoform in each of the isolated HPM, raft, and non-raft fractions (total vol/µg protein for each fraction × total protein in each fraction; Figure 10). Considering the total amount of ATPase from all isoforms, raft fraction had significantly less total Na+K+-ATPase than in the HPM (p < 0.05). The absolute amount of the various isoforms did sometimes differ within a fraction (Figure 10) but comparing the relative amount each isoform contributed to the total ATPase content of a particular fraction detected interesting unique features of rafts. The Na+K+-ATPase in rafts consisted of more β1 than α3, both of which were predominant over the other isoforms, which nonetheless differed in their contribution to the total ATPase (β1 = 44% > α3 = 24% > β2 = 11% > β3 = 9% > α2 = 7% > α1 = 5% of total Na+K+-ATPase in raft, p < 0.05). In the HPM, the relative amounts were reversed, with more α3 than β1 and the other ATPase isoforms present in similar, minor amounts (α3 = 48% > β1 = 32% > β2/β3/α2 = 6% > α1 = 2% of total ATPase in HPM; p < 0.05).
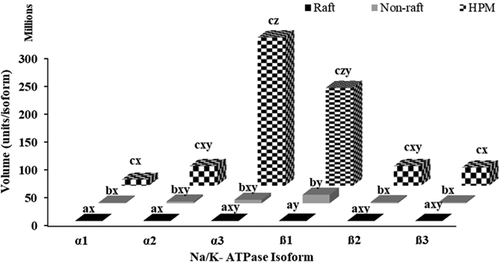
3 DISCUSSION
Rafts isolated here for the first time from the plasma membranes of the head of bovine sperm contain the various α and β isoforms of Na+K+-ATPase, with unique structural profiles. This includes the α2 isoform, which has not previously been demonstrated in bovine sperm HPM. The significant roles Na+K+-ATPase plays in capacitation make its presence and possible intermolecular interactions important to understand.
When the transmembrane receptor Na+K+-ATPase is activated by the steroid hormone ouabain, it induces protein tyr-p and capacitation in bull sperm (Sajeevadathan et al., 2019; Thundathil et al., 2006). Rafts, which are liquid-ordered domains in the plasma membrane, frequently serve as platforms for signaling molecules initiating intracellular tyr-p and other signaling pathways. The existence of rafts in sperm HPM containing Na+K+-ATPase isoforms suggests that this signaling could occur through these membrane platforms.
Rafts were separated as the opalescent layer on the low-density fractions of the density gradient, which had higher optical density (light scattering as a measure of solubilization) than the other fractions, consistent with other raft isolations (Khalil et al., 2006). Raft identity was also confirmed by using western blotting to seek marker proteins uniquely characteristic of rafts in other cell membranes. Flotillin-1, a known raft marker protein on bovine (Post et al., 2010), murine (Miranda et al., 2009), and porcine sperm (Boerke et al., 2014; Van Gestel et al., 2005) was present in the HPM and raft fractions, but not non-raft (Figure 2). Visually, flotillin-1 is primarily concentrated in the equatorial and post-acrosomal regions of the bovine sperm head (Post et al., 2010) and so would be expected to be detected in the isolated HPM. Other raft marker proteins flotillin-2 and Caveolin-1 could not be detected in the raft fraction or HPM even though Caveolin-1 has been reported in whole bovine sperm (Post et al., 2010; Rajamanicham et al., 2017). Caveolin-1 is limited to the postequatorial region of bovine sperm heads and prominent in the midpiece of bull sperm (Post et al., 2010), explaining its detection in rafts isolated from whole sperm and its exclusion from our highly purified HPM (Zhao & Buhr, 1996). The combined physical characteristics of detergent insolubility, low density, and the exclusive presence of the marker protein flotillin-1 all support that this fraction was indeed rafts native to the HPM.
To focus on signaling initiating capacitation, rafts were isolated from the purified HPM, not whole sperm as have been used in other studies (Khalil et al., 2006; Rajamanicham et al., 2017). Whole sperm could yield rafts from membranes of the principal piece, mitochondria, nucleus, and acrosome. To permit rigorous valid quantification and assessment of raft composition, HPM was obtained individually from each of multiple ejaculates, and all evident bands from western immunoblots of all isoforms were identified and statistically compared. Ejaculates were ≤36 h old and in a liquid extender, and preliminary studies confirmed their HPM contained similar Na+K+-ATPase bands as previously seen from fresh unextended ejaculates (Hickey & Buhr, 2012), indicating that the extender did not change the bull sperm Na+K+-ATPase profile. Each isoform's bands were confirmed to align with the manufacturer's own antibody control. Antibody specificity indicates that the multiple bands identified for each isoform, each contain the unique antigenic sequence recognized by the antibody, with the different molecular masses reflecting modifications such as glycosylation (Hickey & Buhr, 2012; Tokhtaeva et al., 2012), deglycosylation, dimerization with other proteins, or degradation that could be pertinent to signaling function. For most isoforms, the HPM contained 1–3 MW bands not detected in either the rafts or non-raft fractions. These missing bands might reflect peptides preferentially partitioning into the pellet of the sucrose density gradient which was discarded, or since they were typically only a small fraction of the HPM may have not been present in sufficient quantity to be concentrated in the Amicon filters. Most likely, their MW could have been altered by deglycosylation, delipidation, or solubilization during the lengthy exposure to Triton X-100 in the raft isolation process. The multiple bands of Na/K-ATPase are consistent with ours and others' observations (Dash et al., 2018; Thundathil et al., 2006), which Lind et al. (2013) suggested could reflect alternative splicing of Na/K-ATPase and the presence of multiple genes for differential expression. The amount of every band in the HPM, raft, and non-raft fractions obtained from the multiple replicate ejaculates was carefully calculated after first correcting the intensity of each band measured by densitometry against the intensity and protein content of the standardized biological kidney control included in each gel (Hickey & Buhr, 2012) to increase accuracy in the statistical analysis.
In the present study, we detected all α isoforms (α1, α2, and α3) in the HPM raft fraction, with α3 present in the largest quantity (67% of all raft α) followed by α2 and α1 (20% and 13%, respectively). The binding of ouabain to its binding site on α induces signaling (Kaplan, 2002), but the pathways activated by different α isoforms differ. In rat cardiac cells and porcine renal cells, α1 acts through tyrosine kinase Src that subsequently activates different signaling pathways including the Ras/Raf/ERK1/2 (Pierre et al., 2008; Tian et al., 2006) while in a mammalian cell line LM-α3-1, α3 acts through Src-independent pathways involving PI3K and PKC (Madan et al., 2017). Downstream signaling molecules of both these pathways are known in bull sperm (Daniel et al., 2010; Etkovitz et al., 2009; Newton et al., 2010; Rajamanicham et al., 2017; Rotfeld et al., 2014). In cultured insect cells and renal cells, α2 does not induce signaling (Pierre et al., 2008; Xie et al., 2015), but its presence here warrants further evaluation of its role in signaling in germ cells.
Signaling is also affected by ouabain binding affinity. Significantly lower concentrations of ouabain are needed to activate signaling with α3 than α1 in insect cells (Pierre et al., 2008), which may be important given the nanomolar endogenous concentrations of ouabain in the female reproductive tract (Daniel et al., 2010). The greater amount of α3 in raft fractions, and its known high affinity for ouabain suggests that α3 may be the most likely candidate for the capacitation signal inducer in bull sperm, but none can yet be eliminated as potential stimulators of capacitation.
We also detected all the β isoforms (β1, β2, and β3) in the raft fractions of bull sperm HPM. Among different β isoforms in raft fraction, β1 was the most prominent (69% of all raft β), followed by β2 and β3 (16% and 15%, respectively, of all raft β). For the Na+K+-ATPase to function as a signal transducer, the α subunit should be paired with the β subunit (Liu & Askari, 2006) and among β isoforms, the β1 is widely accepted as the signaling partner with α1/α3 in ouabain mediated signaling in cardiac, renal, and neuronal cells (Guerrero et al., 2001; Pierre et al., 2008). In addition to supporting α for proper ATPase function, β especially β1 plays a major role in cell adhesion (Vagin et al., 2012). Since the rafts on sperm play an important role in the membrane fusion of egg and sperm during fertilization (Gadella & Boerke, 2016; Reid et al., 2011), the β Na+K+-ATPase isoforms, and specifically β1, could play a dual role in oocyte binding and sperm capacitation. Alternatively, β1 could be involved in adhesion and other β isoforms could be in the signaling dimers. However, the engagement of β1 in both signaling and cell adhesion would explain its more prominent presence than the other β isoforms. In summary, α3 and β1 are the predominant Na+K+-ATPase isoforms in the rafts of bull sperm HPM and are likely candidate isoforms for ouabain-induced signaling stimulating capacitation.
Raft is a minor component of the epithelial cell plasma membrane (García-Marcos et al., 2006; Simons & Toomre, 2000), and the sperm HPM raft fractions constituted only 2.9% of the total HPM protein. There was significantly less total Na+K+-ATPase in the raft plus non-raft fractions than in the total HPM (Figure 10). This paralleled the loss of all HPM protein, as only 38.8% of the HPM protein was isolated as raft and non-raft proteins (2.9% as raft protein and 35.9% as non-raft protein). Most would have been lost in discarding the pellet which was always present after ultracentrifugation of HPM lysate during raft and non-raft separation, and some could have been lost during concentration of raft and non-raft proteins with Amicon® Ultra centrifugal filters.
No one isoform was restricted to the raft fractions or more concentrated in the raft fractions than another isoform (p > 0.05) and each of the isoforms in the raft fractions constituted <1% of their total HPM content. Similarly, rafts isolated from renal endosomes had less than 12% of the microsomes' total ATPase content (Liu et al., 2011). But the relative prominence of certain Na+K+-ATPase bands was significantly higher in the raft fraction than in the non-raft or HPM (i.e., were more enriched in raft) which could be an indirect indicator of differences in function of the proteins in these bands. Since we know that the rafts are involved in signaling, enrichment of certain bands in the raft fraction might suggest the involvement of their protein(s) in raft-specific functions such as signaling, or other Na/K-ATPase functions like ion transport or energy metabolism. Our non-raft (soluble) fraction also contains all types of the Na+K+-ATPase isoforms but in lesser quantity than their total HPM content, and both raft and non-raft fractions isolated from whole sperm also contained Na+K+-ATPase isoforms as well as downstream signaling molecules (Rajamanicham et al., 2017).
Taken together, these findings clearly support the conclusion that no one Na+K+-ATPase isoform is exclusively found in sperm HPM raft fractions, and that the signaling pool of ATPase could be dispersed throughout the head membrane. However, rafts did contain a limited, occasionally unique, specialized subset of bands for every isoform. These bands that preferentially located in rafts were from major and minor HPM bands, and the selective raft localization opens the possibility that a specialized subset of ATPase isoform proteins preferentially concentrates in rafts. Our sperm HPM was isolated from fresh, uncapacitated sperm and it is possible that capacitation would induce sequestration of specific isoforms into the rafts, although this study could not test that. Two full bovine ejaculates were required to provide sufficient HPM for analysis and subsequent raft purification, and these physical limitations prevented preparation and analysis of raft HPM from capacitated sperm.
In summary, rafts are present on the HPM of bull sperm. Although none of the different isoforms of Na+K+-ATPase were unique to raft fraction, the isoforms localized in the raft fraction have unique profiles and concentrations in membrane and their presence in raft domains indicates possible involvement of these isoforms in signaling or egg-sperm interaction. Since Na+K+-ATPase-ouabain interaction is critical for inducing capacitation, knowing the exact profile of this protein may lead to a better understanding of the mechanism of fertilization, and ultimately improve reproduction in domestic food animals.
4 MATERIALS AND METHODS
4.1 Chemicals and antibodies
The following reagents were acquired from Thermo Fisher Scientific: albumin standards, dextrose, dimethyl sulfoxide, disodium hydrogen phosphate anhydrous (Na2HPO4), disodium hydrogen phosphate monohydrate (Na2HPO4.H2O), glycine, hydrogen peroxide 30%, methanol HPLC grade, polyethylene glycol (PEG 8000), sodium azide, SDS, sucrose, and tween 20. The following reagents were purchased from Bio-Rad Laboratories, Ltd.; 30% acrylamide/bis solution 29:1, N, N, N', N'-tetramethylethylene-diamine (TEMED), ammonium persulfate, precision plus protein Western C standards (detect bands ranging from 10 to 250 kDa), protein assay dye reagent concentrate, triton X-100, and precision plus streptactin-horseradish peroxidase (HRP) conjugate. Complete mini protease inhibitor mini cocktail tablets (EDTA free) were from Roche Diagnostics, percoll from GE Healthcare, and live: dead sperm viability kit from Molecular Probes, Inc. Immobiline-P PVDF transfer membrane (pore size 0.45 µm) was purchased from Millipore Canada, Ltd. The bromophenol blue, dextran, dithiothreitol (DTT), ethylenediaminetetraacetic acid (EDTA), glycerol, 4-(2-Hydroxyethyl) piperazine-1-ethanesulfonic acid, N-(2-Hydroxyethyl) piperazine-N′-(2-ethanesulfonic acid) (HEPES), luminol, magnesium chloride (MgCl2·6 H20), N-α-p-tosyl-l-lysinechloromethyl ketone (TLCK), p-coumaric acid, pepstatin-A, phenylmethanesulfonyl fluoride (PMSF), potassium chloride (KCl), sodium chloride (NaCl), tris-HCl, trizma base, trizma hydrochloride, Carestream® Kodak® autoradiography GBX developer/replenisher, Carestream® Kodak® autoradiography GBX fixer and replenisher, Carestream® Kodak® X-Omat LS film were purchased from Sigma-Aldrich, Canada Ltd. For protein identification, A431 cell lysate (positive control for β3), anti-Na/K-ATPase β3 (mouse monoclonal; Clone 46), anti-caveolin-1 (mouse monoclonal; Clone 2297), anti-flotillin-1 (mouse monoclonal; Clone 18), anti-flotillin-2 (mouse monoclonal; Clone 29), human endothelial cell lysate (positive control for flotillin-2 and caveolin-1), and rat cerebrum lysate (positive control for flotillin-1) were obtained from BD Bio-Sciences, anti-Na+K+-ATPase β2 (mouse monoclonal IgG2a; ab76509) was from Abcam, Inc., anti-Na+K+-ATPase α3 (mouse monoclonal IgG1; clone XVIF-G10) and HeLa cell lysate (positive control for α1, α2, α3, β1, and β2) were purchased from Enzo Life Science, anti-Na+K+-ATPase β1 (mouse monoclonal IgG2AK; clone C464.8), anti- Na+K+-ATPase α1 (mouse monoclonal; IgG1K; clone C464.6), anti-Na+K+-ATPase α2 (rabbit monoclonal IgG2AK; clone C464.8), goat anti-mouse IgG-HRP conjugate (polyclonal), and goat anti-rabbit IgG-HRP conjugate (polyclonal) were purchased from EMD Millipore Corporation.
4.2 Semen collection and evaluation
All procedures met the requirements of the University of Saskatchewan ethics and animal care requirements (Animal Use Protocol number: 20140082). Ejaculates were collected from mature Holstein bulls (n = 20) using live teasers at Semex and volume, motility, and concentration determined as for commercial processing. Ejaculates with average motility of 85 ± 8.15% were then diluted with egg yolk free “Clear extender” (proprietary composition, Semex) to a concentration of 60 million/ml and transported at 18°C to the laboratory within 24 h. The extender is designed to slow down the progressive motility of the sperm to allow it to be viable for up to 1 week at 18°C. The extended ejaculates after reaching the laboratory were warmed to room temperature (45–60 min), assessed for motility and a small aliquot of this ejaculate was diluted to 1 × 10⁷ spermatozoa per ml of phosphate-buffered saline (PBS: 125 mM NaCI, 8 mM Na2HPO4, 2 mM NaH2PO4.H2O, 5 mM KCI, and 5 mM dextrose; pH adjusted to 7.4) for assessing the viability of the sperm. Motility was assessed with a Hamilton-Thorne motility analyzer (Version 14 HTM-IVOS) using a prewarmed 20 µm deep Leja standard count four-chamber slide (Leja products B.V., Luzernestraat 10, 2153 GN Nieuw-Vennep) at 37°C. The analytical setup of motility analyzer was: frame rate, 60 Hz; frames acquired, 10 Hz; minimum contrast, 80 pixels; minimum cell size, 5 pixels; threshold straightness, 70%; medium average path velocity (VAP) cutoff, 50 µ/s; low VAP cutoff, 30 µ/s; static size limits, 0.49–4.86 pixels; static intensity limits, 0.6–2.16 pixels; static elongation limits, 8%–68%; nonmotile head size, 10 pixels; and nonmotile head intensity, 101. Viability of the diluted sperm was assessed with Sybr-14/Propidium Iodide (PI) staining (Awda et al., 2009), counting 2 × 100 spermatozoa as live (green) or dead (red) cells using a fluorescent microscope (Laborlux S) fitted with a blue filter (450–490 nm) under ×40 objective. Ejaculates were discarded if they had less than 50% viable sperm on arrival at the laboratory.
4.3 HPM isolation
All steps were performed at room temperature unless specified otherwise. Ejaculates from two bulls were pooled to isolate sufficient HPM for one replicate. After warming the pooled ejaculate, the extender was removed by centrifugation (800g, 10 min) and the pellet was washed in PBS (800g, 10 min). The final pellet was diluted with PBS (1:4 volume:volume [vol:vol]) and the HPM was isolated as before (Hickey & Buhr, 2012). Briefly, the diluted semen was washed with 35% percoll (1:2 semen:percoll, vol/vol) and the percoll was removed from the pellet by dilution in PBS and centrifugation (800g; 10 min; three times). The final pellets were resuspended in PBS and subjected to nitrogen cavitation (Parr Cell Disruption unit, 650 psi, 10 min). The extruded solution (cavitate) was centrifuged (800g; 10 min), the supernatant was collected and was layered onto phase partition tubes (3.94 g 20% dextran, 1.97 g 40% PEG, 0.19 g PBS, 2.42 g 1.5 M sucrose). These tubes were mixed, centrifuged (800g; 10 min, twice), and the top portions harvested. The top layer was washed with PBS (206,000g, 20 min, 5°C; twice). The final pellet, which was the HPM, was harvested with TNE buffer (10 mM Tris- HCl, 0.15 M NaCl, 5 mM EDTA), the protein concentration measured (Bio-Rad protein assay) and aliquoted into two tubes. One aliquot of the purified HPM was snap-frozen in liquid nitrogen and stored (-80°C) for western blotting within 3 days, the remainder was used for raft isolation.
4.4 Isolation of raft and non-raft fractions
Raft and non-raft fractions were obtained from the HPM by the method of Khalil et al. (2006). A total of 20 different bulls provided ejaculates for the 16 HPM/raft preparations; each preparation contained semen from a different pair of bulls, although two bulls each provided three ejaculates and eight bulls each provided two. The purified HPM was lysed by gentle stirring for 1 h in ice-cold lysis buffer (TNE, 1% vol:vol Triton X-100, 0.2 mM TLCK (N-α-p-tosyl-l-lysine chloromethyl ketone); total buffer volume had 3:1 Triton-X: HPM wt:wt). The lysate was then mixed with an equal volume of 85% (wt/vol) sucrose in TNE (final sucrose concentration 42.5%) sucrose, and 1 ml was transferred into an ultracentrifuge tube (Polypropylene Quick-seal tubes) and overlaid with 3 ml of 30% and 1.75 ml 5% sucrose in TNE for centrifugation (200,000g, 18 h, 4°C) in a swinging bucket rotor (SW 41 Ti). After centrifugation, 1 ml fractions were collected from top to bottom and the pellet at the bottom was discarded. These isolated 1 ml fractions were assessed for protein concentration (Bio-Rad protein assay) as well as their absorbance at A400 using a spectrophotometer. The fraction with high light scattering intensity was considered as the raft fraction; all other fractions were pooled together and considered as the non-raft fraction. Both raft and non-raft fractions were concentrated separately using Amicon® Ultra centrifugal filters (3800g, 4°C, 2 h for non-raft and 8–10 h for raft; the concentrated non-raft fraction was kept at 4°C until raft concentration was completed). The concentrated fractions were snap-frozen in liquid nitrogen and stored at -80°C for use on the next day for western blotting.
4.5 Western blotting
The ideal antibody concentration and protein load to optimize visible band intensity of Na+K+-ATPase isoforms in all fractions (raft, non-raft, HPM) were selected based on Hickey and Buhr (2012). A preliminary study (n = 5) confirmed the presence of different subunit isoforms of Na+K+-ATPase in bull sperm HPM by SDS-polyacrylamide gel electrophoresis (SDS-PAGE) and immunoblotting as before (Hickey & Buhr, 2012). SDS-PAGE and immunoblotting then analyzed equal amounts of raft, non-raft, and HPM fractions first for raft marker proteins (Cross, 2004) caveolin-1 (n = 2), flotillin-1 (n = 7), and flotillin-2 (n = 2), and then for α1, α2, α3, β1, β2, and β3 Na/K-ATPase isoforms (α1, β1, β3: n = 7; β2: n = 6; α2, α3: n = 5). Briefly, proteins in each fraction (raft, non-raft, and HPM) and an aliquot from a matched pool of aliquots of bovine kidney membrane fraction as an internal intergel control (Hickey & Buhr, 2012) were solubilized by boiling in sample buffer. Electrophoresis (100 V, 1.15 h) used 10% polyacrylamide running gels for detecting all proteins except caveolin-1, which used 12% gel. An appropriate manufacturer's positive control for each desired protein was also run on each gel (A431 cell lysate for β3; human endothelial cell lysate for flotillin-2 and caveolin-1; rat cerebrum lysate for flotillin-1 and HeLa cell lysate for α1, α2, α3, β1, and β2). After electrophoresis, the protein bands were electrotransferred to Immobiline-P PVDF membranes (pore size 0.45 µm) in tris/glycine buffer (250 mM Tris, 1.92 M glycine), and 20% methanol. After blocking nonspecific binding sites with 5% (wt/vol) skim milk blocking buffer for 1 h, membranes were immunoblotted overnight (4°C) with the appropriate antibodies diluted in TTBS: anti-flotillin-1 (1:250 antigen [µl]:TTBS (µl]), anti-flotillin-2 (1:5000), anti-caveolin-1 (1:100), and Na/K-ATPase α1 (1:2500), α2 (1:15,000), α3 (1:3500), β1(1: 1000), β2 (1:1000), and β3 (1:250). Membranes were then washed in TTBS and then incubated for 1 h at room temperature with goat, anti-mouse IgG HRP conjugate (1:2500 in TTBS) except for α2, which was incubated with goat, anti-rabbit IgG HRP conjugate (1:15,000 in TTBS). Protein bands were detected with chemiluminescence (incubating PVDF membrane with 68 mM p-coumaric acid, 1.25 mM luminol, and 3% hydrogen peroxide for 2 min), and images were developed using Carestream® Kodak® X-OMAT LS Film (Carestream Health, Inc.) according to the manufacturer's description. The sensitivity of the primary antibody for each isoform was tested by the inclusion of the manufacturer's positive control in every gel, and also by incubating the membranes with secondary antibody in absence of primary antibody. The use of strep-tactin greatly improved the clarity of the Precision Plus ProteinTM standards, but produced three bands (125, 81, and 71 kDa) in the bovine kidney intergel standard that were absent when no strep-tactin was added. These strep-tactin-dependent bands were therefore considered artifacts and excluded from all further analyses.
The positive bands were analyzed using ImageQuant TL 8.1 Software (GE Healthcare) for area (number of pixels in a given selection), volume (sum of the pixel intensity for all pixels in a given selection), and MW as before (Hickey & Buhr, 2012; Thundathil et al., 2006). Amount of each MW band (vol/mg protein loaded onto the gel) was corrected for gel variation using the intergel controls. The total amount of each isoform in each fraction was calculated by summing the corrected band volume per mg protein. The percentage of each band within an isoform for each of the raft, non-raft, and HPM fractions was calculated by dividing the volume of each band by the total volume of that isoform within the fraction.
4.6 Immunofluorescence
Localization of Na+K+-ATPase α2 isoform on the HPM of bull sperm was confirmed by immunofluorescence (n = 3; Hickey & Buhr, 2012). Of the replicate samples used, two were pooled fresh ejaculates (extended) from two bulls each and the third was frozen semen. All steps were conducted at room temperature unless otherwise specified. For fresh extended ejaculate, initially, the extender was removed by centrifugation (800g, 10 min) followed by washing the sperm pellets in PBS by centrifugation (500g, 5 min). The spermatozoa in the frozen straw were washed with PBS by centrifugation (500g, 5 min). The spermatozoa in the final pellet were fixed by 1% formaldehyde (vol:vol in PBS) and attached to poly-l-lysine-coated slides (1 mg/ml poly-l-lysine in PBS) by settling for 60 min at 4°C. Spermatozoa on the slides after washing (2 × 5 min in PBS) were either allowed to remain intact or permeabilized with methanol (-20°C, 30 s) and washed again (2 × 5 min in PBS). Cells were then blocked by incubating in PBS containing 10% (vol:vol) normal goat serum (10% NGS; 30 min, 37°C) followed by incubation with anti- Na+K+-ATPase α2 primary antibodies (1:100, µl: µl) in 10% NGS; 60 min, 37°C). After washing the slides (2 × 5 min in 10% NGS), spermatozoa were incubated with FITC-conjugated goat anti-rabbit IgG (1:50 in 10% NGS; 60 min, 37°C) followed by a final wash (2 × 5 min in 10% NGS). For control, instead of primary antibody, spermatozoa were incubated in 10% NGS followed by goat anti-rabbit IgG. A drop of antifade (0.1% P-phenylene di-amine and 90% glycerol in PBS) was placed over the spermatozoa, coverslips mounted, and cells were immediately observed under a fluorescent microscope at FITC wavelengths (495–519 nm; Laborlux S).
4.7 Mass spectrometry for α2
Mass spectrometry for detecting the α2 isoform in isolated HPM samples was done at Canadian Centre for Health and Safety in Agriculture (CCHSA) mass spectrometry laboratory (Core Mass Spectrometry Facility, University of Saskatchewan). HPM proteins were denatured with trifluoroethanol, digested with trypsin, and the generated peptides were analyzed by liquid chromatography/tandem mass spectrometry (LC-MS/MS; Zhang et al., 2011). The MS/MS spectra were acquired with a 6550 iFunnel quadrupole time-of-flight mass spectrometer (Agilent Technologies) and processed with Agilent MassHunter BioConfirm (B.06.00). Resulting data were searched against the sequence databases Swiss prot (contain bovine fasta sequence) and a custom database containing all the ATPase isoforms across many species that was prepared by gathering sequences from NCBI nonredundant protein databases (NCBInr) to identify proteins. Peptide identification was determined using a 0.3 Da fragment mass error and a parent mass error of 10 ppm assuming full tryptic specificity with up to one missed cleavage. The false discovery rate threshold was set to 5% for the protein matches.
4.8 Statistical analysis
Since the band volume and band percentage data had a lognormal distribution, statistical analysis was conducted on the logarithmic transformed data using a Mixed Model procedure (SAS; version 9.4; SAS Institute, Inc.), comparing band volume or band percentage of each protein among different fractions (HPM, raft, and non-raft) using preplanned contrasts. Comparing the amount of any one isoform across fractions is valid as we are using the same antibody at the identical concentration for detecting bands in each fraction. Significance and trends are reported at p ≤ 0.05 and 0.05 < p < 0.10, respectively.
ACKNOWLEDGMENTS
This study was supported by NSERC RGPIN 105823/2013. The authors would like to thank the Natural Sciences and Engineering Research Council of Canada (NSERC) for funding this project, and SEMEX (Guelph, ON, Canada) for providing semen for the experiment. They would also like to thank Dr George Katselis at CCHSA for expert advice on mass spectrometric analysis.
CONFLICT OF INTERESTS
The authors declare that there are no conflict of interests.


