Beam characterization of a custom, handheld focused ultrasound system using thermochromic liquid crystal films
Abstract
Focused Ultrasound (FUS) continues to gain acceptance in the clinical realm for its ability to provide effective, non-invasive therapeutic treatments to almost any region of the body for a host of ablative and non-ablative applications. The development of FUS devices and their implementation requires reliable characterization and quality assurance methods to verify acoustic pressure fields and focal region characteristics. The use of hydrophones is a conventional technique for mapping the acoustic field in 3 dimensions to provide focal dimensions and location. Hydrophones, however, are expensive and may be damaged even at relatively low acoustic amplitudes. Data collection with these devices can also be labor intensive and difficult to accurately reproduce. We present preliminary findings for the development of an alternative characterization process for FUS transducers that is relatively inexpensive and time efficient. Thermochromic liquid crystal (TLC) film sensors exploit the thermochromic effect, in which exposure to specific temperature changes cause a visible change in colour. The method was tested on a portable FUS system developed in-house for FUS-based therapeutic applications, comprised of a 3.57 MHz FUS transducer, and a custom-fabricated coupling cone. The results demonstrated that this method using TLC films was able to accurately provide dimensions of the focal zone and its position relative to the transducer hardware. Numerical simulations were performed along with acoustic hydrophone measurements to corroborate this data, which were found to be in general agreement. With future refinements, this cost-effective method could be practical as an expedient and cost-effective characterization technique for in-house FUS transducer development.
1 INTRODUCTION
Focused ultrasound (FUS) is a non-invasive therapeutic modality showing promise for treatment of a multitude of disease indications. Its effects on tissue are immediate, precise, and less likely to affect healthy tissues in the body as opposed to other forms of treatment like systemic chemotherapy, surgical techniques and radiation. Many of these now FDA-approved procedures, including ablation of uterine fibroids, prostate metastases, and thalamic tracts for treatment of essential tremor, are provided under image guidance and have dramatically reduced the risk of complications and the need for post-procedural hospital stays (Elias et al., 2013; Gorny et al., 2014; Yeo et al., 2015). As FUS applications are extracorporeal, characterization techniques that provide precise information on focal region location and dimensions are essential to ensure safe targeting and treatment.
Numerical simulations can estimate the geometrical dimensions of the focal region of a FUS beam to an accuracy that is highly dependent on a variety of factors. This depends both on the complexity of the software and the information used for both the device hardware in question and the medium that is treated (Hancock et al., 2009; Krasovitski et al., 2011; Wang et al., 2011). The most conventional method of experimentally quantifying acoustic fields from a FUS transducer uses hydrophone transducers, which can obtain discrete, high-resolution 3D quantitative values of localized acoustic pressures (Anastasiadis et al., 2019). While this technique is the most common in preclinical settings, transducer probes and positioning equipment are expensive. Needle probes must also be handled carefully due to cavitation-based damage at high acoustic pressures (Anastasiadis et al., 2019; Zanelli & Howard, 2006). Additionally, scanning entire fields by collecting discrete data in all 3 dimensions is time consuming, and data reproducibility can also be challenging.
Qualitative techniques such as Schlieren Imaging and Infrared (IR) imaging are used to evaluate ultrasound fields in terms of pressure and temperature distributions, respectively. Schlieren imaging provides real-time 2D projections of the sound field based on its effects on refracting light in a liquid medium (Kremer et al., 2015; Kudo et al., 2004). IR Thermography involves placing an IR camera facing a tissue-mimicking phantom that acts as an absorbing medium of the ultrasound beam (Gutierrez et al., 2008; Patel et al., 2008; Shaw & Nunn, 2010). This procedure is limited by the penetration of light and so also rendered 2 dimensional. Devices for both techniques can also be prohibitively expensive; especially for new and emerging research programs.
Hydrogel phantoms play an important role in FUS transducer characterization and quality assurance and are used to verify transducer alignment, visualize focal region geometry/location and monitor temperature rise (Civale et al., 2015; Lafon et al., 2005; Martin & Fernandez, 1997; Patel et al., 2008; Wang et al., 2011). Heat-sensitive albumin protein and thermochromic dyes alike have been incorporated into gel phantoms for characterizing focused ultrasound transducers as well as a variety of other thermal ablation devices (microwave, radiofrequency, cryoablation) (Dabbagh et al., 2014; Eranki et al., 2019; Menikou & Damianou, 2017; Qureshi et al., 2015). Albumin, for example can be dissolved in the gels, which then denatures when heated, becoming optically opaque and also visible by diagnostic ultrasound (Lafon et al., 2005; Wang et al., 2011). The effects generated in both these phantoms are irreversible, rendering them limited to single use. Moreover, preparing the phantoms can be technically demanding for minimizing the entrapment of air that can react with the ultrasound pressure field to generate acoustic cavitation (Lafon et al., 2005). Some hydrogel materials may also present safety concerns from unreacted monomers, such as acrylamide which is reportedly carcinogenic.
Herein, we present preliminary data for the development of a characterization technique for FUS transducers using thermochromic liquid crystal (TLC) films. The method is relatively inexpensive and time efficient. TLC Film sensors exploit the thermochromic effect, in which exposure to specific temperature changes causes cholesteric crystal within the material to shift alignment. This in turn causes them to reflect different wavelengths of the visible spectrum, which results in a visible change in colour (Popov et al., 2017; Smith et al., 2001). Experiments were carried out using a custom FUS system designed for localized treatments at the bedside for FUS-based therapeutic applications. The geometry and location of the focal zone were characterized using the TLC films and results were compared to numerical simulations and hydrophone measurements. Current limitations of this colorimetric technique are discussed as well as potential future refinements for making it more widespread and applied.
2 FUS SYSTEM
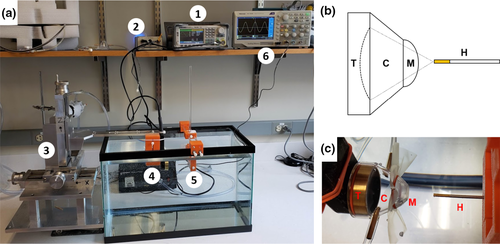
The FUS system was comprised of a single element FUS transducer (Sonic concepts) with a centre frequency of 3.57 MHz, an aperture diameter of 33 mm and radius of 35 mm. A custom cone was designed that adheres to the open face of the transducer (Sonic concepts) with a height of 40 mm. The cone is sealed with an acoustically transparent flexible membrane (0.05”: McMaster-Carr) at its exit plane. This allows the cone to be filled with degassed water, providing a water path from the surface of the transducer to the treatment target, in order to maximize coupling between the two. Using a syringe connected to the cone's inlet, the membrane can be inflated and deflated to vary the depth of the fixed position of the focal region. The water within the cone is degassed using an in-line degassing membrane (PermSelect) connected to an external vacuum pump. The transducer is driven by a function generator (SDG2042X, Siglent) connected to a custom amplifier (AMP-200, Sonic Concepts) via a standard 50 Ω impedance matching network. The function generator supplies a maximum output power of 0.34 and 6.73 W, without and with the amplifier, respectively. Different exposure parameters (i.e. pulse duration, intervals and total exposure time) can be varied by selecting the appropriate input settings on the function generator. The transducer is attached to a custom, 3D positioning system (Velmex, Bloomfield), with a resolution of 1 mm. Connecting the transducer to the positioning system is achieved using a custom 3D printed component (Anastasiadis et al., 2019). The FUS system is shown in Figure 1.

3 ACOUSTIC PRESSURE CALIBRATION
 (1)
(1) (2)
(2)4 SIMULATIONS OF THE ACOUSTIC PRESSURE FIELDS
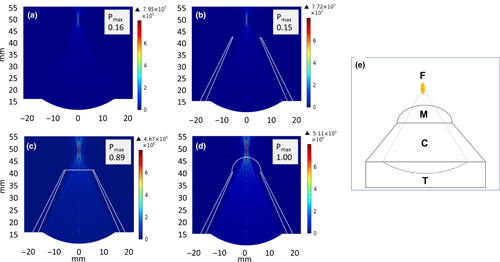
We carried out numerical simulations to characterize the acoustic pressure fields generated by the FUS transducer. In order to evaluate the effects of the presence of the cone, degassing the coupling water, and the membrane on the transmission of ultrasound energy, four conditions were simulated: (a) the transducer in free-field (i.e. in water); (b) the transducer with the attached cone but without the membrane; (c) the membrane attached to the exit plane of the cone, non-inflated with degassed water in the cone, and (d) condition ‘c’ with the membrane inflated. For condition ‘d’, the geometry of the membrane was modelled as an arch with a height similar to the inflated membrane for the experimental conditions such that the centre of the focus was just beyond the outer edge of the membrane.
 (3)
(3)| Water (8% air)a | Water (2% air)b | PVC | Silicone rubber | |
|---|---|---|---|---|
| Density (kg/m3) | 998 | 998 | 1760 | 1250 |
| Speed of sound (m/s) | 1498 | 1498 | 1060 | 1460 |
| Attenuation (dB/cm) | 0.0351 | 0.0092 | 1.1200 | 0.0875 |
- a Nondegassed water.
- b Degassed water.
The results of the numerical simulations are shown in Figure 2. Acoustic pressures for all conditions (Figures 2a-c) were normalized to that generating the highest pressure at the focal region. This occurred when the cone was filled with degassed water and the membrane inflated, where there was degassed water along the entire beam path (Figure 2d). In free field (Figure 2a) and when the cone was used without the membrane (Figure 3b), the normalized calculated maximum pressure at the centre of the focal region was 0.16 and 0.15, respectively, indicating no effect of the presence of the cone. The normalized pressure for the cone filled with degassed water without inflating the membrane was 0.89, demonstrating the substantial increase in the calculated pressure when using degassed water. The simulations also determined the position and dimensions of the focal zone and appear in Table 2.
| −3 dB | −6 dB |
DH/F (mm) |
|||
|---|---|---|---|---|---|
| Radial (mm) | Axial (mm) | Radial (mm) | Axial (mm) | ||
| Simulations | 1.2 | 3.5 | 1.6 | 5.5 | 35 |
| Hydrophone | 1.1 | 3.1 | 1.5 | 4.1 | 38 |
| TLC Film | * | 3.7 | * | 4.9 | 34 |
- DH/F, distance from the transducer to the hydrophone or film.
- * data not collected.
5 HYDROPHONE MEASUREMENTS OF THE ACOUSTIC PRESSURE FIELD
Hydrophone measurements of the acoustic pressure field were carried out as previously described (Anastasiadis et al., 2019). In brief, the transducer was operated in continuous mode and placed in a tank (51 ×27 × 32 cm) filled with deionized water. A needle hydrophone (Onda) was positioned in the tank using a 3D printed custom holder. The holder was designed with commercial software (Solidworks) and 3D printed with a commercial 3D printer (LulzBot TAZ 5, Aleph Objects, CO). With the hydrophone fixed in place, the transducer was moved in all three dimensions (x, y, & z) in and around the focal region using a step-size of 1.0 mm, while the measured voltage at each location was recorded using a digital oscilloscope (Tektronix SDG 2042X). The experimental setup for the hydrophone measurements is shown in Figure 3.
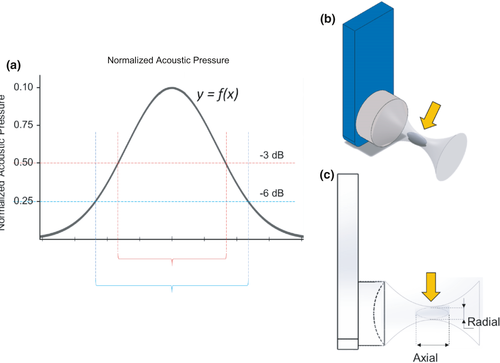
The centre of the focal region was designated as the location where the maximum pressure was recorded. This was found at 38 mm from the transducer surface. The values measured with the hydrophone were normalized to the maximum measured pressure at the centre of the focal region. In order to calculate the width and length of the focal region, −3 dB (half magnitude versus the peak) and −6 dB (quarter magnitude versus the peak) values are commonly used (Figure 4; Nguyen et al., 2019). The position and dimensions of the focal zone, as determined using the hydrophone measurements, are summarized in Table 2 (below) together with those from the TLC films.
6 CHARACTERIZING THE FOCAL REGION USING THE TLC FILMS
A procedure for characterizing the focal region dimensions and location (as obtained using the hydrophone) was developed using the TLC films. These black, polyester-based films (LCRHallcrest) contain an encapsulated layer of cholesteric crystals that change colour when exposed to a specified range of temperatures. This occurs via shifts in the alignment of the crystal's helical structure (i.e. pitch), which alters the absorption and reflection of different wavelengths of the visible spectrum. The temperature range of a film can be modified by changing the proportions and composition of the cholesteric crystals (White & LeBlanc, 1999).
The experimental setup using the TLC films is shown in Figure 5a,b. A TLC film (R35C5 W, LCRHallcrest) was used that was sensitive to temperatures in the 35–40°C range. This particular film was determined to be optimal in preliminary experiments (data not shown) for generating the clearest signals in response to FUS exposures. A 3D printed holder with a slot designed to maintain a photo slide cassette (50 × 50 mm) containing the TLC film sample was fabricated to allow rapid testing. The films were cut and fitted into the inner 35 × 35 mm portion within the slide cassette (Figure 5c). The cassette was then inserted into the holder that was centred directly facing the transducer. The setup and procedure were similar to the hydrophone experiment, with the TLC film sample in lieu of the hydrophone transducer. The position of the film was fixed, and the transducer was moved axially toward the TLC film with a step size of 1 mm. The transducer was powered on in continuous mode at 2 V for 2 seconds at each location. The image generated on the film (Figure 5d) was captured using a mounted camera phone (iPhone XR, Apple) immediately outside the water tank and opposite the films. Images were captured when visualized throughout the axial dimension. This process was repeated at each step size location (n = 5).

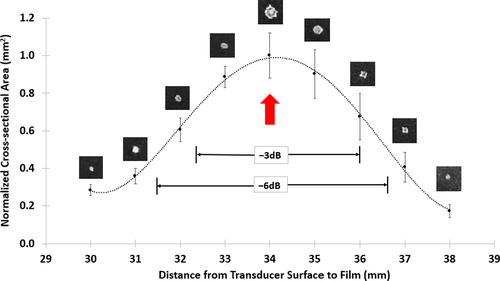
Captured digital images on the films were processed using Image J (ImageJ v1.52n, NIH). First, an image was imported and the pixel-to-millimetre scaling was set according to a segment of ruler tape located on the 3D printed holder that was captured with the TLC signal (Figures 5d and 6a). Then, a colour thresholding filter was applied to isolate the area of the signal from the background (Figure 6b). The area was then selected using the ‘wand’ tool and subsequent measurements were obtained for the perimeter, area (entire region within the perimeter), and major and minor diameters (using a best-fit ellipsoid approximation) (Figure 6c). The areas of the axial images (representing the focal diameter at the axial location) were processed in Microsoft Excel. The mean area (n = 5) at each location measured was plotted according to the distance from the transducer. These data were then used to determine the −3 and −6 dB values of the axial length of the focal region (Figure 7; Table 2).

7 COMPARISON BETWEEN HYDROPHONE AND TLC FILM MEASUREMENTS
 (4)
(4) (5)
(5)
Using Equations 4 (hydrophone) & 5 (TLC film), the −3 and −6 dB values were obtained for the axial dimensions of the focal region for each method. The results are summarized in Table 2. Note, because of technical reasons (discussed below), values for the radial dimension of the focal region could only be determined using the hydrophone and not for the TLC films.
Two-sided nonparametric Mann–Whitney U tests were performed to evaluate if statistical differences occurred between the hydrophone and TLC film measured data (H - F). A P-value of less than 0.05 was regarded as statistically significant. P-values for the −3 and −6 dB axial lengths, and the distance from the transducer to the focal centre were 0.12, 1.0 and 0.19, respectively, indicating that statistical differences did not occur for any of the measurements obtained between the methods. Disparities in the results among all three methods employed appear in Table 3.
| N - H | N - F | H - F | |
|---|---|---|---|
| Radial (−3 dB) | 9 | - | - |
| Radial (−6 dB) | 7 | - | - |
| Axial (−3 dB) | 13 | 5 | 16a |
| Axial (−6 dB) | 34 | 12 | 16a |
| DH/F | 8 | 3 | 12a |
- Abbreviations: N, Numerical simulation; H, Hydrophone method; F, TLC film method; DH/F, distance between transducer to film or hydrophone.
- (All values are based on those presented in Table 2)
- a Differences for H - F were not statistically different (p > 0.05).
8 CONCLUSIONS AND FUTURE DIRECTIONS
In this study, we developed and evaluated a novel, in-house characterization procedure for FUS transducers. This procedure employs an interchangeable 3D printed component that allows testing of multiple TLC films, quick visualization of the focal region, and a basic image processing algorithm to obtain geometric data. Overall, as comparisons with simulations and hydrophone data show, the method was found to be accurate and reproducible for determining the central location of the focal region and its axial length. Indeed, the disparities for each of these metrics, between the simulations and the TLC films, were found to be less than those between the simulations and the hydrophone. A direct comparison however between these metrics, for the hydrophone and TLC films, showed them not to be statistically different.
One limitation of the procedure is that we are not at this time able to determine the radial −3 and −6 dB dimensions of the focal region, and instead only the maximum dimension (i.e. radial diameter), which is found on the central (i.e. axial) plane. Efforts are currently underway to ascertain true temperature elevations from the signals generated on the films, using an empirical calibration process (Eranki et al., 2019). This, if accurate, would allow true energy deposition to be determined based on spatial distributions of the colour patterns on the films, which could yield accurate −3 and −6 dB dimensions. Furthermore, this data would be obtained without moving the radial position of the films; a time-consuming process that is required for obtaining the hydrophone measurements. Additionally, we are also investigating the use of a simple and submersible digital image capture module that would collect the images in real time. Combined with simple algorithms, this would substantially expedite the characterization process and reduce operator error and variability.
ACKNOWLEDGMENTS
This research was supported by a DARPA Phase I SBIR grant awarded to the Maryland Development Center, Baltimore, MD.
CONFLICT OF INTEREST
The authors declare no conflict of interest.


