Mechanical testing of gas metal arc AA6082-T6 weldments
Abstract
Tensile, fatigue, bending, Charpy, and microhardness tests were carried out both on the AA6082-T6 parent material and on the gas metal arc weldments. The results of Charpy tests revealed higher energy absorption values for the welded material. The high temperature which the material is subjected to during the fusion welding brings to an extreme softening effect, reducing the strength of the material.
1 MATERIALS AND METHODS
Gas metal arc welding (GMAW) is one of the most widely used welding technique for aluminum alloys. Even if many improvements have been made during the years, welding of aluminum alloys can still be problematic. In the present study, results of tensile, fatigue, bending, hardness, and impact tests are presented.
Experiments on 4 mm extruded plates of aluminum alloy 6082 received in T6 tempered condition were carried out. The GMAW process was carried out using an AA5183 filler wire with a diameter of 1.2 mm. The heat input was 0.43 kJ/mm for the first weld and 0.3 kJ/mm for the second one. The gas flow shield was set to 20 L/min.
1.1 Results and discussion
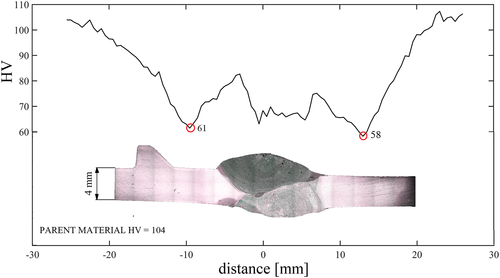
Hardness measurements were done on one sample using a Mitutoyo Micro Vickers Hardness Testing Machine (HM-200 Series). A load of 1 kg was applied for 10 s. Starting from the geometrical center of the welding, Vickers indentations were done along the cross section, keeping a distance of 0.5 mm between those as indicated in American Society for Testing and Materials (ASTM) E92-16 standard.1 Three series of indentation were performed to evaluate the repeatability of the results. After each set of hardness measurement, the sample was grinded and polished down using 1 μm diamond paste suspensions. Figure 1 shows the resulting hardness profile along the mid-thickness of a transverse section of the weld.

A drop in hardness was observed in the proximity of the welding, which is due to super-aging of the alloy. As a result of the high temperature during the welding process, coalescence of β' or β phases occurs in the welded material. As can be seen in Figure 1, full recovery of the strength is reached at approximately 22 mm from the center of the welding.
Tensile tests were performed following the ASTM E8/E8M-16a standard.2 Specimens were taken from different regions of the welded plates, both longitudinally and transverse to the welding direction. Table 1 summarizes the results of the tensile tests.
| σp,0.2 (MPa) | UTS (MPa) | Strain at Fracture (%) | Absorbed Energy (J) | |
| Parent material transversea | 317 | 336 | 7 | 4.2 |
| Parent material longitudinala | 314 | 335 | 12 | 4.9 |
| Fused zone longitudinalb | 132 | 216 | 11 | 3.0 |
| HAZ longitudinalb | 145 | 210 | 13 | 8.2 |
| Fused zone | 142 | 213 | 8 | 3.9 |
| HAZ | 141 | 211 | 9 | 8.4 |
- Abbreviations: HAZ, heat affected zone; UTS, Ultimate tensile strength.
- a With respect to the extrusion direction.
- b With respect to the weld direction.
There is a linear correlation between hardness and yield strength.3 This was observed with the tensile tests. All the welds tested broke in the heat affected zone approximately at the same distance where the minimum hardness value was measured. Using the formula proposed by Grong,3 the corresponding predicted values of yield strength profile along the welding can be calculated. From that prediction, it was found that a reduction of 47% in strength should be expected. Comparing this with the real reduction in strength which resulted of 44%, it can be confirmed that between hardness and yield strength, there is an approximately linear relationship as suggested.
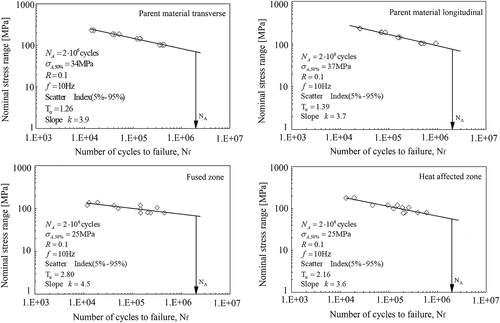
 ()
() ()
()
| Welded Material | Welded Material Considering Km | Standard Indication | |
|---|---|---|---|
| Slope k | 3.8 | 2.8 | 3 |
| ΔσA(95%) | 31 | 27 | 25 |
Three-point bend test was carried out on rectangular specimens. The displacement rate of the plunger was set to 1 mm/min, and the tests were stopped in case of cracks propagating through the thickness of the sample or when the complete U shape was reached without the outcoming of any cracks. In the case of welds, the material behaved more ductile, reaching the final U shape without presenting any cracks on it. The parent material instead, behaved less ductile, cracking in the middle after approximately 15 mm of plunger stroke.
Charpy V-notch test was used to collect impact data. The test was carried out following the ASTM E23-16b standard,6 and the results are presented in Table 1. The test showed that material tested in the heat affected zone has the higher energy absorption capacity.
2 CONCLUSIONS
The hardness test showed that the material becomes softer when this is subjected to heat as what happens during fusion welding. The hardness profile presents two minimum values in the heat affected zone, showing a complete recovery of the material properties at a distance of approximately 22 mm from the nuggets of the welding. The minimum hardness point corresponds to the weakest part of the joint. This was confirmed with the tensile tests, where all the samples broke in the same zone where the minimum hardness value was found. From both the bending test and the metallography carried out on sections of samples, the quality of the welding is overall good: no lack of fusion was observed, no cracks opening during the bending occurred, and the porosity ratio was lower to what indicated in the standard for this type of aluminum welds. The correction suggested by the IIW in case of misaligned weld samples resulted consistent to what indicated in the standard for this type of weld. The impact test showed a higher energy absorption capacity of the specimens taken from the heat affected zone.


