Be proactive or inactive: The effects of systematic job riskiness on effort investment
Abstract
A company's success heavily relies on its employees' willingness to take initiative at the workplace. With three representative types of risky environments introduced and a series of incentive schemes implemented in the order that mimics the trial process of a company's search for an effective incentive design, we experimentally explore the interplay between systematic job riskiness and managerial practices in determining individuals' risky effort input. Our findings demonstrate that the effectiveness of typical motivational practices, including competitive schemes and the combined use of peer feedback, could vary across risky working environments systematically.
1 INTRODUCTION
Business owners and managers are constantly on the lookout for employees who take initiative at challenging tasks and strive to add value to the organization. A vast body of research on economics and business management has focused on designing and implementing motivational incentives to promote effort exertion among workers (van Dijk et al., 2001; Dohmen & Falk, 2011; Bull, Schotter, & Weigelt, 1987; Schotter & Weigelt, 1992; Nalbantian & Schotter, 1997). However, very little attention has been paid to workers' decision making about effort allocation between or among job tasks of various riskiness. In particular, with challenging tasks being typically riskier in the sense of bearing greater uncertainty of translating effort input into output, understanding workers' effort investment decisions is of crucial importance to a company's success. 1 Such exploration is of greater relevance if the job positions or occupations under consideration have greater job value. 2
To investigate the effects of job riskiness on workers' effort investments, that is, their willingness to take initiative at the challenging task, we design a laboratory experiment that introduces three distinct effort–outcome functions, each corresponding to a representative level of riskiness exhibited by certain occupations or job positions. The three risky environments vary along two dimensions: the relative chance of obtaining a good outcome against a bad one, and the magnitude of contrast between the two possible outcomes. The first dimension measures the difficulty of obtaining a good outcome by making effort 3 whereas the second dimension reflects the tension between the reward of the good outcome and the cost of the bad outcome. 4 Our study focuses on the scenarios where the more difficult it is to succeed, the greater the tension is, 5 aiming at capturing the impacts of working environments of different occupations, stages of career development, and positions within a firm on workers' effort investment decisions.
In order to mimic a company's trial process of adopting various incentive schemes, our experiment is designed to start with the benchmark scenario without any intervention imposed, across all three randomly imposed risky environments, under each of which individuals' effort investment decisions are elicited. A purely competitive scheme and the other with additional provision of peer information, the two representative managerial practices, are then introduced one by one, to mimic the process of a company's searching for a most effective incentive scheme. Although competition within a team may motivate employees to work harder (Bloom & Van Reenen, 2011; Bull et al., 1987; Harbring & Irlenbusch, 2003), it may also result in an excessively stressful workplace that hinders overall performance (Lazear, 1989). And the combined practices have also been found to significantly influence a worker's competitive behavior (Eriksson, Poulsen, & Villeval, 2009; Freeman & Gelber, 2010; Wozniak, Harbaugh, & Mayr, 2014). Our experimental design is intended to further investigate the interplay between the risky working environments and the typical managerial practices in affecting workers' effort investment decisions. We are also enabled to demonstrate the relative effectiveness of representative incentive schemes when they are adopted sequentially, although unintendedly, as trials.
Our experimental findings show that subjects do exhibit different levels of willingness to take initiative across three risky environments. The follow-up introduction of competition alone is associated with an increase in the subjects' overall willingness to exert effort but only in the relatively risky environments. The further use of peer information, however, does not simply amplify the previous results—it leads to an overall increase in effort input in the low-risk environment but an overall reduction in effort input in the high-risk environment, with no significant impact found on the medium-risk environment. Further exploration at the individual level reveals an asymmetric pattern of subjects' reactions that again interact with the riskiness of the environments.
2 EXPERIMENTAL DESIGN
In our experiment, each subject has an effort endowment of 100 to invest at work, and he/she has to consider the choices between “being proactive” and “being inactive.” Different from a “real effort” design, we use a “stylized effort” design. In the real-effort experiments (e.g., van Dijk et al., 2001; Dohmen & Falk, 2011), the experimenters have the subjects complete a task such as solving math problems, which require actual physical or mental exertion. Experimenters, however, can only measure the subjects' productivities rather than their actual effort levels, which are unobservable and difficult to identify in the real effort tasks. Although the nature of the effort-outcome function is unknown by the experimenter in a real effort design, a strong assumption that a higher level of effort input results in a better performance is typically adopted. However, several studies (Ariely, Gneezy, Loewenstein, & Mazar, 2009; Ashton, 1990; Baumeister & Showers, 1986; Cao, Price, & Stone, 2011; Dohmen, 2008; Frey & Jegen, 2001) have shown that the positive relationship between the level of effort and desirability of outcomes is not generalizable to all working environments through demonstrating the physiological effects that workers under great pressure performed even worse with greater effort input.
By contrast, we follow the “stylized effort” approach (Bull et al., 1987; Fehr & Falk, 1999; Nalbantian & Schotter, 1997; Schotter & Weigelt, 1992) where subjects are required to choose an effort level with a specified effort–payoff function rather than to actually work. The stylized effort design has one clear advantage of control so that it not only enables richer identifications of effort levels across different scenarios by considering variants of effort–outcome functions but also avoids artificially imposing the strong assumption of a positive relationship between effort and outcome. In this sense, such stylized effort design fits better our investigation of the workers' choice between being inactive and being proactive, which is explicitly regarding effort input allocation instead of output per se.
To investigate the potential impacts of the riskiness of working environments, we experimentally elicit the subjects' decision making under three different risky environments to measure their willingness to exert risky effort. Specifically, each subject could choose to invest only in routine/regular tasks (i.e., “being inactive”) by reserving her endowment to the safe option that earns a risk-free return rate normalized to 1 or to also invest some efforts X ∈ [0,100] in the more challenging tasks (i.e., “being proactive”), which is a risky option with its return rate being a random variable with the distribution (p, RH; 1 − p, RL). Therefore, the final outcome of investment is Y(X,R) = 100 − X+RX, where R is the realized value of the random variable (see the experimental instructions in Appendix S1). As shown in Table 1, the three types of risky working environment differ such that the greater the payoff contrast between the possible good and bad outcomes for a given challenging task, the less likely it is for the investment to have the good outcome. That is, the greater the tension is between the good and the bad outcome for a challenging task, the more difficult is to succeed. The three types are also assigned the same expected return rate, which is greater than one (i.e., the return rate of the risk-free option), making it in the interest of workers to consider “being proactive” and investing effort in the challenging tasks.
| Environments | (p, RH; 1 − p, RL) | E(X) | D(X) |
|---|---|---|---|
| Low-risk (Type A) | (.75, 1.2;.25, 0.8) | 1.1X | 0.03 X2 |
| Medium-risk (Type B) | (.5, 2.2;.5, 0) | 1.1X | 1.21 X2 |
| High-risk (Type C) | (.2, 6;0.8, −.125) | 1.1 X | 6.0025 X2 |
At Stage 1, the baseline scenario, every subject decides how much to invest in the challenging task against the regular task under each of three types of risky working environments (i.e., A, B, and C in Table 1), with the decisions used to measure their willingness to exert effort. 6
At Stage 2, we introduce a competitive scheme into the decision-making process. Specifically, we employ a two-person tournament to investigate the effects of competition on individuals' willingness to be proactive, that is, to invest in the challenging task, under each risky working environment. On the basis of individual investment outcomes, only the better performer in each randomly matched pair wins a reward of 220 tokens, whereas the other person receives nothing.
At Stage 3, we further introduce a feedback mechanism such that each subject is required to make another round of effort investment decisions after receiving peer information revealing the paired opponent's investments at Stage 2 under each risky environment.
3 THEORETICAL PREDICTION
Hypothesis 1.At the benchmark Stage 1 without competition and peer information, the aggregate level of effort investment tends to be lower as the riskiness of working environment increases.
Because the three types of environments are assigned the same expected return rate, which is greater than one, a risk-neutral player will choose to invest all in the challenging task across three different risky environments. Moreover, a risk-loving player will do the same investment (i.e., investing all in all three environments) because she is supposed to be more tolerant of riskiness than is a risk-neutral player. A risk-averse player, however, will vary her investment in the challenging task in accordance with the riskiness of environment. In particular, a risk-averse player tends to invest less in the challenging task as the riskiness of the environment increases. She thus will invest most in Type A environment and invest least in Type C environment.
Furthermore, considering the existence of loss aversion, which is an important concept associated with the prospect theory (Kahneman & Tversky, 1979), regardless of the risk preference, a player tends to decrease her effort investment in Type C environment (with a possibility of receiving a negative payoff). Hence, at the aggregate level, the three types of environments we deliberately design are expected to induce effort levels to vary systematically across three environments—the higher the environment riskiness, the lower the overall effort level.
Hypothesis 2.In the two-person competition, among all three risky environments, the largest share of subjects who choose to invest all in the challenging task emerges under Environment A, followed by Environment B. Environment C is also expected to exhibit the greatest share of subjects who choose to invest zero, followed by Environment B.
Considering the competition between two players, with only the winner receiving a reward of 220 tokens, we show the existence of a dominant strategy under each type of risky environment (see the proof in Appendix A1): The player will choose to invest all in the challenging task if the risky environment carries a chance of realizing RH, that is larger than 0.5, to invest zero if the chance of realizing RH is less than 0.5 and will be indifferent between investing all and investing zero if the chance of realizing RH equals 0.5. Therefore, among three types of risky environments, we expect the largest share of subjects to choose to invest all under Environment A, followed by Environment B. Environment C is also expected to exhibit the greatest share of subjects who choose to invest zero.
In addition, compared with individual investment at the benchmark Stage 1 without competition, the introduction of the two-person tournament at Stage 2 is expected to incentivize subjects to invest more under the low-risk Environment A whereas to invest less under the high-risk Environment C.
Hypothesis 3.The further use of peer information about the opponent's investment on top of the two-person competition, at Stage 3, should have no influence on individuals' decisions at all.
As we have discussed above, in each risky environment, the player has a dominant strategy on investment, which is determined by the distribution of return rates but independent of the other player's choices. Therefore, no matter how the opponent invests, a rational player, regardless of the type of her risk preference, should always maintain her dominant strategy even after receiving additional peer information in such two-person competition.
4 SUBJECT POOL
In May 2016, we conducted our lab experiment with a total of 101 students from Central University of Finance and Economics in Beijing, China. We recruited all the subjects through invitation emails. To control for other potential influences on individual investment decisions, all subjects were required to complete a follow-up questionnaire on their demographics. 7 As shown in Table 2, the subject pool consists of 41 males and 60 females. Only children account for 63%. Besides, 74% of the participants are graduate students, and the average age is 23.5 years. 8
| Variables | Observation | Mean | Standard deviation | Min | Max |
|---|---|---|---|---|---|
| Male | 101 | 0.41 | 0.49 | 0 | 1 |
| Age | 101 | 23.52 | 1.84 | 18 | 28 |
| Only child | 101 | 0.63 | 0.48 | 0 | 1 |
| Background Knowledge | 101 | 0.81 | 0.39 | 0 | 1 |
| Risk aversion | 101 | 2.87 | 0.95 | 1 | 5 |
- Notes. We define the dummy “Background knowledge” to be 1 if the subject has taken the course on economics and investment, otherwise to be 0. We asked subjects to self-assess their risk preference on a scale of 1 to 5: 1 = strongly risk loving, 2 = risk loving, 3 = risk neutral, 4 = risk averse, 5 = strongly risk averse.
We deliberately recruited senior students mainly majored in business and economics for the following reasons. 8 Lab experiment enables us a clean environment to focus on the interaction between environment riskiness and the workers' willingness to take up challenging task. In this sense, our subjects who have obtained some training in game theory and investment theory courses are more familiar with the abstract set up (e.g., the output functions) than other non-student subjects or students with no training in economics. More importantly, these students are most likely to obtain a good understanding of the essential concept of riskiness and its various levels associated with our experimental workplace after reading through our instructions. Subjects' sound understanding of the risky choices they made ensures the quality and the generalizability of our empirical findings. 9
5 RESULTS
5.1 Overall response
Figure 1 shows the subjects' average level of willingness to be proactive. At stage 1, in the absence of a competitive incentive and peer information, subjects invest most in the low-risk Environment A and the least in the high-risk Environment C, with the decision gap between any two types of environments being significantly different from zero at a 1% significance level. The riskier the job nature or environment is, the lower the willingness to be proactive tends to be. Hence, the investment differences across the three risky environments are consistent with our Hypothesis .

Comparing data from Stage 2 with that of Stage 1 reveals that introducing competition increases the subjects' effort input (i.e., to be proactive) in the medium- and high-risk environments (by 10.6 and 9.6, respectively), with both changes being significantly different from zero (p = .0004 with paired t test between Stages 1 and 2 in the medium-risk Environment B; and p = .0040 with paired t test between Stages 1 and 2 in the high-risk Environment C). By contrast, the average level of effort in the low-risk Environment A is not affected (p = .8231 with paired t test between Stages 1 and 2). Therefore, the experimental results at Stage 2 contradicts our prediction in Hypothesis that subjects would decrease their effort investment in the high-risk Environment C whereas they would increase the effort investment in the low-risk Environment A.
The follow-up combined use of peer information at Stage 3 is shown to be able to incentivize greater overall effort investment in the challenging task in the low-risk Environment A. The average investment increases from 71.5 to 82.6, with a rise significantly different from zero (p = .0007 with paired t test between Stages 2 and 3). Conversely, in the high-risk Environment C, the average investment decreases from 37.1 to 28.0, with a reduction significantly different from zero (p = .0038 with paired t test between Stages 2 and 3). The effect is insignificant in the medium-risk Environment B (p = .5904 with paired t test between Stages 2 and 3). Therefore, our Hypothesis is rejected by the overall responses to peer information in both low- and high-risk environments.
5.2 Individual-level response
We next turn to the investigation at the individual level.
At Stage 1, consistent with the trend in the aggregate data, the individual observations also verify that individual subject tends to decrease his/her effort investment in the challenging task as the working environment becomes riskier. Specifically, the majority of subjects invest most in the low-risk Environment A except for 19 out of 101 subjects who choose to invest most in the medium-risk Environment B instead; on the other hand, all the subjects invest least in the high-risk Environment C. Hence, on the basis of the discussion in Hypothesis , we can conclude that the majority of subjects have a risk-averse and maybe also a loss-averse preference.
For Stage 2 with competition introduced, the scatter graphs in Figure 2 show the changes in individual i's effort investment from Stage 1 (
 ) to Stage 2 (
 ) across three risky environments (with j increasing as the environment becomes riskier).

In the low-risk Environment A, subjects raising and lowering their effort investment account for almost equal shares, with around half of the points lying above and below the diagonal line, respectively. More specifically, 35.64% of subjects choose to increase their effort investment when entering into competition at Stage 2, whereas 37.62% of subjects decrease their effort investment, along with the rest of 26.73% with their effort investment remained the same. Because the proportions of the two groups who changed their effort inputs in opposite directions are not significantly different from each other (i.e., p = .7702 with the proportion test for the comparison of two proportions), the average level of effort in the low-risk Environment A is not affected by the introduction of competition at Stage 2. By contrast, the majority of subjects in both the medium-risk and high-risk environments become more willing to be proactive when entering into competition, as reflected by the majority of the points lying above the diagonal line. In the medium-risk Environment B, 49.50% of subjects increase their effort input whereas only 28.71% decrease the investment when entering into competition at Stage 2, and the difference between two proportions is significantly different from zero (p = .0025 with the proportion test). Moreover, in the high-risk Environment C, the proportion of subjects who raise their effort input is 46.53% whereas the proportion of subjects who lower their investment is only 30.69%, and the difference between these two proportions is also significantly different from zero (p = .0208 with the proportion test).
In addition, we also generate a linear fit with the 95% confidence interval to show the relationship between the effort investment at Stages 1 and 2. In the low-risk Environment A, the fitting line as well as the confidence band with around half of the part lying above and below the diagonal line. By contrast, in the medium- and high-risk environments, the majority of the fitting line and the confidence band lie above the diagonal line. Therefore, the graphs indicate that introducing competition stimulates the overall effort input in the medium- and high-risk environments.
To further investigate the individual-level response to the additional use of peer information at Stage 3, we first define
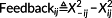 as the difference of effort investment in the challenging task between the opponent −i and individual i at Stage 2 in a given environment j, with the effect of negative and positive peer information defined as NegativeFeedbackij = Feedbackij * I(Feedbackij < 0) and PositiveFeedbackij = Feedbackij * I(Feedbackij ≥ 0), respectively.
In Figure 3, the two types of peer information are depicted on the horizontal axis—the left half denoting the negative feedback where the peer invests less than the individual (at Stage 2) and the right half denoting the positive feedback where the peer invests more than the individual. We generate the best-fitting line to present the individual responsiveness to the two different types of information. As shown in the graphs, the further introduction of peer information leads to asymmetric responses in both low- and high-risk environments, although in different manners. In the low-risk environment, the slope of the fitted line on the right is significantly larger than the slope of the line on the left, which indicates that subjects tend to respond more to positive information by increasing their effort investment than to negative peer information in the opposite manner. By contrast, in the high-risk environment, the fitted line on the left is steeper than its counterpart on the right, implying that subjects tend to lower their effort input in response to negative peer information more than they increase their effort given positive peer information. Moreover, in the medium-risk environment, the slope difference between the two lines is insignificant; hence, the response to two types of feedback information is symmetric.


| Variables | Low risk (j = 1) | Medium risk (j = 2) | High risk (j = 3) | |||
|---|---|---|---|---|---|---|
| I | II | I | II | I | II | |
| β1j | 0.038 (0.107) | 0.037 (0.107) | .382*** (0.109) | .437*** (0.113) | .620*** (0.088) | .565*** (0.090) |
| β2j | .818*** (0.097) | .790*** (0.098) | .591*** (0.148) | .562*** (0.155) | 0.074 (0.125) | 0.117 (0.125) |
| Control Zi | No | Yes | No | Yes | No | Yes |
| Pr(β1j = β2j) | 0.000 | 0.001 | 0.353 | 0.590 | 0.001 | 0.013 |
| Observations | 101 | 101 | 101 | 101 | 101 | 101 |
| R2 | .470 | .518 | .359 | .389 | .396 | .444 |
- Notes. Standard errors in parentheses. In each regression, Pr(β1j = β2j) reports the p value of the Wald test for the null hypothesis that the individual responsiveness to negative and positive feedback are equal.
- ***p < .01.**p < .05.*p < .1.
As shown in Table 3, subjects in the low-risk environment respond only to positive information by increasing their effort at Stage 3, after being informed of their opponents' greater effort at Stage 2. However, in the high-risk environment, subjects respond only to negative peer information by decreasing their effort investment, a mirror image of the response in the low-risk environment. Lastly, subjects' response to the two types of peer information is symmetric in the medium-risk environment.
More specifically, according to the estimations in the regression Model II with controlling for individual characteristics, we find that firstly, in the low-risk environment, the subject would choose to increase her effort investment by 0.8 unit at Stage 3 if she is informed that her opponent's effort investment was 1 unit more than her own investment at Stage 2, but she would not change her effort investment at Stage 3 if knowing her opponent has invested less than herself. Secondly, on the contrary, in the high-risk environment, the subject would not response to any positive feedback that her opponent invested more effort than herself at Stage 2, but would decrease her effort investment by 0.6 unit at Stage 3 if being informed that her opponent's investment was 1 unit less than her own. Thirdly, in the medium-risk environment, the subject would decrease her effort investment by 0.4 unit at Stage 3 if being informed that her opponent's investment was 1 unit less than her own at Stage 2 whereas increase her investment by 0.6 unit if knowing that her opponent invested 1 unit more than herself, and the magnitudes of the responsiveness to the two types of feedback are not significantly different (by the Wald test, p = .590).
5.3 Discussions
The three hypotheses we tested above enable us to see that subjects consecutively experiencing a series of managerial practices—with competition and the additional peer information introduced in a sequence—behave in a way that justifies the common adoption of competition as an effective approach for promoting risky effort input even in face of the challenging task with substantial risk. Managers, however, may need to be cautious in providing the same peer information under different risky environments. As the common practice used in combination with competitive incentive scheme, the further provision of peer information is shown to be a good fit only for the relatively safe environment, with the corresponding overall effort input not varying in response to the sole adoption of a competitive scheme.
Our experimental data present evidence of subjects' behavior that seems to contradict with the theoretical prediction of a typical rational agent when it comes to their reaction to the imposition of competitive scheme and the follow-up additional use of peer information. One plausible explanation is that subjects carry out a series of reference-dependent reactions to those managerial practices introduced sequentially as demonstrated in our experiment.
At Stage 2, the imposed competition brings up a tradeoff perceived by the subjects. On the one hand, the subject experiences a greater sense of riskiness because the determination of her final payoff involves not only the riskiness of the working environment but also the uncertainty of another unknown opponent's performance (discouraging effect); on the other hand, the introduced competition incentivizes the subject to take more risk for the possibly better investment outcome than otherwise (stimulating effect). That is, the former effect results in discouraging individual effort input on the challenging task whereas the latter one stimulates riskier effort investment, hence leaving it an open question whether the subject will invest more or less in risky efforts (i.e., the challenging task) in the presence of competitive scheme.
Subjects under the low-risk environment start with a low-referenced level of riskiness, indicating that the discouraging effect from the introduced competitive scheme could be strong. By contrast, with higher referenced level of riskiness under the relatively risky environment, the discouraging effect of an additional riskiness from competition should be milder. On the other hand, the size of the stimulating effect varies across environment riskiness with subjects being more willing to take risk (so that to obtain the possibly good outcome) under the relatively safer environment. As a consequence, in the low-risk working environment, there exists a delicate balance between the two competing effects upon the imposition of a competitive scheme so that subjects tend to maintain the same effort investment on the challenging task. Although in the case of the relatively riskier environment, the stimulating effect, although by itself is smaller than that under the low-risk environment, still dominates the discouraging effect, resulting in a greater amount of effort input on the challenging task. 8
At Stage 3, in the low-risk environment, the further provision of the positive information intensifies the subjects' willingness to take on riskier investment for a better chance of winning over others. The provision of negative information, however, does not entail much effect because lowering risky investment does not help increase the winning chance. Because those corresponding subjects previously experienced quite strong but balanced competing effects (out of competition imposition), the marginal impact of positive information dominates that of negative information. By contrast, in the high-risk environment, being provided the negative information intensifies subjects' willingness to take less risk for winning. Because those subjects were also previously experiencing smaller discouraging effect than the stimulating effect out of the imposed competition, the marginal impact of the provided negative information thus dominates that of the positive information. Such asymmetric reactions in both the low-risk and the high-risk environment, although of different kinds, pin down the experimental findings we get.
6 CONCLUSIONS
Our study experimentally investigates the interplay between systematic job riskiness and incentive schemes in incentivizing workers to be proactive instead of being inactive, particularly in the context of a company's searching for an effective incentive scheme. Our findings demonstrate that the effectiveness of typical motivational practices, including competitive schemes and the follow-up combined use of peer feedback, could vary across risky working environments systematically. In particular, the high-risk working environment, which corresponds to the most creative jobs or senior positions, exhibits the greatest positive response to the use of competitive scheme alone, but is also most vulnerable to the additional use of peer feedback (with individuals in face of high-risk effort investment responding to negative peer information primarily). By contrast, when the working environment is of low risk, workers are highly responsive, in a positive way, to the further use of peer feedback in combination with the competitive scheme, which, by itself, is not influential in promoting harder work.
On the basis of the experimental findings above, we suggest a company's managerial practices to vary internally in the light of job riskiness varying across sectors and position hierarchies. Peer feedback is suggested for use in combination with competition among relatively junior positions or in relatively low-risk sectors but should be avoided or used only very cautiously when it comes to incentivizing senior staff, to whom the challenging tasks tend to be far riskier, if ever the company has tried some form of competitive incentive scheme. Similar implications also apply when considering the incentive designs across industries with systematically different job natures, given the currently prevailing competitive scheme in use. As to the highly competitive and creative jobs, like Research and Development (R&D) and other research work, where the peer-performance information is typically abundant, it is worth investigating how much detrimental the peer information may be.
In a word, in the process of trial implementations of incentive schemes, not only the existence of job riskiness but also the types of risky working environment matter to the effective incentive design. Our documentation of individuals' divergent responses to the competition scheme across different working environments as well as their various responses contingent on the additional peer information sheds light on the directions of reforming existing human resource and relevant managerial practices to accommodate systematic differences on job riskiness across job positions, internally within a firm or across different industries.
ACKNOWLEDGMENTS
We thank participants at the 2017 ESA International Meetings in San Diego and the Workshop on Experimental Economics in Hong Kong Baptist University for their helpful comments and suggestions. Financial support from the National Natural Science Foundation of China (Project 71403309) is gratefully acknowledged. All errors are due solely to the authors.
ENDNOTES
- 1 When the job task, like the challenging one, bears uncertainty about the exact productivity of and thus momentary returns to the workers' effort input, we consider the task to be risky (even though the probability distribution of the relevant payoffs is clarified like a lottery). Hence a worker's ex ante decision on effort allocation becomes a risky investment because more effort input allocated to a risky task does not necessarily lead to a better outcome.
- 2 For example, a manager's willingness to take initiative and try on challenging tasks has a greater impact on the success of a company than that of a clerk, whose job consists chiefly of regular tasks.
- 3 For instance, Research and Development (R&D) work bears greater risk than routine administration work in terms of translating effort into output.
- 4 For instance, a CEO's effort in top-level decision making has a far greater effect, negative or positive, on a company's performance than that of a junior worker.
- 5 For example, effort in a highly creative job is expected to produce far more exciting successes than that in a less creative job, but the possible loss is also more detrimental. The success rate is also far lower in creative jobs.
- 6 To control for the order effects on individuals' decision making, we randomly assigned the order of the three different working environments for each subject.
- 7 Extant literature indicates a correlation between risky investments and demographics of a population. For example, Deakin, Aitken, Robbins, and Sahakian (2004), Booth and Nolen (2012), and Cameron, Erkal, Gangadharan, and Meng (2013) discuss the effects of age, gender, and being an only child on individual risk behaviors, respectively.
- 8 Central University of Finance and Economics has two campuses in Beijing. We recruited the subjects mainly from the main campus, which includes only seniors and postgraduates. Freshmen, sophomores, and juniors are all at the other campus. As a result, 74% of the participants from Central University of Finance and Economics are postgraduates.
- 9 We thank an anonymous referee for pointing out the necessity of clarifying our choice of subject pool.
- 10 Although student-sample is questioned for its generalizability (e.g., Falk, Meier, & Zehnder, 2013), it fits well for our study that requires subjects to have a good and quick understanding of the experimental set up with abstract output functions and various riskiness levels therein, in order to ensure the generalizability of our findings to real life workplace where workers learn about the riskiness of their working environment gradually.
- 11 In our experiment, we deliberately use the two-person tournament that, theoretically, is expected to stimulate zero effort input in the challenging task under the high-risk Environment C. In contrast, even with this extreme form of competitive scheme, we still find greater risky effort input under Environment C.
APPENDIX A.
- Both the player and his/her opponent have RH as the realized rate of return for that risky investment. The player can win if and only if he/she invests more in the challenging task than does his/her opponent, rendering the dominant strategy of investing 100 regardless of the choice of the opponent.
- Both the player and his/her opponent have RL as the realized rate of return for the risky investment. The player can win if and only if he/she invests less in the challenging task than does his/her opponent, rendering the corresponding dominant strategy of investing zero.
- The player has RH as the realized rate of return for the risky investment whereas his/her opponent has RL. The player can always win as long as she invests any positive amount on risky investment, with investing all as the dominant strategy to not only guarantee 100% chance to win the competition but also maximize his/her own outcome of investment.
- The player has RL as the realized rate of return for the risky investment whereas his/her opponent has RH. The player will always lose as long as his/her opponent invests any positive amount on risky investment, but investing zero could maximize his/her own outcome of investment and even has a chance to win if his/her opponent invests zero at the same time.
To sum up, if the player has RH as the realized return rate, the dominant strategy is investing all in the challenging task, no matter what is the investment choice of his/her opponent and his/her realized return rate; on the other hand, if the player has RL as the realized return rate, the dominant strategy should be investing zero. By investing all in the challenging task, a player expects to receive p × 220+(1 − p) × 0 = 220p in the two-person competition game. On the contrary, by investing zero, the expected payoff of the player is equal to p × 0+(1 − p) × 0 = 220(1 − p). Therefore, regardless of the player's risk preference, she will choose to invest all in the challenging task if the risky environment carries a chance of realizing RH that is larger than 0.5 (i.e., p > 1 − p), to invest zero if the chance of realizing RH is less than 0.5 (i.e., p < 1 − p), and will be indifferent between investing all and investing zero if the chance of realizing RH equals 0.5 (i.e., p = 1 − p). Therefore, among three types of risky environment, we expect the largest share of subjects to choose to invest all under Environment A, followed by Environment B. Environment C is also expected to exhibit the greatest share of subjects who choose to invest zero.
Open Research
DATA AVAILABILITY STATEMENT
Our experimental data are not included in this submission, but we will make the data publicly available in case that this manuscript gets accepted for publication.
REFERENCES
- 1 When the job task, like the challenging one, bears uncertainty about the exact productivity of and thus momentary returns to the workers' effort input, we consider the task to be risky (even though the probability distribution of the relevant payoffs is clarified like a lottery). Hence a worker's ex ante decision on effort allocation becomes a risky investment because more effort input allocated to a risky task does not necessarily lead to a better outcome.
- 2 For example, a manager's willingness to take initiative and try on challenging tasks has a greater impact on the success of a company than that of a clerk, whose job consists chiefly of regular tasks.
- 3 For instance, Research and Development (R&D) work bears greater risk than routine administration work in terms of translating effort into output.
- 4 For instance, a CEO's effort in top-level decision making has a far greater effect, negative or positive, on a company's performance than that of a junior worker.
- 5 For example, effort in a highly creative job is expected to produce far more exciting successes than that in a less creative job, but the possible loss is also more detrimental. The success rate is also far lower in creative jobs.
- 6 To control for the order effects on individuals' decision making, we randomly assigned the order of the three different working environments for each subject.
- 7 Extant literature indicates a correlation between risky investments and demographics of a population. For example, Deakin, Aitken, Robbins, and Sahakian (2004), Booth and Nolen (2012), and Cameron, Erkal, Gangadharan, and Meng (2013) discuss the effects of age, gender, and being an only child on individual risk behaviors, respectively.
- 8 Central University of Finance and Economics has two campuses in Beijing. We recruited the subjects mainly from the main campus, which includes only seniors and postgraduates. Freshmen, sophomores, and juniors are all at the other campus. As a result, 74% of the participants from Central University of Finance and Economics are postgraduates.
- 8 We thank an anonymous referee for pointing out the necessity of clarifying our choice of subject pool.
- 9 Although student-sample is questioned for its generalizability (e.g., Falk, Meier, & Zehnder, 2013), it fits well for our study that requires subjects to have a good and quick understanding of the experimental set up with abstract output functions and various riskiness levels therein, in order to ensure the generalizability of our findings to real life workplace where workers learn about the riskiness of their working environment gradually.
- 8 In our experiment, we deliberately use the two-person tournament that, theoretically, is expected to stimulate zero effort input in the challenging task under the high-risk Environment C. In contrast, even with this extreme form of competitive scheme, we still find greater risky effort input under Environment C.