Trends in Oyster Populations in the Northeastern Gulf of Mexico: An Assessment of River Discharge and Fishing Effects over Time and Space
Abstract
Within the Big Bend region of the northeastern Gulf of Mexico, one of the least developed coastlines in the continental USA, intertidal and subtidal populations of eastern oyster Crassostrea virginica (hereafter referred to as “oyster”) are a critical ecosystem and important economic constituent. We assessed trends in intertidal oyster populations, river discharge, and commercial fishing activity in the Suwannee River estuary within the Big Bend region using fisheries-independent data from irregular monitoring efforts and publicly available environmental data. We used generalized linear models to evaluate counts of oysters from line-transect surveys over time and space. We assessed model performance using simulation to understand potential bias and then evaluated whether these counts were related to freshwater inputs from the Suwannee River and commercial oyster fishing effort and landings at different time lags. We found that intertidal oyster counts have declined over time and that most of these declines are found in inshore intertidal oyster bars, which are becoming degraded. We also found a significant relationship between oyster counts and a 1-year lag on mean daily Suwannee River discharge, but including commercial fishery trips or landings did not improve model fit. It is unclear whether declines in intertidal oyster bars are offset by formation of new oyster reefs elsewhere. These results quantify rapid declines in intertidal oyster reefs in a region of coastline with high conservation value that can be used to inform ongoing and proposed restoration projects in the region.
Many species of oysters of the family Ostreidae are globally recognized as a critical estuarine component as they provide important ecosystem and fishery benefits (Gutiérrez et al. 2003; Coen et al. 2007; Carranza et al. 2009; Grabowski et al. 2012). Large declines in oyster populations have been observed at global (Beck et al. 2011), continental (Zu Ermgassen et al. 2012; Alleway and Connell 2015), regional (Seavey et al. 2011; Wilberg et al. 2011, 2013), and local spatial scales (Pine et al. 2015; Grizzle et al. 2018). These losses have been widely documented, including localized extirpations in Australia (Alleway and Connell 2015) and large biomass reductions in the USA, particularly in the Chesapeake Bay and U.S. Gulf of Mexico regions, where the eastern oyster Crassostrea virginica is highly valued from cultural, fishery, and ecosystem service perspectives. The U.S. Gulf of Mexico region alone likely supports the world's largest remaining natural oyster reefs (Beck et al. 2011), and these reefs provide about 69% of the U.S. commercial wild eastern oyster harvest (2016 data, see NOAA Fisheries 2019). Florida has historically supported about 10% of this total, but following the collapse of the Apalachicola Bay oyster fishery in 2012 (Pine et al. 2015), this total has declined to about 5% of total U.S. landings (NOAA Fisheries 2019).
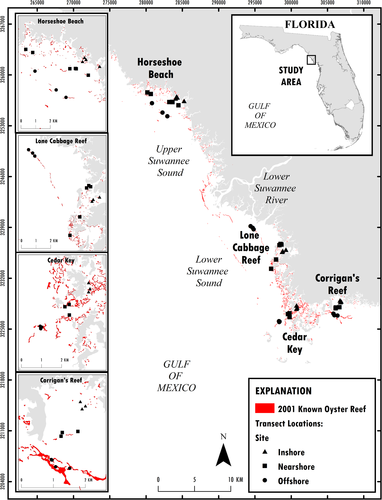
The Suwannee River estuary (Figure 1) is one of the least developed coastal regions in the continental USA as more than 30% of the land area and about 100 km of coastline is protected (Main and Allen 2007) and road and human population densities are among the lowest in Florida (Geselbrach 2007; Southwick Associates 2015). Loss of oyster reefs in this area is of conservation concern (Beck et al. 2000) as oyster reefs have large ecological and economic value. In this region, about 13% of private sector employment and 25% of all economic activity is related to natural resources (Southwick Associates 2015), including commercial shellfish harvest. Oyster reefs can form both intertidal and subtidal reefs. The Big Bend region is known for expansive intertidal reefs that occur in shallow water (<1 m deep) and are often exposed to air during low tide. These intertidal reefs serve important ecological and hydrological roles in the region. Kaplan et al. (2016) suggested that intertidal oyster reefs in the Big Bend region provide a keystone ecosystem service due to their physical orientation as linear chains parallel to the coastline. Because of this orientation, these reefs help to promote detention of freshwater and modulation of salinity to promote estuarine conditions (Kaplan et al. 2016). Likely because of the extremely low gradient of the Big Bend coastline, these parallel chains of reefs can be found in series (multiple parallel chains), which may reflect other shorelines at different sea levels. We define these parallel chains as inshore oyster reefs, which occur closest to the present shoreline, nearshore reefs, which are slightly further from shore, and offshore reefs as the furthest seaward reefs that face the open Gulf of Mexico. Bergquist et al. (2006) and Seavey et al. (2011) identified decadal changes in intertidal oyster reefs in this region. Seavey et al. (2011) used aerial imagery to document a 66% net loss in oyster area from 1982 to 2011, with offshore intertidal reefs experiencing an 88% loss, nearshore reefs a 61% loss, and inshore reefs a 50% loss. Reasons for intertidal oyster population decline in this area are unknown, but Seavey et al. (2011) proposed a relationship with changes in freshwater discharge from the Suwannee River leading to a cascading increase in the frequency of oyster mortality events, the eventual loss of nucleation sites for oyster spat, and an irreversible collapse of intact oyster reefs. Small-scale tests of restoring intertidal oyster reefs through construction of nucleation sites have suggested that nucleation sites are indeed limiting this population (Frederick et al. 2016; Kaplan et al. 2016), and larger restoration efforts are now underway. Here, we assess recent trends in intertidal populations of eastern oyster (referred to as “oyster” hereafter) in the Suwannee River estuary, an area of high conservation value in the Big Bend region of the northeastern Gulf of Mexico (Beck et al. 2000), using fisheries independent data from irregular monitoring efforts.
METHODS
Study site
The Suwannee River estuary in the northeastern Gulf of Mexico (Figure 1) can be divided into three subareas (Orlando et al. 1993), including the lower Suwannee River, upper Suwannee Sound, and lower Suwannee Sound. These shallow (<2 m) regions, fringed by coastal marsh, shell and sand substrate, and oyster bars, are bisected by the Suwannee River and generally bounded to the north by Horseshoe Point and to south by the town of Cedar Key (Orlando et al. 1993; Wright et al. 2005). State and federal partners manage most of the land surrounding the estuary and the 54-km tidally influenced reach of the Suwannee River as conservation land. Suwannee Sound is an open ocean-facing deltaic estuary (Orlando et al. 1993; Wright et al. 2005) and is heavily influenced by discharge from the Suwannee River, which provides about 60% of the inflow to the entire Florida Big Bend region (Montague and Odum 1997). Suwannee Sound is the largest estuary within the Big Bend region. The Suwannee River is undammed and free flowing (Benke 1990; Ward et al. 2005), but river discharge may be modified due to surface and subsurface water withdrawals within the basin (Mattson 2002). Water inputs are from extensive groundwater inflows from the Floridan aquifer and from surface water runoff from precipitation. Suwannee River discharge is a major factor influencing monthly, seasonal, and annual variation in salinity in Suwannee Sound (Orlando et al. 1993; Mattson 2002).
In many river basins in the USA, river discharge per unit rainfall has increased in recent decades due to watershed changes, such as conversion from forest to agriculture or increase in impervious surfaces. In the Suwannee River, discharge has declined per unit rainfall possibly due to increasing human use of surface and groundwater (Seavey et al. 2011) and changing climate (Swain and Davis 2016). Resulting decreased groundwater levels can impact human users in this region (Saetta et al. 2015), but ecosystem impacts are unknown. Climate reconstructions from dendrochronological records for this region suggest a much wider range of precipitation patterns in past centuries than has been observed in recent decades (Harley et al. 2017).
Data collection line transects
We selected four localities for sampling oysters, (Figure 1) with three in Suwannee Sound (Horseshoe Cove [near the town of Horseshoe Beach], Lone Cabbage Reef, and Cedar Keys [near the town of Cedar Key]) and one in Corrigan's Reef. At each locality, we designated linear groups of oyster reefs as inshore, nearshore, or offshore sites based on their orientation and relative distance from shore. We then randomly chose individual intertidal oyster reefs within each of these sites for sampling (generally three unique small reefs within each site and locality). At each of these sampling stations, we then established fixed locations on each oyster reef to conduct line transect sampling to estimate oyster counts and density. Oyster reefs were sampled when tidal heights were less than –0.84 m North American Vertical Datum of 1988 as measured at National Oceanic and Atmospheric Administration tidal station 8728520 (NOAA 2019). At this tidal height, intertidal oyster reefs in this area are dewatered, allowing visual counts of oysters with line transect surveys. Transect width was 15.24 cm, and transect length was the minimum width of the oyster reef at the tidal height of sampling. The starting point for the transect on the bar was randomly chosen using GIS. Permanent steel rebar posts (0.5 m) marked transect outlines for repeat visits, and GPS coordinates were recorded using a handheld GPS device. Live and dead oysters were then counted visually along each transect using handheld tally counters and recorded in 2.5-m intervals from the defined transect origin.
River discharge
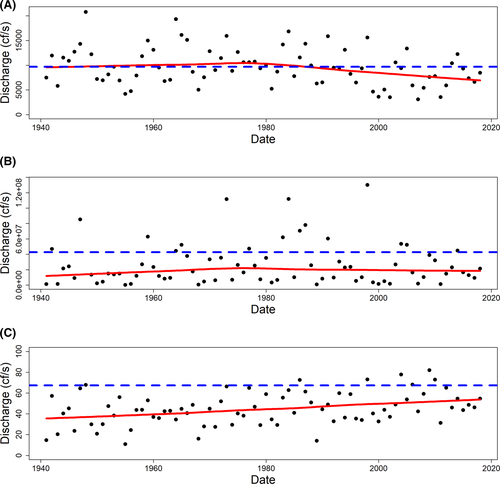
Because salinity in Suwannee Sound is influenced by Suwannee River discharge and oyster populations are an estuarine-dependent species, we summarized river discharge data using the Suwannee River U.S. Geological Survey (USGS) gauge 02323500 near Wilcox, Florida (USGS 2019). We used the longest continuous data records beginning October 1941 to July 2019 to show long-term trends and events in river discharge as a proxy for salinity and summarized river discharge (by convention as cubic feet per second) for each year as mean daily flow, the variance of daily discharge, and coefficient of variation (CV; 100 × SD/mean) of daily discharge. We also calculated these same metrics for the overall time series of data for the period of record. We included a locally weighted scatterplot smoothing line to aid in visually assessing trends in Suwannee River discharge metrics. We assessed how river discharge in the year of sampling, as well as a 1- or 2-year lag of river discharge, influenced oyster counts.
Commercial fishing and landings
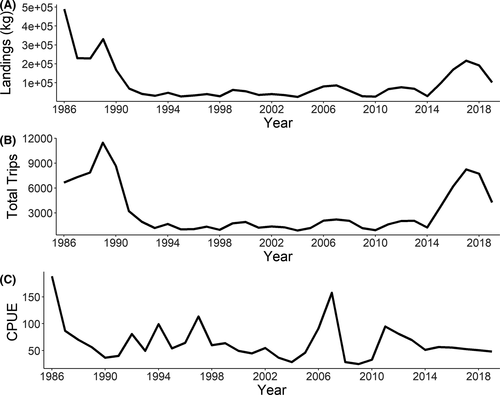
We categorized each site as either open or closed to commercial fishing based on harvest zones available from the Florida Department of Agriculture and Consumer Services (FDACS 2019). We included fishing as a factor in our analyses to assess whether being in a region open to fishing influenced oyster counts. To examine long-term trends in oyster landings and fishing effort, we obtained and combined annual oyster landings data (oyster meat weight and oyster fishing trips) for the three counties in the Suwannee Sound region (Taylor, Dixie, and Levy counties) from the Florida Fish and Wildlife Conservation Commission (FWC 2019) for 1986–2018. While landings data for oysters are available prior to 1986, the mandatory Trip Ticket reporting program was not implemented until 1986. We included the current year and a 1- or 2-year lag of oyster landings and oyster fishing trips in our analyses to assess whether oyster fishing effort in prior years influenced oyster counts.
Data analyses and generalized linear models
We tested whether the count data most likely followed a Poisson or negative binomial distribution. To assess the distribution of these data, we assumed that count data are discrete and examined the ratio between the variance of the counts and the mean count per site and graphical representations of predicted versus observed distributions of count data from each site. We then used generalized linear models (GLMs; Bolker et al. 2009) with a negative binomial distribution to assess oyster counts (dependent variable) over period (a time variable, a winter [November–April] or summer [May–October] period of time of equal length each year), locality (i.e., Horseshoe Beach, Lone Cabbage Reef, etc.), and site (inshore, nearshore, or offshore) (for sampling strategy, see Table S1 in the Supplementary Material available separately online). We assumed that total transect oyster counts were likely to increase with transect length, so we included transect length as an offset of effort (log link function; Zuur et al. 2009, 2013). Using effort as an offset changed the model from modeling counts to modeling a rate (count/area) as the response variable. Because each of our transects was a fixed width, area only changed as a function of transect length. Since these models have a log link, the equation is most simply described as log(count/transect length) = beta0 + beta1 × covariates, which can be rewritten as log(count) = log (transect length) + beta0 + beta1 × covariates. Additional advantages of using the actual counts versus converting the counts and area to densities is that the fitted values and confidence intervals do not contain negative values (Zuur et al. 2009). We used the best-fitting (lowest Akaike information criterion [AIC] value; Bolker 2008) model to predict oyster counts by period. All models were fit using the glm.nb function from the MASS package in R (Venables and Ripley 2002; R Core Team 2018).
We also developed a candidate set of models of biological interest to fit to these data. As an estuarine species, the role of salinity in influencing oyster recruitment and survival is of interest to resource managers (Turner 2006; Buzan et al. 2009; Fisch and Pine 2016). Oyster population status has been considered a metric for estuarine ecosystem health (Bergquist et al. 2006; Coen et al. 2007) and informative for setting minimum flow regulations in the Suwannee River basin (Farrell et al. 2005; Bergquist et al. 2006). We conducted exploratory analyses of how Suwannee River discharge (USGS gauge 02323500), as a proxy for salinity, nutrient inputs, and other factors, influenced counts on oyster reefs. We assessed how mean daily river discharge in the year of sampling or discharge with 1- or 2-year lags influenced oyster counts. All continuous covariates were centered (mean = 0, standard deviation = 1) using the scale function in R before including in each GLM. The Corrigan's Reef locality is closer in proximity to the Waccasassa River, a small (1,242-km2 watershed compared with 24,968 km2 for the Suwannee River) coastal river with low-elevation gradient. We were unsure whether climate-driven discharge patterns in the Waccasassa River were the same as those in the larger Suwannee River basin. River discharge information for the Waccasassa River (detrended to remove tidal influence; at USGS station 02313700; USGS 2019) is only available for approximately 10 years. We compared hydrologic patterns between the Waccasassa and Suwannee rivers and found generally similar patterns in discharge. We therefore used the Suwannee River discharge, a longer period of record, for all analyses.
We assessed whether oyster harvest affected oyster counts by examining whether an area was open or closed to oyster harvest and whether oyster landings, trips, or catch per unit effort for the given year, or with a 1- or 2-year lag, influenced oyster counts. The relationship between our response variable, oyster counts on intertidal oyster bars, and oyster harvest is complicated because oysters that grow on intertidal oyster reefs are generally smaller (below the minimum legal harvest size limit of 75.2 mm) than subtidal oysters and therefore are not traditionally targeted for harvest. However, these intertidal bars do produce some legal-sized oysters and are often adjacent to harvested subtidal bars. We have observed oyster harvest and culling on intertidal bars particularly in years with high oyster demand (W. E. Pine, personal observation). Oyster harvest in prior years may influence oyster counts because oyster harvest removes, disturbs, and fragments shells on oyster reefs. Oyster shells are the dominant substrate on which larval oyster spat settle and recruit; thus, harvest could reduce recruitment due to loss of settlement substrate (Powell and Klinck 2007; Pine et al. 2015) and modification of vertical structure. We used a forward selection process where we fit each parameter individually and then retained statistically significant factors (P < 0.05). Final model comparison was then made with AIC when appropriate.
Model assessment
To assess the “informativeness” of our GLM approach (as a type of power analyses; Bolker 2008), we generated 1,000 replicate datasets (resampling with replacement) of oyster counts by locality, site, and period and fixed transect length to the transect length used at each oyster reef in the original data. To simplify simulations, we did not simulate data for the covariates of river discharge or fishery landings. We then fit the best-fitting (lowest AIC) model without covariates to these data and assessed (1) how many of these 1,000 simulations had a negative beta coefficient for period (indicating a decline in oyster counts over time) and (2) the distribution of P-values for the period beta coefficient. This was done to assess how likely we were to detect both the sign and the significance of a change in oyster counts over period (time) if one were to occur.
RESULTS
Trends in Suwannee River Discharge
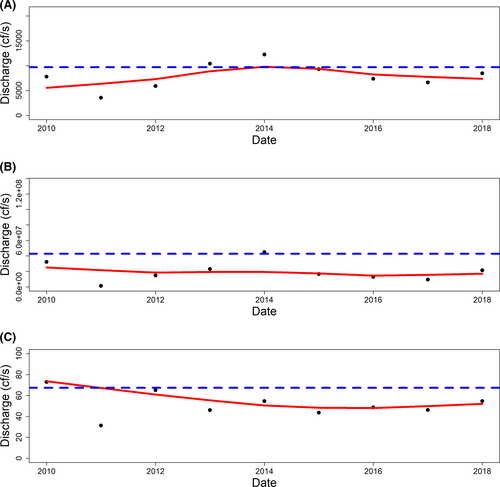
We found generally declining trends in mean daily discharge, stable trends in daily discharge variance, and increasing trends in the CV of daily discharge (a measure of volatility) since October of 1941 (Figures 2, 3). Since 2010, mean daily discharge has been below the 1941–2018 average in 6 of the last 9 years, near average for 2 years, and above average for 1 year (Figure 3).
Commercial Fishing and Landings
During 2010–2019, commercial oyster landings, trips, and catch per trip were variable, with a large increase in landings and trips in 2016 and then a decline in 2017 (Figure 4). This increase in landings and trips equaled the third highest value for the 1986–2019 time period (with the other high values recorded in the late 1980s and mid-2000s; Figure 4). Catch per trip has generally trended down since 2010 (Figure 4).
Evaluating Distribution of Data
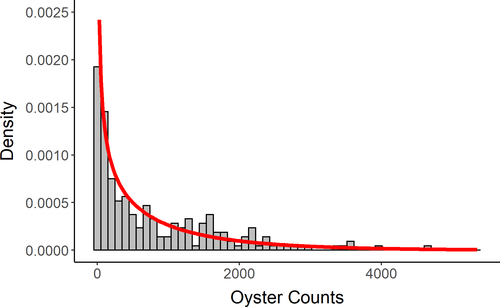
Based on (1) our use of count data, (2) variance of oyster counts exceeding the mean, (3) high dispersion, and (4) visual assessment of observed oyster counts versus predicted counts based on a negative binomial distribution (Figure 5), we concluded a negative binomial distribution to be a reasonable fit to the observed data and used this distribution for each GLM.
Analyses of GLMs
For our simulations, we found that our best-fit model without covariates, period × locality + site + offset[log(transect length)], was informative both in terms of the direction (Figure S1 in the Supplementary Material available separately online) and significance (Figure S2) of the beta terms. Of our 1,000 simulated data sets, all (100%) had a negative beta parameter for period, indicating a decline in oyster counts. We also found that the distribution of P-values was generally centered around 0.03 (Figure S2), which was higher than the P-value estimated for the original data (P = 0.005). Of the 1,000 simulations, 847 P-values were less than alpha = 0.05 (85%). These results suggest that our model is informative and reliable in detecting change in oyster counts over time.
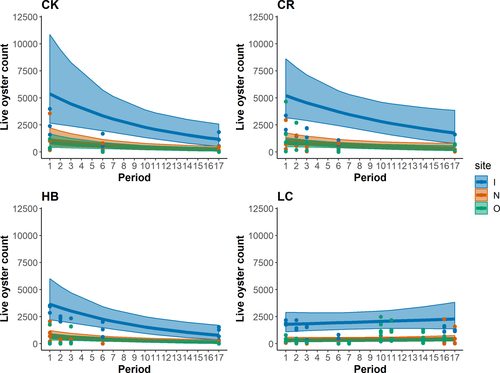
The top GLMs (lowest AIC) included a combination of period, site, and locality as additive or interaction terms, and these models were very similar in AIC value (Table 1; delta AIC = 1.68 across top three models). The top model, period × locality + site + offset[log(transect length)], allowed for a unique slope by period and locality. We found oyster counts to differ across time (P = 0.000676; Table 2; Figure 6), and we found that nearshore sites differed from inshore sites (P < 0.01; Table 2; Figure 6). We found a locality effect only for Lone Cabbage Reef (P < 0.01; Table 2). Adding covariates of biological and management interest to this model improved fit (Table 3), and the best fit was found with a 1-year lag on mean daily discharge. A simple ANOVA between the top model with and without a river discharge covariate was significant (P < 0.01). Including mean daily discharge in the model again led to significant period and site effects, with Lone Cabbage Reef being the only locality effect, while mean daily discharge was highly significant (P < 0.01; Table 4). Including landings, trips, or open or closed harvest status as a category was not an improvement in model fit over including river discharge alone.
| Model | Number of parameters | AIC | Delta AIC | AIC weight |
|---|---|---|---|---|
| Period × locality + site | 11 | 3,185.65 | 0.00 | 0.94 |
| Period + site | 5 | 3,192.36 | 6.71 | 0.03 |
| Period + locality + site | 8 | 3,193.41 | 7.76 | 0.02 |
| Period × site | 7 | 3,196.27 | 10.62 | 0.00 |
| Period + locality × site | 14 | 3,196.62 | 10.97 | 0.00 |
| Period × site + locality | 10 | 3,197.27 | 11.63 | 0.00 |
| Period + locality | 6 | 3,259.43 | 77.78 | 0.00 |
| Period | 3 | 3,263.49 | 77.84 | 0.00 |
| Period × locality | 9 | 3,263.51 | 77.86 | 0.00 |
| Parameter | Estimate | SE | z-value | Pr(>z) |
|---|---|---|---|---|
| Intercept | 5.18 | 0.38 | 13.57 | <0.01 |
| Period | −0.10 | 0.03 | −2.79 | 0.005 |
| Nearshore site | −1.57 | 0.21 | −7.38 | <0.01 |
| Offshore site | −1.85 | 0.21 | −8.99 | <0.01 |
| Corrigan's Reef | −0.06 | 0.43 | −0.14 | 0.89 |
| Horseshoe Beach | −0.38 | 0.43 | −0.89 | 0.37 |
| Lone Cabbage Reef | −1.21 | 0.42 | −2.87 | <0.01 |
| Period: locality Corrigan's Reef | 0.03 | 0.05 | 0.60 | 0.55 |
| Period: locality Horseshoe Beach | −0.001 | 0.05 | −0.02 | 0.98 |
| Period: locality Lone Cabbage Reef | 0.11 | 0.004 | 2.76 | <0.01 |
| Covariate description | Number of parameters | AIC | Delta AIC | AIC weight |
|---|---|---|---|---|
| Mean annual daily discharge with 1-year lag | 12 | 3,154.37 | 0.00 | 0.50 |
| Annual landings with 2-year lag | 12 | 3,175.76 | 21.38 | 0.00 |
| Annual discharge year of count | 12 | 3,176.98 | 22.61 | 0.00 |
| Annual trips with 2-year lag | 12 | 3,178.02 | 23.64 | 0.00 |
| Annual landings year of count | 12 | 3,178.90 | 24.53 | 0.00 |
| Annual trips year of count | 12 | 3,184.47 | 30.10 | 0.00 |
| No covariates | 12 | 3,185.65 | 31.27 | 0.00 |
| Harvest in year of count | 12 | 3,185.86 | 31.49 | 0.00 |
| Annual discharge with 2-year lag | 12 | 3,186.51 | 32.13 | 0.00 |
| Annual trips with 1-year lag | 12 | 3,186.89 | 32.51 | 0.00 |
| Landings with 1-year lag | 12 | 3,187.05 | 32.68 | 0.00 |
| Parameter | Estimate | SE | z-value | Pr(>z) |
|---|---|---|---|---|
| Intercept | 5.59 | 0.37 | 15.23 | <0.01 |
| Period | −0.12 | 0.03 | −3.84 | <0.01 |
| Nearshore site | −1.67 | 0.20 | −8.33 | <0.01 |
| Offshore site | −2.15 | 0.20 | −11.03 | <0.01 |
| Corrigan's Reef | −0.16 | 0.41 | −0.40 | 0.69 |
| Horseshoe Beach | −0.60 | 0.41 | −1.47 | 0.14 |
| Lone Cabbage Reef | −1.52 | 0.40 | −3.80 | <0.01 |
| Mean daily discharge with 1-year lag | 0.56 | 0.08 | 6.88 | <0.01 |
| Period: locality Corrigan's Reef | 0.04 | 0.04 | 0.99 | 0.32 |
| Period: locality Horseshoe Beach | 0.01 | 0.04 | 0.22 | 0.83 |
| Period: locality Lone Cabbage Reef | 0.12 | 0.04 | 3.21 | 0.001 |
DISCUSSION
We documented declines in intertidal oyster reefs over an 8-year period in a region of the U.S. Gulf of Mexico that has low human population density, large areas of protected coastal and submerged lands, and regulated oyster harvests all factors that suggest high likelihood of viable oyster populations compared with other regions within the native range of oysters. Declines in oyster populations and the loss of associated ecosystem services and fishery resources in this region is therefore of significant conservation concern. Causal factors for oyster population declines across their range are often not clear owing to complex interactions between fishery harvests (Wilberg et al. 2011), oyster habitat (Wilberg et al. 2013; Pine et al. 2015), changes in water quality and quantity (Seavey et al. 2011; Fisch and Pine 2016), disease dynamics (Powell et al. 1992), temperature (Sehlinger et al. 2019), and other unknowns. The effect of these factors can be amplified in multiple and uncertain directions by changing climate (Mulholland et al. 1997; Gazeau et al. 2007; Miller et al. 2009), interactions between these variables, and associated sea level rise.
In our assessment, we found a relationship between mean daily discharge 1 year prior and intertidal oyster population counts (Table 4; Figure 7). The reported relationships between river discharge and oyster population responses are various, complicated, and unclear from ecological, management, and legal perspectives (Buzan et al. 2009; La Peyre et al. 2009; Fisch and Pine 2016; Florida v. Georgia 2018). The growth and survival of oysters has been observed to be higher in intermediate salinities; thus, these variables can be responsive to flood, drought, or other factors influencing river discharge (Lowe et al. 2017). These same conditions may also influence the likelihood of mortality from disease (La Peyre et al. 2003, 2009) or marine predators and parasites (Kimbro et al. 2017; Pusack et al. 2019), which may reinforce negative effects due to physiological costs of inappropriate salinities.
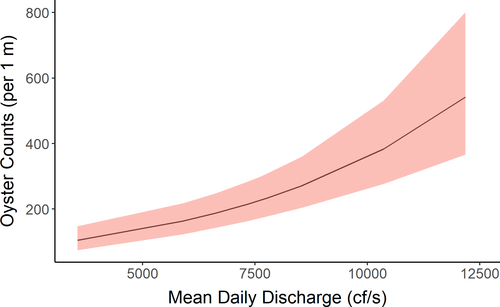
While we found a positive relationship between mean daily discharge and intertidal oyster counts 1 year later, this does not mean that higher river discharge universally leads to more oysters. During 2010–2019, we observed years with low discharge and periods of high discharge were infrequent. Because of this restricted observed range of discharge during our period of oyster sampling, we could not document the relationship between higher average discharge and oyster counts. Figure 7 must be carefully considered (as it may be misleading) as there are many factors in addition to river discharge that could be limiting factors for oyster populations. Indeed, higher river discharge levels can lead to lower salinity and lower spat production (Chatry et al. 1983) for many of the same reasons (e.g., physiological stress) that high salinity can be deleterious (Kimbro et al. 2017; Pusack et al. 2019). Thus, the relationship between river discharge and oyster counts is not universally representative across all discharge values and is highly dependent on other factors, including availability of suitable substrate.
This paper demonstrates a relationship between river discharge and oyster counts, but freshwater inputs are just one of several factors likely necessary for resilient oyster populations. A key limiting factor for oyster spat distribution in Suwannee Sound is the availability of suitable substrate for oyster spat settlement and growth (Frederick et al. 2016). Frederick et al. (2016) demonstrated this in a small pilot project in which the placement of limestone boulders on a section of the degraded Lone Cabbage oyster reef led to increased oyster spat and oyster recruitment on the reef site. This demonstrates the necessity of having suitable substrate for oyster spat settlement and reef growth, which is at present being tested on a larger scale and may be important in other Florida estuaries (Pine et al. 2015). Overall, the limiting factors for oyster reef creation, persistence, collapse, restoration, and recovery remain unclear.
Oyster disease, parasites, and predators have existed in this (and other) systems for much longer than the discharge period of record (~60 years) available for the Suwannee River. Climatological assessments over the scale of centuries suggest that the Suwannee River basin overall has experienced periods of much drier conditions (Harley et al. 2017), particularly during the 16th and 18th centuries, with river discharge likely less than 20% of the mean estimated from the instrument period of record yet oyster populations survived in this region. Oyster reefs in and around Lone Cabbage Reef have persisted for 2,800–4,000 years (Grinnell 1972; Wright et al. 2005), including through a time of coexistence with extensive human occupation and oyster harvest (Sassaman et al. 2017). One key concern is that while oyster populations may have recovered historically from episodic mortality due to drought, disease, or other factors, this resilience may have declined. Examples of resilient processes would include buffering of salinities by reef structures (Kaplan et al. 2016), recolonization through oyster metapopulation dynamics (Puckett and Eggleston 2016), or presence of a large, persistent capital of settlement substrate (Pine et al. 2015). If resilience has declined in Big Bend oyster reefs and disturbance continues to occur, these conditions may foment an increased risk of hysteresis where multiple “states” (i.e., persistent low abundance) of oyster populations may exist across similar environmental conditions. Modeling efforts by Pine et al. (2015) suggest that in the absence of suitable substrate for settlement and growth, even with “average” recruitment levels of Apalachicola Bay oysters, populations were not predicted to reverse declining population trends. Given the recent, rapid collapse of oyster populations across many Gulf of Mexico estuaries, the loss of resilience is of central ecological and management concern. This study demonstrates that even with relatively few anthropogenic stressors in a highly protected coastal environment, oyster populations may be at risk of rapid change.
Our assessment of trends in Suwannee River discharge metrics over the instrument period of record suggests increasing volatility in river discharge (CV) and an overall downward trend in mean river discharge. The reasons for these trends are unknown, but an examination of trends in the Palmer Drought Severity Index for the southeast Georgia and north Florida regions covering the Suwannee River basin suggest drought has occurred several times in this region since 2010 (Figure S3A). There is also evidence that the discharge/rainfall ratio has been declining (Seavey et al. 2011) or that evapotranspiration is increasing (or both) possibly influencing temporal trends in discharge. The relationship between frequency and severity of drought and oyster reef resilience is an important area of future research.
We were unable to determine an age structure for these oyster populations, so we do not know if oyster counts represent multiple oyster year-classes. This is important because it would help to determine whether lower counts are a function of year-class failure in the year of low river discharge or if multiple year-classes were affected. Other than the irregular monitoring effort we report here, fishery-independent data for oyster populations in Suwannee Sound are absent. Since we only sampled intertidal reefs, we also do not know if these dynamics extend to intertidal and subtidal oysters of multiple age-classes and sizes that may be affected by these same factors. Our only other line of inference for both intertidal and subtidal population trends over this time are from commercial oyster fishery landings data. These data suggest overall declines in landings and catch per effort that coincide with the implementation of the Trip Ticket program in 1986. Over the same time period as these monitoring efforts, oyster landings and effort have increased and catch per unit of effort has generally declined. In our study, neither harvest status (open or closed) nor annual landings or effort influenced oyster counts; therefore, interpretation is tenuous because, due to lacking data, it is unclear how much harvest occurs on intertidal reefs even in areas open to harvest. In addition to traditional harvest, state-funded programs that relocate oysters from intertidal to subtidal areas (“relay”) have been used as an approach to increase oysters available for harvest in our study area. The net effect of both traditional harvest on legally open reefs and directed harvest through relay programs on closed reefs is unknown. The effects of fishing on oyster populations both through direct harvest or indirect effects (i.e., discard mortality, loss of spawning stock biomass or shell area) is an area requiring substantial future work.
Seavey et al. (2011) documented large declines of about a 66% net loss in oyster reef area in the Suwannee Sound region from 1982 to 2011. This work documented the highest declines in offshore reefs, with about an 88% decline, followed by nearshore reefs (61% decline), and then inshore reefs (50% decline). Our oyster density results over time and space also show declines in oyster counts, with the largest declines occurring in inshore areas, which may be becoming more like offshore and nearshore regions based on counts (Figure 6). What is not known is whether these inshore losses are offset by the formation of new reefs elsewhere, although this could possibly be assessed through satellite, drone-based, or other surveys (Grizzle et al. 2018; Windle et al. 2019). Seavey et al. (2011) reported the inland colonization of a salt marsh by oysters in inshore areas of Suwannee Sound, but those increases did not offset net losses experienced in nearshore and offshore reefs. Successional habitat processes have been observed in this region with the conversion of coastal forest to marsh, as well as loss of coastal forest communities over the course of decades (Geselbracht et al. 2011; Raabe and Stumpf 2016). At longer time scales, oyster reef distribution along the west coast of Florida has been shown to be quite dynamic in time and space, with Locker et al. (2016) documenting fossilized oyster communities now inundated by 116–135 m of water along the west-central Florida shelf. Hine et al. (1988) described the complex interactions between geology, currents, and the formation and persistence of oyster reefs along the west coast of Florida and suggested that seaward oyster reefs are most susceptible to degradation due to higher salinity levels, marine predators, and wave action. These predictions were supported by Wright et al. (2005), who identified that most of the oyster bars in Suwannee Sound developed from deltaic sediment deposits. Seavey et al. (2011) showed that once an oyster reef degrades to the point of losing the covering of shell, the likelihood of that reef reforming and persisting is very low, at least over a period of a decade. This scenario was reinforced by the findings of Frederick et al. (2016), who showed experimentally that the addition of limestone substrate to the degraded Lone Cabbage Reef resulted in a rapid and substantial recruitment of oysters.
Implications
Our findings suggest that landscape-level factors, including trends in river discharge, likely influence intertidal oyster populations, but the mechanisms are not known. From a freshwater management perspective, river-basin-level planning efforts in terms of minimum flows and levels are in place or underway to inform water management decisions within the Suwannee River basin (Suwannee River Water Management District 2019). Long-term forecasts of water demand in areas near the Suwannee River basin and across north Florida and southeastern Georgia suggest increased demand and lower ground water levels (see https://northfloridawater.com/). In both cases, the time horizons for decision making and implementation of large-scale water infrastructure projects is likely longer than the time scale (<10 years) documented here of oyster population change in Suwannee Sound. At shorter monthly or annual time scales, there is potential for expanded restoration actions that would possibly both increase oyster populations by providing substrate and at the same time reduce loss of freshwater through coastal impoundment (Frederick et al. 2016). However, these restoration programs are expensive (more than US$1 million per kilometer for construction and monitoring in Suwannee Sound) and seem unlikely at least at the scale of restoration needed to replace estimated losses of oyster habitat. At century time scales, sea level rise may negate many short-term benefits of reef restoration because reefs may become inundated with higher salinity water. Observed sea level rise in this region based on a 100-year record is on average about 2.13 mm/year (95% CI = 1.95–2.31 mm/year; Figure S3B) but the observed rate in recent years is higher (Figure S3B). Simply put, restoration efforts could be swamped by a rising sea level regardless of river discharge conditions.
There are at least two options going forward from a management perspective. One option is to evaluate ongoing restoration efforts (Frederick et al. 2016), and if these are successful, work to implement similar programs at larger spatial scales to replace substrate and ecosystem function that is being lost with declining oyster reefs. The second is to assess whether this landscape is simply undergoing a successional process as has happened in the past. This succession could involve the migration of oyster reefs following changes in sea levels as they have occurred previously (Locker et al. 2016; Sassaman et al. 2017) but perhaps now at a faster rate and with people recording observations in close to real time. Given large areas of undeveloped public land and low shoreline gradient in this region, the potential certainly exists for migration of oyster habitat into what is at present inland areas. However, this migration would occur at the cost of these inland habitats which may be inevitable under several sea level scenarios (Geselbracht et al. 2011). These types of decisions, to implement restoration for short-term gain to delay long-term losses due to sea level rise, are among the most complicated management decisions to be addressed in both the natural and built environments in upcoming decades.
ACKNOWLEDGMENTS
We acknowledge the assistance of J. Beckham, L. Adams, and G. Simms for sharing their knowledge of oyster fisheries and ecology in this region. We are appreciative for assistance with sampling by a large group of dedicated volunteers. Funding for this manuscript was provided by the National Fish and Wildlife Foundation to P. Frederick, W. Pine, and L. Sturmer. This is paper 1 in the Lone Cabbage Reef Restoration series. Any use of trade, firm, or product names is for descriptive purposes only and does not imply endorsement by the U.S. Government. There is no conflict of interest declared in this article.


