Controlling the weld penetration depth of laser beam micro welding by using an iterative learning approach
Steuerung der Einschweißtiefe beim Laserstrahl-Mikroschweißen mit Hilfe eines iterativen Lernansatzes
Abstract
enIn order to meet the increasing demand for high-speed joining processes, laser beam micro welding is used to reproducibly weld metallic joining partners such as steel. Long weld seams or high cycle speeds, however, remain a challenge to achieve a constant welding depth throughout the entire welding process without major fluctuations. This paper shows the development and evaluation of a weld penetration depth control system based on interferometric measurement of the depth of the vapor capillary. High path speeds and small weld depths are challenging for real-time depth control. Therefore, the offline data of the interferometric measurements are used to implement an iterative learning control of the weld penetration depth. The quality of the control is verified by welding with and without spatial power modulation on 1.4301 steel while following a linear and sinusoidal trajectory.
Translation abstract
deUm der steigenden Nachfrage nach Hochgeschwindigkeits-Fügeverfahren gerecht zu werden, wird das Laserstrahl-Mikroschweißen eingesetzt, um metallische Fügepartner wie Stahl reproduzierbar miteinander zu verschweißen. Bei langen Schweißnähten oder hohen Taktgeschwindigkeiten bleibt jedoch die Herausforderung bestehen, eine konstante Einschweißtiefe über den gesamten Schweißprozess ohne größere Schwankungen zu erreichen. Dieser Artikel zeigt die Entwicklung und Evaluierung einer Einschweißtiefenregelung, die auf der interferometrischen Messung der Tiefe der Dampfkapillare basiert. Hohe Bahngeschwindigkeiten und kleine Einschweißtiefen stellen eine Herausforderung für die Tiefenkontrolle in Echtzeit dar. Daher werden die Offline-Daten der interferometrischen Messungen verwendet, um eine iterativ lernende Regelung der Einschweißtiefe zu implementieren. Die Qualität der Regelung wird durch Schweißen mit und ohne örtliche Leistungsmodulation auf Stahl 1.4301 verifiziert, wobei eine lineare und sinusförmige Trajektorie verfolgt wird.
1 INTRODUCTION
The use of laser beam welding offers an immediate answer to the increasing demand for reliable and precise joining of different materials such as metals. The use of lasers brings both functional advantages for joining, such as non-contact and precise heat input, as well as economic advantages. These include high flexibility, short process times, good accessibility and a high degree of automation with simultaneously high demands on reproducibility of the weld seam quality and weld penetration depth 1.
The selection of the correct laser beam source can thereby fall on lasers with a high brilliance in order to obtain a sufficient intensity on the workpiece for material processing. These lasers make it possible to produce joined structures in the micrometer range by focusing the laser beam to a spot diameter smaller than 50 μm. As a result, the energy is applied precisely to the welding zone. After local melting of the material and exceeding a threshold intensity level, the transition from heat transfer welding to deep penetration welding is achieved 2.
The monitoring and quality control of the welding process is an important aspect of the use of laser beam welding in modern production systems. They represent a necessary process interface to keep the production results within deterministic limits 3. The monitoring of the welding process and the subsequent quality evaluation can be divided into three groups of investigations addressing laser beam welding: pre-process, process-simultaneous and post-process. The pre-process method focuses on tracing the seam path and checking the geometry of the workpiece 4. The process-simultaneous monitoring is done by looking at the plasma emissions, the acoustic emissions, the behavior of the melt pool and the stability of the vapor capillary 5. The post-process methods of monitoring the welding process focuses on visual inspections and metallographic evaluation of the weld geometry. In this way, the potential weak points of the produced welds can be identified and their weak points can be addressed to meet the needed quality requirements 6.
In the context of process-simultaneous monitoring of laser beam welding, optical coherence tomography has proven as promising technology and investigations show, that the method is suitable for real-time determination of the weld penetration depth 7. In optical coherence tomography, a laser beam is split into two parts by a beam splitter: the reference beam and the measurement beam. After reflection of the beams at the surfaces, these beams are brought to interference and the length difference between the surface and the depth value of the vapor capillary is calculated 8. By measuring the depth of the vapor capillary and reusing this information, a control algorithm can be designed to reduce process fluctuations, which brings several advantages. First, full control over the weld penetration depth is obtained. This is particularly relevant for those applications where the weld penetration depth is a critical parameter, including the welding of battery cells or the welding of thin-walled components. Secondly, when a closed-loop control is used, the laser power is automatically adjusted based on the calculated deviation between the target curve and the measured value of the weld penetration depth. In the literature, several experiments have already been carried out in this regard, in which machine learning algorithms, keyhole mapping or fuzzy controls are used to set the laser parameters. The main focus of these tests was the analysis of aluminum, where fixed optics were used to produce a linear weld seam 9, 10. Within the scope of this work, the experiments are to be extended in order to transfer the control to oscillating welding strategies for the processing of steel. With this tool, the adjustment effort for determining the welding process parameters can be reduced and potentially a compensation of the welding depth variation in welding processes with spatial power modulation can be achieved.
Within the scope of this research article, a welding depth control for laser beam micro welding is developed based on the interferometric measurement of the depth of the vapor capillary when using a welding strategy with also spatial power modulation. Furthermore, it will be verified, whether the welding depths measured in real time can also be made available to the other components of the system for processing via the measuring arrangement as information that can be processed in real time, too. Based on the dynamic system data, the algorithm of an iterative learning control is implemented for welding depth control in laser beam micro welding. The purpose of this iterative approach is to compensate for the system's lack of real-time capability in the described setup. Here, the offline data of the interferometric measurement of the weld penetration depth are used. Afterwards, the suitability of the implemented control approach is verified by creating blind welds in stainless steel 1.4301 for laser beam welding without and with local power modulation. The control is tested by predefining a line and sinusoidal reference trajectory of the weld penetration depth and the metallographic control of the final results. Finally, the influence of the algorithm on the quality of welding process is evaluated and the control quality is assessed based on the remaining control deviation after the individual iteration steps.
2 EXPERIMENTAL SETUP AND PROCEDURE
As a laser beam source, a YLR-1500-SM (IPG Photonics Corporation, Oxford, Massachusetts, United States of America) fiber laser is used. The laser power can be set by an electrical input voltage between 0 V–10 V correlating to 0–100 % laser power. This allows the voltage to be modulated during laser welding with a maximum frequency of 50 kHz. For the deflection of the laser beam, a mid-power scanner system (IPG Photonics Corporation, Oxford, Massachusetts, United States of America) is used. The focal length of the collimation is 50 mm and the laser beam is coupled out through a lens with a focal length of 160 mm resulting in a measured beam diameter of 44 μm.
The mid-power scanner for deflecting the laser beam is controlled via an RTC5 card (SCANLAB GmbH, Puchheim, Germany). To monitor the laser beam welding process, an LLD-700 measurement system (IPG Photonics Corporation, Oxford, Massachusetts, United States of America) is used. Thereby, the system uses the measurement principle of inline coherent imaging with a maximum sampling rate of 250 kHz. The LDD-700 system consists of a mid-power galvanometer scanner, an optical module for splitting the light beam into reference and measuring beams, a 3D module for three-dimensional imaging, a main control unit and a control computer. The measurement with the LDD-700 is carried out with the help of the inline coherent imaging principle. The measuring light is generated in the main control unit, which is split into reference and measuring beam in the optical module. After the measuring beam is reflected by the workpiece surface, an interference pattern is created between the reference and measuring beam, which is evaluated by the main control unit. Finally, a path length difference is calculated. A major advantage of the system is the 3D-module, which includes an additional scanner that allows the positioning of the measuring beam precisely inside of the vapor capillary during the welding process. The process-simultaneous output of the measured values takes place exclusively via the analog outputs. For post-process analysis, the recorded data of the selected weld parameters are processed via a control computer and made available as a csv-file.
Using measuring arrangement for the iterative learning control, post-process information on the depth of the vapor capillary is analyzed from the csv-file and the system structure is supplemented by a computer with a data acquisition card (DAQ-2501, ADLINK Technology Inc. Taoyuan City, Taiwan) for the modulation of the laser power. The complete history of the laser power is determined using a MATLAB script based on the weld penetration depth measurement from the csv-file. Then, the course of the laser power is converted into the course of the voltage and made available to the data acquisition card. For the system tests, stainless steel X5CrNi18-10 (1.4301) of thickness 1.5 mm is used. To reduce the noise during the measurement of the welding depth with the LDD-700, nitrogen is used as the shielding gas.
In the development of a real-time capable weld penetration depth control for laser beam welding, the sampling rate needs to enable active influencing of the weld penetration. Thereby, the term real-time refers to the ability of the system to guarantee the processing of data within a defined, recurring sampling step. In the case of control systems, the measurement and the numerical processing of the controlled variable as well as the final calculation and output of the manipulated variable for the further sampling step take place during one sampling step 11. Based on this definition, the measurement of the welding depth needs to fulfill two conditions. First, the result of the measurement must be available in real time. Secondly, the measurement is performed at a correspondingly high sampling rate that captures the essential dynamics of the welding process. At this point, the real-time capability of the LDD-700 to output weld depth information is examined.
The voltage of the analog output of the LDD-700 is +2 V in the idle state and the welding process is triggered at time t=0 s, with the jump of the Laser-On signal from 0 V to +5 V. From the recorded characteristics, the signal of the LDD-700 continues to stay in idle for a delay time of ΔT=19.16 ms. The measurement of the delay is repeated for further welding processes and an average value is formed, which is 29.74 ms with a standard deviation of 10.23 ms for 6 consecutive measurements. Following, the use of the LDD-700 as a measuring element in a real-time capable system for weld penetration depth control for laser beam microwelding is not purposeful for two reasons. On the one hand, the information about the weld penetration depth is not synchronous and not available for constant sampling steps because of the occurring, strongly fluctuating delay and different values for the successive time steps. On the other hand, by looking at the specific values, the conclusion is drawn that the process-simultaneous measurement is not able to capture the essential dynamics of the welding process. For this reason, the iterative learning control was implemented which is discussed subsequently and relies on the use of the data acquisition card.
The sampling rate of the data acquisition card is fixed at 50 kHz. This means that a single sampling step takes 20 μs. The mean value of the delay from six repeated measurements is 20.376 μs and the measured values are distributed with a standard deviation of 0.0062 μs. This indicates very high reproducibility of the voltage output and the consistency of the delay suggests that the modulation of the laser power, and hence the welding process, takes place with a high degree of reproducibility. This property is particularly advantageous for the post-process analysis of the weld penetration depths and the development of the iterative learning approach. Considering the time-discrete character of the data acquisition card and the stepwise processing of the inputs and outputs, the assumption is made that the average delay results directly from the selected sampling steps (20 μs). Thus, the reaction to the laser-on signal takes place at the earliest possible sampling step. In contrast to the investigated behavior of the LDD-700 at the output of the analog signal, the data acquisition card allows a real-time capable system. Due to the time-synchronous detection of the trigger signal and the subsequent time-synchronous modulation of the voltage, the characteristic feature of real-time capability is fulfilled. The welding depth control for laser beam microwelding is therefore adapted under the approach of an iterative learning control, Figure 1 12.
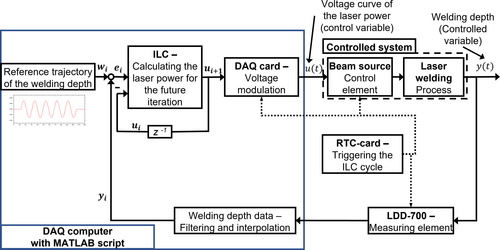
Course of a cycle of iterative learning control with welding depth control for laser beam micro welding.
Here, the course of the control variable u(t) is initialized for the beam source. The modulation of the voltage takes place via the data acquisition card with a fixed sampling rate. The initialization starts with the output of the trigger signal via the real-time clock (RTC) card. This is the first recording of the weld penetration depth (the controlled variable) with the LDD-700 (the measuring element). Thus, the first iteration of the iterative learning control begins. After the completion of the initial welding process, the weld penetration data of the first cycle are prepared on the LDD-700 control computer. The data acquisition card computer is responsible for a large number of activities required for the realization of an iterative learning control. The activities are managed in a MATLAB environment. First, the weld penetration data are filtered from the csv-file. In this process, the time intervals between the weld penetration depth data are not equidistant. This creates the need to interpolate the weld depth data so that the temporal resolution matches the frequency of the modulation of the future control variable. Consequently, the filtered and interpolated weld penetration data is stored in the memory as a vector. Then, based on the vector of the reference weld penetration depth (reference variable) and the vector of the measured weld penetration depth (controlled variable), the vector of the control deviation is determined. Further, the vector of the laser power is calculated for the further iteration following the learning law 12. Afterwards, the new laser power is made available to the data acquisition card, which completes one iteration. The processing of the measured data is performed using multi-stage filtering and subsequent interpolation. First, the general trend of the data is determined and interpolated with equidistant time steps. Using the Savitzky-Golay filter, the influence of noise in the interpolated data is reduced. Finally, the data are additionally smoothed with a repeated use of the filter and visualized, Figure 2.
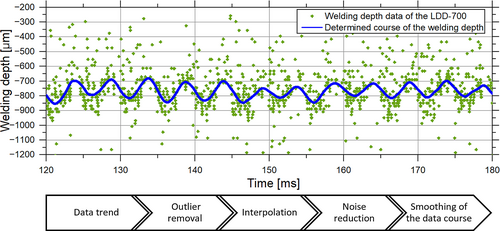
Result of the processing of the weld penetration data of a welding process with spatial power modulation.
An approach of iterative learning control can be defined as a function of the learning law, thereby describing the creation of the vector in the next iteration. In this paper, the learning law is realized with the PD-ILC (proportional differentiating iterative learning control) approach and with usage of an update equation 12. The entries of the learning matrix are responsible for the converging behavior of the learning matrix. The constant cycle time TC results from the total process time minus the start and end offsets. Thus, the course of the manipulated variable u(t) for the entire welding process results from the sum of the partial curves in the different phases of the welding process. The introduction of TOffsetStart and TOffsetEnd serves a dual purpose. On the one hand, this limits the effects of the control on the stable range of the welding process. On the other hand, after the course TOffsetStart, the almost identical initial states are reached via further iterations of the iterative learning control. Thus, a condition for the iterative learning control is fulfilled 12.
Another condition for using an iterative learning control is cyclicity, which means that the control is always triggered at the same time. At this point, the temporal superposition of the weld processes is analyzed. The use of spatial power modulation is intended to illustrate that the welding processes with constant welding parameters achieve comparable penetration depth curves over further welding cycles. In all four welding processes, a periodic course of the weld penetration depth can be observed and the temporal progression of confirms the previously set 300 Hz as frequency of the spatial power modulation. However, a temporal shift with a maximum of 0.3 ms is detected between the courses. This is most likely due to the applied data preparation of the raw measurement data by filtering and interpolation. However, the mean course of the weld penetration depth shows that the time shifts are so minor that the cyclicity of the further process courses is only slightly affected.
The results of the iterative learning approach are discussed within two different categories depending on the number of iterations, the reference trajectory, the control parameters and the choice of using spatial power modulation or not. Furthermore, a weld seam length of 15 mm is realized at a feed rate of 50 mm/s, resulting in a constant process time of TProcess=300 ms. In category II, in which the spatial power modulation is described, the oscillation amplitude stays constant with a value of AS=0.1 mm whereby the frequency fS is variable in the range between 100 Hz and 500 Hz.
For the combination of the welding process with the learning factor set, three control processes of the iterative learning control are carried out with the specified number of iterations. Furthermore, for each control process by the iterative learning control an initialization is necessary, which is performed at 315 W or 21 % of the laser power. For processes without spatial power modulation, the data curves are shown for the whole control period TC=235 ms. The difference to TProcess results from TOffsetStart=30 ms and TOffsetEnd=35 ms. Due to the complex course of the data for the processes with spatial power modulation, the presented range is limited to the time interval between 110 ms and 190 ms. Here, a verification is made whether the use of the iterative learning control makes it possible to compensate for effect of the non-uniformity of the weld penetration depth when using spatial power modulation 13.
3 RESULTS AND DISCUSSION
3.1 Category I – Control of the weld processes without spatial power modulation
In the following, the control process when approaching a target reference trajectory of the weld penetration depth with a value of 600 μm is examined, Figure 3. The aim of the iterations is to achieve the lowest possible control deviation with as few iterations as possible to establish a sufficient control of the welding depth. Accordingly, achieving a low control deviation depends on various differentiating or integrating control parameters. The influence of the control parameters on the quality and number of iterations is explained for one of the cases in chapter 4.3. After initialization of the control with a constant voltage of 2.1 V, a weld depth of approximately 850 μm is reached in iteration 1. As a result of the calculated deviation between the course of iteration 1 and the reference trajectory, the course of the laser power of cycle 1 is reduced to approximately 2 V. The laser power of iteration 1 is then calculated and the laser power from iteration 1 affects the reduced course of the weld penetration depth to approximately 780 μm.
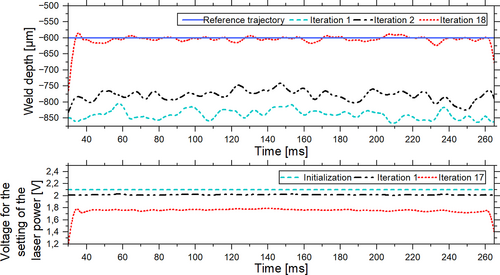
ILC process when tracking line reference trajectory through welding process without local power modulation ( =0.1 and =0.05).
The trajectories correspond to the expected behavior of the iterative learning control, so the laser power is corrected to track the reference trajectory. The reference weld depth is reached with the voltage of approximately 1.75 V which corresponds to a laser power of 262.5 W. In order to reach the reference trajectory (in iteration 18) as quickly as possible, the voltage curve (from iteration 17) is reduced to 1.2 V at the start of the control cycle and an oscillating transient process of the control variable can be observed. Also, the amplitude of the welding depth fluctuations decreases.
From the course of the weld penetration depth, the displayed longitudinal cross section of the weld shows that in the initial phase of the welding process (within TOffsetStart=30 ms), a weld penetration depth of approximately 800 μm with the preset voltage is reached, Figure 4. The cross-sections were obtained by initially cutting the weld sample in smaller pieces and processing in the Struers Targetmaster system. For this purpose, the pre-cut sample pieces are positioned in the machine's own sample holder and the height of the samples is measured using a positioning laser. This is followed by an automated grinding and polishing process using 1200 grit abrasive paper and a polishing cloth. Finally, the polished sample is chemically treated with an Adler etchant. Shortly after the start of the control cycle, the weld penetration depth is reduced to 600 μm. This corresponds to the determined course of iteration 18 and confirms the effect of the control. On the other hand, the control process with a sinusoidal reference trajectory was examined, Figure 5. The mean value of the sinusoidal function is 600 μm, the period 60 ms and the amplitude 30 μm. As expected, the course of the weld penetration depth already shows the tendency of an adaption to the reference trajectory in iteration 2. Also, as with the tracking of the line trajectory, when looking at the course of the weld penetration depth in iteration, between 30 ms and 40 ms of the process, the overshoot of the control variable is detected. In addition, in iteration 19 the progression of the controlled variable is in phase with the reference trajectory as well as the achieved progression of the controlled variable from iteration 20. Accordingly, the laser power needs to be adjusted between 270 W (1.8 V) and 255 W (1.7 V) to map the sinusoidal trajectory.

Weld specimen from iteration 18 while following the line reference trajectory without local power modulation.
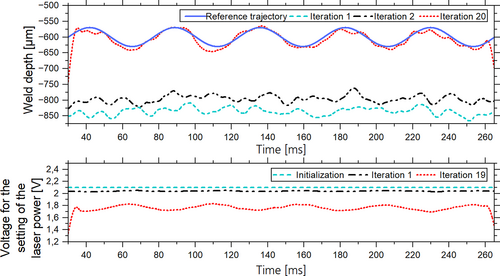
ILC process when tracking a sinusoidal reference trajectory through a welding process without local power modulation ( =0.075 and =0.025).
The given examples indicate that using the iterative learning control, the weld penetration depth in laser beam microwelding can be adjusted to a given trajectory. In addition, the control suggests that the realization of the arbitrary longitudinal profiles of the welds is limited only by the process delay as well as the maximum available power of the beam source.
3.2 Category II – Control of the weld processes with spatial power modulation
The aim of laser beam welding control with spatial power modulation is to compensate for the effect of non-uniformity of the weld penetration depth. At this point, the results of the control with the approach of an iterative learning control when following a line reference trajectory through the welding processes with increasing frequency of spatial power modulation are presented. This demonstrates the influence of the increasing dynamics of the controlled system on the control trajectory.
Further the control process of laser beam welding with spatial power modulation at an oscillation frequency of 100 Hz is examined, Figure 6. In iteration 1, the welding process achieves a sinusoidal progression of the weld penetration depth with an average value of 825 μm. The amplitude is about 50 μm and the frequency corresponds to the oscillation frequency of the spatial power modulation. The laser power on the first iteration is reduced as in the control processes from category I and reaches a sinusoidal course. In iteration 9, the course of the weld penetration depth is stabilized and the periodicity from iteration disappears due to the sinusoidal modulation of the laser power. The course of the voltage from iteration 8 is in phase opposition to the course of the weld penetration depth from iteration 1. However, the course of the weld penetration depth fluctuates around the reference trajectory with deflections of less than 25 μm.

ILC process when tracking a line reference trajectory through a welding process with spatial power modulation (fS=100 Hz, =0.3 and =0.1).
In addition, the signals show from the progression of the voltage from iteration 8 that the rise and fall times of the modulated laser power, between 140 ms and 150 ms, are not symmetrical. The reason for this is that the welding process has different inertia in local energy input and output.
In the following, the results of control of the welding process with spatial power modulation with a higher oscillation frequency of 300 Hz are discussed and the curves of the welding depth and the corresponding curves of the voltage are shown, Figure 7. In iteration 1, a significantly greater volatility of the weld penetration depth curve can be seen than in the case of welding with an oscillation frequency of 100 Hz. However, the weld penetration depth runs with a high variation of the amplitude, which varies between 15 μm and 75 μm. Based on the weld penetration depth data from iteration 13, the weld penetration depth trajectory is brought clearly in the vicinity of the reference trajectory. However, the data shows the irregular dispersion up to 75 μm around the reference trajectory.
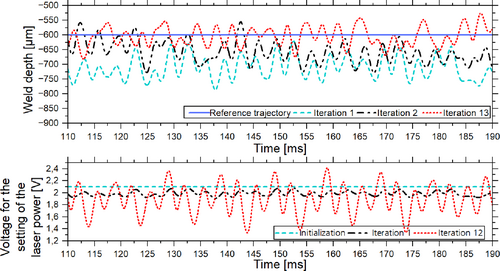
ILC process when tracking a line reference trajectory through a welding process with spatial power modulation (fS=300 Hz, =0.3 and =0.1).
In contrast to the course of the welding depth from iteration 13, the course of the voltage for the presetting of the power in iteration 12 exhibits a periodic patterned behavior. In the pattern, two lower local maxima are followed by a single higher local maximum. The pattern is contrary to the expected behavior of modulation with a nearly constant amplitude. For comparison, the control process of laser beam welding with local power modulation at an oscillation frequency of 500 Hz is shown, Figure 8. Comparable to the case of the local power modulation with 300 Hz, no fixed amplitude can be assigned to the course. In addition, there is no correspondence between the frequency of the fluctuation of the weld penetration depth from iteration 1 and the oscillation frequency of the local power modulation.
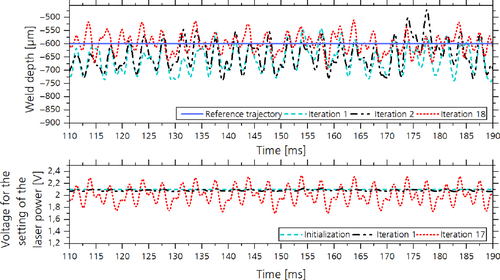
ILC process when tracking a line reference trajectory through a welding process with spatial power modulation (fS=500 Hz, =0.075 and =0.025).
The voltage curve from iteration 17 shows a strong periodic character for the laser power setting. Thus, the reaction of the weld penetration depth to a change in the power input takes place with a delay of approximately 1 ms. In order to compensate for the aforementioned temporal shift, the learning law should exhibit a stronger acausal behavior. The overview summarizes the variation of the penetration depth around the mean value of the penetration depth of the welding process shown after initialization of the control and at the end of the control process for all welding processes with local power modulation, Table 1.
|
Unit |
Category II |
|||
|---|---|---|---|---|---|
Frequency |
[Hz] |
100 |
200 |
300 |
500 |
Fluctuations of the weld penetration depth after initialization |
[μm] |
37.66 |
43.83 |
39.28 |
46.02 |
Achieved variation of the welding depth |
[μm] |
17.55 |
18.18 |
34.63 |
35.04 |
Reduction of the fluctuation |
[%] |
53.4 |
58.82 |
11.84 |
23.86 |
3.3 Control quality of the welding process
To describe the quality of the process, the mean value of the sum of the absolute control deviation of the weld penetration control for laser beam mircowelding without local power modulation when tracking a line reference trajectory (left) and a sinusoidal reference trajectory (right) is shown, Figure 9. Additionally, it is illustrated how the changes of the learning parameters pair and affect the values of the control quality. The left graph indicates that the lowest achievable control quality when following a line reference trajectory stabilizes around 105 μm and it can be stated that the iterative learning control process for the learning parameter pairs =0.3, =0.1 as well as =0.5, =0.1 can already be terminated after iteration 6. By using lower values of the learning parameters, no significant improvement of the quality of the control is observed. When following a sinusoidal reference trajectory, comparable results can be noticed with the same learning parameters. The mean value of the absolute control deviation stabilizes between approximately 0.9 ⋅ 104 μm and 1.5 ⋅ 105 μm and is reached in iteration 4. On contrary, the control with learning parameter pair =0.075 and =0.025 needs at least 17 iterations to arrive in the mentioned range of control quality.
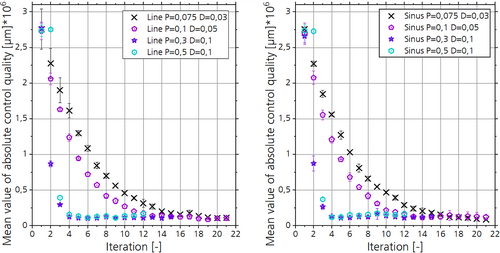
Mean value of the sum of the absolute control deviation of the weld penetration control without spatial power modulation when following a linear (left) and sinusoidal (right) reference trajectory.
Finally, the mean value of the sum of the absolute control deviation for the welding process with spatial power modulation is discussed. The course of the control quality for the learning parameter sets are =0.3, =0.1 as well as =0.075, =0.025, Figure 10. Based on the course of the control quality, it stabilizes in two convergence ranges depending on the oscillation frequency. On the one hand, the control quality for oscillation frequencies 100 Hz and 200 Hz settles around 1.5 ⋅ 105 μm. On the other hand, the second range for higher oscillation frequencies of 300 Hz and 500 Hz is observed with a control quality between 2.7 ⋅ 105 μm and 3.5 ⋅ 105 μm. Comparable to the control of the welding processes without spatial power modulation, the values of the learning parameter pair have a similar effect on the course of the control quality, so that using =0.075 and =0.025 the convergence range is reached only in later iterations. However, no significant reduction in the control quality can be seen as a result.
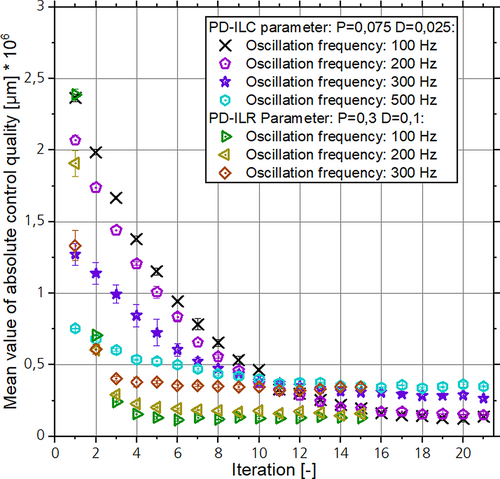
Mean value of the sum of the absolute control deviation of the weld penetration control with spatial power modulation when following a linear reference trajectory.
In addition to the discussed results, when considering the control quality in the first iterations and the curves of the penetration depth for welding processes with spatial power modulation, the value of the control quality at the start of the control process is essentially dependent on the initialization curve of the welding process. It was illustrated that the weld penetration depth in iteration 1 is strongly influenced by the oscillation frequency of the spatial power modulation. As a result, smaller control quality is achieved for large oscillation frequencies at the beginning of the control process. Thus, it can be concluded that the control quality as a measure for evaluating the quality of the control should be considered only at later iterations of the control process.
4 SUMMARIES
Within the scope of this work, a welding depth control for laser micro welding is developed using the vapor capillary depth measured by optical coherence tomography on a stainless steel 1.4301 with the LDD-700 by IPG Photonics. In comparison to the state of the art, an alternative to directly controlling the weld penetration depth is therefore presented to compensate for the lack of a real-time capable system. In addition to verifying the real-time capability of the measurement element, an alternative approach via an iterative learning control is developed, tested and evaluated. The approach allows to reuse the weld penetration depth data available after the end of the process, so that in the course of the weld iterations the weld penetration depth of the process approximates a set reference trajectory. Thereby, the algorithm addresses both the weld penetration depth with and without spatial power modulation. The quality and performance of the iterative learning control is evaluated. A high capability of the system to track the line and sinusoidal reference trajectories during welding without local power modulation is found. Further, for the low oscillation frequencies of 100 Hz and 200 Hz of the spatial power modulation, the temporal course of the laser power stabilizes the course of the weld penetration depth, so that the line reference trajectory is achieved. The comparison of the weld penetration depth curves for the higher oscillation frequencies of 300 Hz and 500 Hz shows a reduction in the fluctuation of the weld penetration depth at the beginning and end of the control process, but the control shows a lower ability to compensate at high frequencies.
Acknowledgement
The presented investigations were carried out at RWTH Aachen University within the framework of the Collaborative Research Centre SFB1120-236616214 “Bauteilpräzision durch Beherrschung von Schmelze und Erstarrung in Produktionsprozessen” and funded by the Deutsche For-schungsgemeinschaft e.V. (DFG, German Research Foundation). The sponsorship and support is gratefully acknowledged. Open access funding enabled and organized by Projekt DEAL.


