Swelling Behaviors of Natural Rubber/Solvent Systems Based on the Extended Modified Double Lattice Model
Abstract
Swelling experiments are conducted on nonfiller natural rubber using four solvents (toluene, cyclohexane, tetrahydrofuran (THF), and methylethylketone (MEK)) over temperatures from 10 to 70 °C. Toluene, cyclohexane, and THF, classified as effective solvents, show swelling ratios between 3 and 7, influenced by the crosslink density of the rubber. MEK, however, has a lower ratio of 1.5 to 2. Temperature has a minor impact on swelling compared to the crosslink density. The study evaluates the Extended Modified Double Lattice (EMDL) model for its mixing contribution in polymer network swelling, aiming to improve the Flory–Hüggins (FH) model. The superiority of EMDL above FH is in the boundary condition at the unvulcanized state, the former aligning its interaction energy with values from solvent activities in primary linear polymer/solvent solutions, unlike the FH model. The EMDL model also accounts for oriented interactions in polar solvents through a secondary lattice, linking specific interaction energy with solvent dipole moments. The study observes a nonlinear correlation between crosslinking density and sulfur amount, proposing a nonrandom mixing at lower sulfur concentrations. This model shows strong alignment with experimental data, suggesting that replacing the FH model's mixing contribution with the EMDL model could improve results with minimal additional complexity.
1 Introduction
Natural rubber (NR), renowned for its exceptional elasticity, resilience, and versatility, is extensively utilized across various industries. It plays a critical role in the automotive sector as an essential component in tire manufacturing, enhancing safe and efficient road traction.[1] NR is also integral in producing automotive parts like seals, gaskets, and suspension components, which are key in vibration dampening.[2] In consumer goods, its application in shoe soles underscores its importance in providing comfort and durability.[3] Its adhesive qualities are indispensable in the construction and woodworking industries for securely bonding materials.[4] The medical field leverages NR in the production of hypoallergenic gloves and tubing, highlighting its widespread utility.[5] NR's unique properties contribute significantly to the manufacturing of industrial machinery, sports equipment, and toys, underscoring its indispensability in modern industry.
However, the NR industry is grappling with significant environmental challenges due to its expansion and cultivation practices. Deforestation, especially in tropical regions where rubber plantations are prevalent, is a primary concern. This leads to habitat loss, biodiversity degradation, and ecosystem disruptions.[6] The use of pesticides and fertilizers in rubber cultivation poses risks of soil and water pollution, affecting both the environment and local communities. Furthermore, climate change exacerbates these issues by impacting rubber yields and stressing ecosystems.[7] As NR demand grows, the industry faces the crucial challenge of adopting sustainable cultivation practices to minimize deforestation, reduce chemical use, and mitigate environmental impacts.
The phase diagram of NR offers potential solutions to these environmental challenges. Understanding how temperature and pressure influence NR's behavior enables optimization of processing conditions, reducing energy consumption, and environmental impacts. For instance, precise control over vulcanization temperatures enhances product quality while conserving energy and lowering greenhouse gas emissions.[8] Additionally, the phase diagram provides insights for developing eco-friendly alternatives, such as bio-based rubber or recycling methods, by identifying optimal conditions for these processes.[9] Thus, the phase diagram of NR is pivotal in promoting sustainable practices within the rubber industry, mitigating environmental issues, and contributing to a greener future.
Rubber swelling experiments, analyzed through thermodynamics, provide essential insights into the interaction between rubber materials and solvents. These experiments aid in selecting rubber compounds that are thermodynamically compatible with specific applications, ensuring resistance to swelling and degradation.[10] Furthermore, thermodynamics facilitates the development of new rubber materials with enhanced swelling resistance, enabling the manipulation of properties to the desired thermodynamic states. These experiments also predict the long-term performance of rubber materials by assessing Gibbs free energy changes during swelling, offering insights into the system's thermodynamic stability. Leveraging thermodynamics in rubber swelling experiments allows manufacturers to optimize material use, reduce costs, and minimize environmental impacts, aligning with sustainability and efficiency principles in material science and engineering.[11]
Since Flory–Rehner proposed the additivity of mixing and elastic contributions in free energy for swelling networks, the research was focused on each contribution.[12-19] The elastic contribution describes the network's structure, while the mixing contribution elucidates chemical effects between polymers and other components. The Flory–Hüggins (FH) equation, a fundamental thermodynamic model in polymer science, offers valuable insights into NR's behavior. This equation clarifies interactions between polymer chains and solvent molecules, especially relevant in understanding NR's swelling behavior.[20] By analyzing the FH model parameters, researchers can predict how rubber responds to different environmental conditions, aiding in designing products with desired properties like elasticity and chemical resistance. Additionally, the FH equation guides sustainable rubber material development by optimizing solvent systems and reducing environmental impacts during processing. Thus, the FH model is instrumental in tailoring NR's behavior and properties, contributing to practical applications and environmental advancements in the rubber industry.
However, the FH model has limitations in phase diagram applications for rubber, particularly due to its assumption of ideal polymer–solvent mixing. Rubber compounds often consist of complex blends, challenging accurate phase behavior predictions based solely on the FH equation. The equation's simplicity may lead to inaccuracies in nonideal systems, such as those involving NR and certain solvents or fillers.[21] Advanced models and experimental data are often necessary to fully understand the rubber phase diagram, indicating that while the FH model is a useful starting point, it should be complemented with additional research and modeling.
The Modified Double Lattice (MDL) model, proposed by Bae et al.,[22-24] is an advanced lattice-based model designed for studying polymer solutions, including rubber blends. This model, modifying the double lattice model of Hu et al.,[25] incorporates complex interactions like hydrogen bonding, making it valuable in understanding phase behavior in rubber blends with various interactions. It captures effects like chain length, molecular weight distribution, and solvent quality on phase separation, key factors in optimizing rubber blends.[26]
This work engages in experimental efforts in NR swelling with various solvents and analyzes the results from a thermodynamic perspective. It examines the mixing contribution in the Flory–Rehner hypothesis by comparing the traditional FH model with the MDL model. The analysis focuses on the shortcomings of the FH model and how the MDL model addresses these, particularly in solution limits and specific interactions in polar solvents. Besides model evaluation, this work examines network structure (specifically, the crosslink density) relative to sulfur amount. Experimental data reveals a breakdown in the linear correlation between crosslink density and sulfur amount at low concentrations, assumed to be due to nonrandom sulfur particle mixing. This effect is theoretically considered by introducing a logarithmic correlation for the crosslink density and a nonrandomness factor in the interaction energy domain. Finally, discussions on the chemical effects beyond energy value comparison offer insights for further improving the MDL model in the rubber industry.
2 Experimental Section
2.1 Materials
Commercial grade Standard Philippine Rubber (SPR 20), a type of NR commonly used in the rubber industry, was employed as the primary material. Zinc oxide (ZnO), stearic acid (StH), and sulfur were sourced from Sigma Aldrich Co. and utilized in the compounding process. Prior to compounding, all ingredients were examined for moisture absorption, ensuring minimal impact on their use. Solvents such as toluene, cyclohexane, tetrahydrofuran (THF), and methyl ethyl ketone (MEK), also obtained from Sigma Aldrich Co., were employed for determining swelling ratios. Detailed information about the chemicals is provided in Table S1 (Supporting Information).
2.2 Sample Preparation
The fabrication of rubber composites involved a two-step process. Initially, NR, ZnO, StH, and processed oil were combined using a Banbury Mixer (BR-1600, FARREL). Subsequently, an accelerator and sulfur were incorporated into the mixture using a two-roll mill. The compounded rubber, shaped into sheets via the two-roll mill, was analyzed for vulcanization characteristics using a Monsanto rheometer (MDR-2000). The vulcanization process involved heating and pressing the rubber composite in a hot press (Samchang ENG) for a predetermined duration, facilitating crosslinking between the rubber molecules and vulcanizer. This process ensured the complete integration of sulfur and rubber molecules, thereby stabilizing the inherent properties of the composite. The vulcanization time was determined based on the rheometer graph's peak for each formulation at 155 °C. Rheometer settings were maintained at a constant oscillation angle of 1 arc and a frequency of 1.7 Hz. The compositions and densities of the samples are listed in Table 1 by grouping according to accelerator to sulfur ratio[27]: (EV, 1:0.6–1.0), semi-efficient (s-EV, 1:0.7–2.5) and conventional (CV, 1:2.5–12) vulcanization systems.
| Sample | Vulcanization | NR | ZnO | StH | Oil | CBS | S | Density |
|---|---|---|---|---|---|---|---|---|
| groupa) | [g] | [phr]b) | [phr] | [phr] | [phr] | [phr] | [g cm–3] | |
| S1 | EV | 100 | 5 | 3 | 4 | 1 | 0.5 | 0.955 |
| S2 | s-EV | 100 | 5 | 3 | 4 | 1 | 1.0 | 0.956 |
| S3 | s-EV | 100 | 5 | 3 | 4 | 1 | 1.5 | 0.957 |
| S4 | CV | 100 | 5 | 3 | 4 | 1 | 2.0 | 0.964 |
| S5 | CV | 100 | 5 | 3 | 4 | 1 | 3.0 | 0.965 |
| S6 | CV | 100 | 5 | 3 | 4 | 1 | 4.0 | 0.965 |
- a) EV: efficient vulcanization; s-EV: semi-efficient vulcanization; CV: conventional vulcanization;
- b) phr: parts per hundred of rubber.
2.3 Swelling Experiments
For swelling ratio assessments, vulcanized rubber sheets (2 mm thick) were cut into 20 mm × 5 mm pieces. These samples were then dried in a vacuum oven at 60 °C for 24 h to eliminate internal moisture and gases, preserving the material's integrity. To prevent aging from external factors like light and heat, the dried samples were stored at 0 °C. Prior to testing, the specimens were acclimatized to room temperature for over 4 h. Swelling measurements, conducted both temporally and thermally, aimed to ascertain the rate and temperature dependency of swelling. Equilibrium in swelling for all solvents was observed after 24 h, as shown in Figure S1 (Supporting Information). The solvents used were toluene, cyclohexane, THF, and MEK, with their respective swelling measurements conducted within temperature ranges appropriate to their boiling points, as recorded after 24-h immersion. For each experiment, three dried specimens were placed in individual 10 ml vials filled with the solvent. These vials were then immersed in a temperature-controlled water bath set to the specific temperature for a set duration. To mitigate external factors like light and oxygen, which could accelerate swelling, the water tank was covered during immersion.[19] Postimmersion, solvent residues on the specimen surfaces were promptly removed, and their masses were recorded on a precision balance for swelling ratio calculations. The final swelling ratio was determined by averaging the results from the three specimens.
3 Model Development
Temperature dependence of Equations (8) and (9) is implicit in the interaction energy parameters .
4 Results and Discussions
4.1 Solvent Activity Coefficient Analysis
4.2 Crosslink Density Analysis
- a) Before self-consistency. Derived from constant interaction energy parameter;
- b) After self-consistency. Derived from crosslinker dependent interaction energy parameter.
4.3 Analysis of the NR/Toluene System
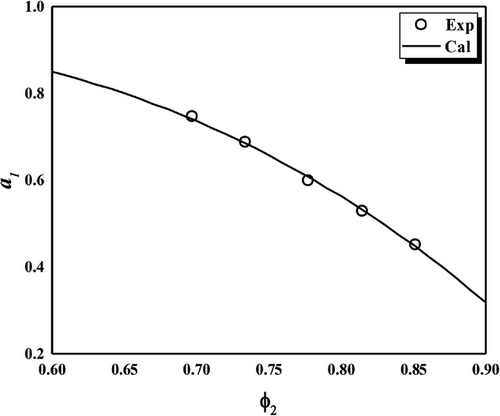
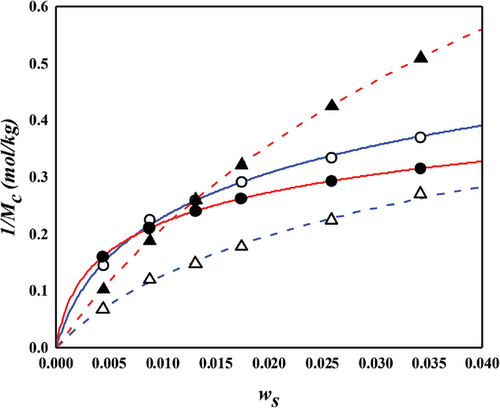
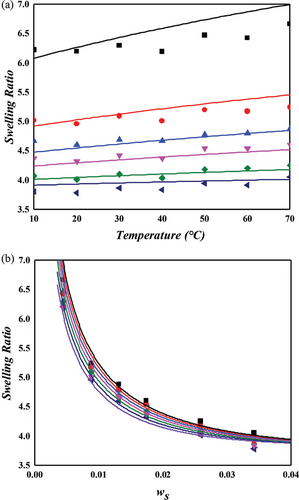
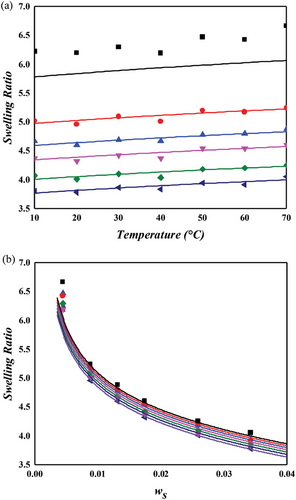
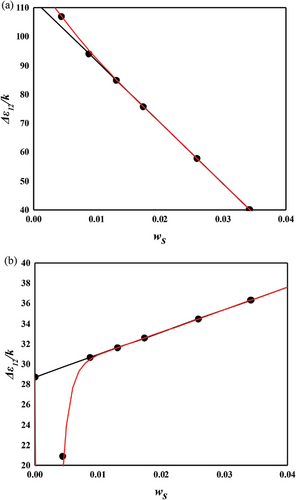
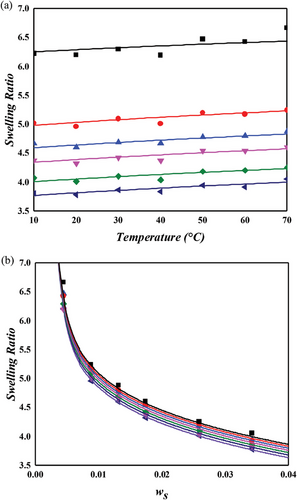
The NR/toluene system is extensively studied in swelling experiments aimed at understanding the microstructure of rubber networks. Most research in this area focuses on extracting the crosslink density using the Flory–Rehner hypothesis, particularly assessing the accuracy of elastic models. For unbiased analysis, the correctness of the mixing contribution must be presupposed. In this context, both temperature and crosslinker dependence were examined for the NR/toluene system. A key issue identified is that the crosslink density derived from the constant energy parameter of solvent activity in unvulcanized solution systems (Equation (11) with upper values in Table 2) leads to a linear relationship between the energy parameter and sulfur weight fraction. However, this approach lacks self-consistency. Employing Equation (11) for and the linear dependence of , parameters were obtained through one-pot regression for each FH and MDL model (lower values in Table 2). For the energy parameter, the boundary condition at zero sulfur amount aligns with the values for the unvulcanized system. The derived swelling ratios for the simultaneous temperature and sulfur weight fraction dependence are illustrated in Figures 3 and 4. A comparison of the computational results indicates that the MDL model performs better for temperature dependence and at high sulfur weight fractions, while the FH model aligns more closely with experimental data at low sulfur fractions, albeit with lower quality of temperature dependence. The overall superiority of the MDL model can be attributed to the boundary condition of the energy parameter. When this condition is not constrained, the performance of the FH model is comparable to that of the MDL model (as shown in Figure 4. Two critical observations emerge. First, even without the boundary constraint, the MDL model aligns with the same parameter, while that of the FH model shows significant variation ( for constrained vs for unconstrained). This finding suggests that the FH model lacks certain aspects for effective use as a mixing contribution. As Flory noted, this might be due to the exclusion of entropy contribution in the heat content.[30] Conversely, the MDL model includes augmented entropy terms (compare Equation (8) with Equation (9)), providing a plausible explanation for its enhanced performance under the required boundary condition. The second observation pertains to the energy parameter. Freed and Pesci demonstrated that the FH parameter is a function of crosslinker fraction in their cluster expansion framework.[15, 34] To verify this functional relationship in our study, the sulfur dependencies of the energy parameter for each model are depicted in Figure 5. It is observed that the energy parameter deviates from the linear trend at low sulfur weight fractions, more notably for the MDL model. This deviation is attributed to the decrease in the crosslink density at low sulfur weight fractions, as explained by the concept of nonrandomness in the previous section. With low sulfur contents, the accumulation of sulfur molecules at specific points in the rubber matrix may be substantial, leading to this nonrandomness and the consequent deviation of the energy parameter from the linear trend. This phenomenon is represented as a deviation in model predictions at low sulfur weight fractions in Figure 4. In the case of the FH model, the deviation from the linear trend is less pronounced, as shown in Figure 5a, and the prediction of swelling ratio exhibits good fit in this region. However, it is important to recognize that this is a result of forced distortion by the boundary condition, and thus the overall goodness of fit is of low quality. The deviation at low sulfur weight fractions for the MDL model can be improved by incorporating the second part on the right side of Equation (6) for nonrandomness correction. The corrected energy parameters are shown as red curves in Figure 5, and the updated swelling ratio for the MDL model is presented in Figure 6. As demonstrated in these figures, the MDL+ model satisfactorily covers the entire range of consideration, whereas the FH model shows limited improvement, even with the aid of (not shown in Figure 6). The derived energy parameters are listed in Table 3.
| Solvent | Model | |||||
|---|---|---|---|---|---|---|
| K | K | – | – | K | ||
| Toluene | FH | 112.690 | −2119.200 | −2.529 | 0.002410 | – |
| MDL | 28.733 | 222.49 | −1159.738 | 0.000906 | – | |
| Cyclohexane | FH | 97.35 | −1170.100 | −9.883 | 0.003429 | – |
| MDL | 22.686 | 566.181 | −1409.608 | 0.000684 | – | |
| THF | FH | 124.45 | −1425.700 | −36.095 | 0.001008 | – |
| MDL | 73.742 | 139.270 | −616.514 | 0.001100 | 528.914 | |
| MEK | FH | 252.295 | −250.085 | −39.986 | 0.001000 | – |
| MDL | 210.227 | −8.046 | −21566.632 | 0.000689 | 1110.201 |
4.4 Analysis of NR in Various Solvent Systems
4.4.1 Swelling Behavior in NR/Cyclohexane System Using MDL + Model
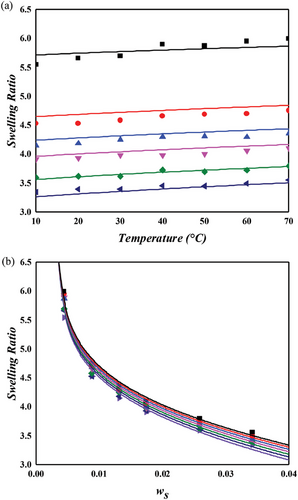
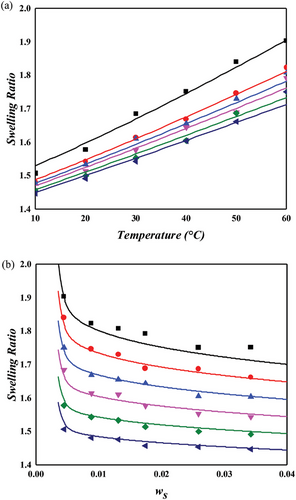
Figure 7 presents the swelling behavior of NR in a cyclohexane environment, as predicted by the MDL + model. Despite minor discrepancies with experimental data, particularly at 1 phr sulfur concentration, the model demonstrates satisfactory predictive capability. When compared to the NR/toluene system, the unvulcanized state energy parameter () in the NR/cyclohexane system is marginally lower, elucidating the slightly reduced swelling ratio observed in the latter. Notably, the crosslinking energy parameter (), as defined in Equation (6), exhibits a considerably steeper slope for cyclohexane, ≈2.5 times that of toluene. This observation suggests that while the affinity between NR and cyclohexane is less than that with toluene, the inverse is true for the interaction of sulfur with these solvents. Consequently, the density of the crosslinker plays a pivotal role in determining the mixing properties, such as swelling or dispersion, in these systems.
4.4.2 Swelling of NR in Nonpolar and Polar Solvent Systems
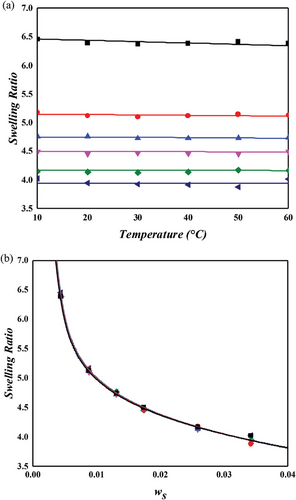
Both toluene and cyclohexane are categorized as nonpolar solvents, and the NR/toluene system can be aptly described using only the primary lattice within the MDL model. However, for polar solvent systems, this primary lattice framework is insufficient to account for specific interactions like hydrogen bonding or dipole–dipole interactions. To address this, the MDL model incorporates a secondary lattice, as delineated in Equation (5), into the interaction energy parameter equation (Equation (4)). Swelling experiments conducted with two representative nonpolar solvents, THF and MEK, and depicted in Figures 8 and 9, affirm the necessity of this modification. The secondary lattice for solvent–solvent interaction (1–1) is assumed to dominate over other interactions (2–2 and 1–2) due to the high-dipole moments of these polar solvents. NR typically exhibits limited solubility in nonpolar solvents, with MEK being a prime example. Figure 9 shows that the swelling ratio in MEK is considerably lower than in toluene or cyclohexane. Conversely, THF induces greater swelling in the NR network compared to nonpolar solvents. The dipole moment of THF (1.75 D), although lower than MEK (2.78 D), is higher than aniline (1.52 D), indicating that the solvent polarity is not the sole determinant of swelling degree. The ether group in THF, with its exposed positive partial charge near the oxygen atom, may interact electrostatically with the negatively charged π-bonds in NR, contributing to its higher swelling ratio. Despite this, the reasons for THF's greater swelling effect compared to toluene or cyclohexane remain unclear. Nevertheless, the MDL model, supplemented by the secondary lattice energy, successfully describes the swelling behavior of NR in these polar solvents. The specific interaction energy, , for MEK is about twice that of THF, correlating with their respective dipole moments.
5 Conclusions
5.1 Evaluation of Mixing Contributions in Rubber/Solvent Systems: A Comparative Study of FH and MDL Models
This study rigorously evaluated the mixing contributions within rubber/solvent systems using the Flory–Rehner theory, focusing on a comparative analysis between the traditional FH model and the more intricate MDL model. The MDL model, encompassing additional enthalpic and entropic terms, initially appears more complex than the FH model. However, our investigation confirmed that these additional terms are crucial for a self-consistent explanation of network/solvent interactions in chemically linked experimental setups. A notable finding is that the interaction energy parameter for the unvulcanized state in the MDL model aligns with values obtained from solvent activity assessments in NR/toluene and NR/cyclohexane systems, demonstrating the model's self-consistency. This alignment contrasts with the results from the FH model, suggesting the augmented enthalpic and entropic contributions in the MDL model effectively address deficiencies arising from the mean field approximation inherent in the FH model.
5.2 Interpretation of the Crosslink Density and Energy Parameters
Our application of Equation (10) for modeling crosslink density ( or ) effectively accounted for the observed decrease in the crosslink density at low sulfur concentrations and satisfied the boundary condition of zero in the unvulcanized state. Additionally, the energy parameters displayed deviations from a linear trend at extremely low sulfur levels, a phenomenon we attributed to the nonrandom distribution of sulfur particles during mixing. This behavior was mathematically articulated using the modification.
5.3 Incorporating Secondary Lattice in Polar Solvents
In the context of polar solvents, the significant dipole interactions between solvent molecules necessitated the introduction of a secondary lattice in the energy parameter equation (Equation (4)). The resulting trends in dipole interaction energy closely matched the order of solvent dipole intensities, corroborating our approach.
5.4 Overall Applicability of MDL Model and Future Perspectives
While the superior solvent capabilities of THF for NR were not fully elucidated through thermodynamic modeling alone, our findings affirm the suitability of the MDL model for analyzing mixing contributions in rubber/solvent systems, applicable to both networked and non-networked structures. Future research, potentially integrating chemical reduction methods like group contribution analysis, could provide further insights into the fundamental aspects of mixing between seemingly incompatible molecules in these systems.
Acknowledgements
The authors acknowledge nothing.
Conflict of Interest
The authors declare no conflict of interest.
Author Contributions
S.J.P. performed formal analysis, methodology, and wrote the original draft. E.J.K. contributed to sample preparation, and wrote the experimental section. W.M.A. and J.S.K. performed swelling experiment, and wrote the experimental section. J.W.K. performed swelling experiment and visualization. J.S.O. conceptualized the study. Y.C.B. performed supervision, project administration, conceptualization, and reviewed and edited the final manuscript.
Open Research
Data Availability Statement
The data that support the findings of this study are available in the supplementary material of this article.


