Real-Time Monitoring of Particle Size in Emulsion Polymerization: Simultaneous Turbidity and Photon Density Wave Spectroscopy
Abstract
Particle size evolution in seeded semibatch emulsion polymerization is monitored by two real-time monitoring techniques: online turbidity spectroscopy (TUS) and inline photon density wave spectroscopy (PDWS). An automatic dilution system that withdraws a sample from the reactor and upon dilution transfers to the measurement cell is used for the online TUS analysis. A PDWS probe is immersed in the reactor and collects inline the scattered light directly from the reacting latex. The particle sizes retrieved from TUS and PDWS are compared to offline dynamic light scattering (DLS) values. The particle size obtained by TUS is close to the intensity-average particle size obtained offline by DLS, while the particle size obtained by PDWS lies closer to the number-average particle size from DLS.
1 Introduction
Polymer latexes are waterborne polymer dispersions that are used to formulate all kind of paints, coatings, adhesives, and a myriad of additives for a wide range of applications.[1-3] Particle size and particle size distribution (PSD) are key characteristics of polymer latexes,[3] as they affect the rheology (e.g., viscosity) of the dispersion and its film formation, among others, which are important to control the process and the application properties of the latexes.[3] Therefore, a robust and efficient synthetic process should ensure the reproducibility of these characteristics during the process to avoid off-spec products and economic loses. Hence, real-time monitoring of the particle size is necessary to be able to implement real-time (close-loop) control strategies. This is why a lot of effort has been devoted to develop real-time online or inline automatic particle size characterization techniques.[3, 4]
Particle size characterization techniques can be clustered in three main groups: scattering techniques (e.g., dynamic light scattering (DLS) and static light scattering (SLS), respectively), laser diffraction, photon density wave spectroscopy (PDWS) or turbidity spectroscopy (TUS)); fractionation techniques (e.g., capillary hydrodynamic fractionation (CHDF), analytical centrifugation or field flow fractionation); and counting techniques (e.g., transmission electron microscopy (TEM), particle tracking analysis, optofluidic force induction (OF2i), or light obscuration). Most of them are offline analysis techniques, what means not only that samples need to be withdrawn and manually prepared for the analysis, but also that the time delay to get the results is large, going from few minutes (DLS case) to some hours (TEM case). Thus, online/inline particle size characterization techniques can be used to overcome these limitations, as time delays are substantially reduced and manual preparations are avoided.
Few technologies based on light scattering, ultrasonic properties, NIR of Raman spectroscopy, focus beam reflectance, or optofluidic force induction have been used to determine particle sizes in real time, but not all of them are able to reach the sub-micrometer particle size range.[4-14] Moreover, many of them work in very diluted media; thus, there is a need to automatically dilute the sample before the analysis (online analysis), which cannot be acceptable for certain processes, due to the clogging that could occur inside the dilution system. Furthermore, the high dilutions needed could lead to large time delays between sampling and acquisition of the results.[3]
The online TUS and the inline PDWS are two of the available real-time technologies to monitor the particle size of waterborne polymeric dispersions. Both are scattering-based techniques and have been previously assessed to online and inline monitor the particle size evolution during emulsion polymerizations.[15-23] However, we are not aware that both techniques have ever been used simultaneously to monitor emulsion polymerization process and their performance compared with a common reference technique like DLS. Thus, in this work, both techniques will be used as online/inline technologies (TUS and PDWS, respectively) to monitor seeded semibatch emulsion polymerization processes of acrylic copolymers.
In the present study, a commercial calorimetric reactor is equipped with both spectroscopic technologies including an automatic dilution system for the turbidimetric technique. Thus, simultaneous real-time particle size measurements are gathered during the seeded semibatch emulsion copolymerization of methyl methacrylate (MMA)/n-butyl acrylate (BA)/methacrylic acid (MAA) reaction. In addition, the obtained results are compared to particle sizes obtained offline by DLS measurements. First, a brief description of the measurement principles of both techniques is given. Then, the novel reaction set-up and the experimental details of the emulsion polymerization carried out are presented, followed by the monitoring of the experiment and the comparison and discussion of the results.
1.1 Turbidity Spectroscopy
Turbidity spectroscopy is a single scattering-based particle size measurement technique.[24-26] The intensity of the transmitted light of a sample is measured over a range of wavelengths and from this information, if the sample is diluted enough, the particle size can be retrieved.
The wavelength exponent is directly related to the size of the particles that are in the medium. Theoretically, Mie theory can be used to describe the relation between the wavelength exponent and particle size for each wavelength. Alternatively, this relation can be determined experimentally by measuring the turbidity of latex samples of known particle size (e.g., measured DLS) and approximating the wavelength exponent from the slope of the log τ versus log λ curves obtained for each latex; namely, a calibration curve that relates ω and dp can be built for a given type of latex.[23] This calibration curve was obtained for the MMA/BA/MAA copolymer latex synthesized in this work and it is shown in the Supporting Information. Similar calibration curves have been obtained correlating Raman or NIR spectra with particle size by principal component models in emulsion polymerization systems.[4-12]
As mentioned above, single scattering conditions have to be fulfilled to reach an appropriate result by TUS. If the concentration of the dispersed phase is high, as in the typical seeded semibatch emulsion polymerizations used to produce commercial latexes for coatings and adhesives, the TUS measurement cell cannot be introduced in the reaction mixture. Instead, samples are withdrawn from the reactor and diluted before analyzing them in the TUS cell.[19, 21] With the aim of automatizing this step, an automatic dilution system is connected to the TUS equipment, which is able to reach the required single scattering condition by feedback control based on the transmission of the sample at different wavelengths. Additional details about the dilution system provided by IRIS are presented in the Supporting Information. A software was developed by IRIS Technology Solutions to work with its automatic dilution system.
1.2 Photon Density Wave Spectroscopy
2 Experimental Section
2.1 Materials
Monomers were used as received: MMA (Quimidroga), BA (Quimidroga), and MAA (Aldrich). Sodium dodecyl sulfate (SDS, Aldrich) and Dowfax 2A1 (kindly supplied by Dow Chemical) were used as emulsifiers. Ammonium persulfate (APS, Aldrich) was used as the initiator. As continuous medium during the polymerization and for sample dilution (DLS and TUS) deionized (DI) high-purity water obtained through a Merck Millipore system (DI-water) was used. Water conductivity was lower than 1 µS cm−1 in all cases.
2.2 Synthesis of the MMA/BA/MAA Copolymer Latex
It was worth mentioning that ab initio batch emulsion polymerizations cannot be monitored with TUS and PDWS. The reason is that particle nucleation yields particle sizes (below 50 nm) that are out of the range that can be captured nonambiguously from TUS, and furthermore, for PDWS and due to the low solids’ content achieved during the nucleation process, the scattered light is lost and hence it cannot be applied the multiple scattering approach used in the PDWS.
Therefore, a seeded semibatch emulsion polymerization reaction was simultaneously monitored by TUS and PDWS equipments. First, a seed was synthesized and after the particles of the seed were grown until the targeted particle size (this last step was monitored simultaneously by TUS and PDWS). A seed with target molar compositions of MMA/BA 50/50 wt% was synthesized batchwise. For this aim, water, comonomers, and emulsifier were mixed in the reactor. A shot of initiator was added once the mixture reached a temperature of 85 °C. The mixture was left to react for 4 h. The formula for the synthesis of the seed (S1) can be found in Table SI1 (Supporting Information).
The seeded semibatch emulsion polymerization reaction that was simultaneously monitored by TUS and PDWS was performed as follows: first, a certain amount of seed latex plus water was loaded in the reactor to have a solids’ content of 3%. Afterward, the mixture was heated to 85 °C, the reaction temperature. After reaching the reaction temperature, monomers and initiator were fed to the reactor in two separated feeding streams during 180 min at a constant flow rate. The recipe for the reaction (SB1) can be found in Table SI2 (Supporting Information). Finally, the latex was maintained at the reaction temperature for 30 min to remove the residual monomer.
2.3 Description of the Set-Up and the Analysis Equipment
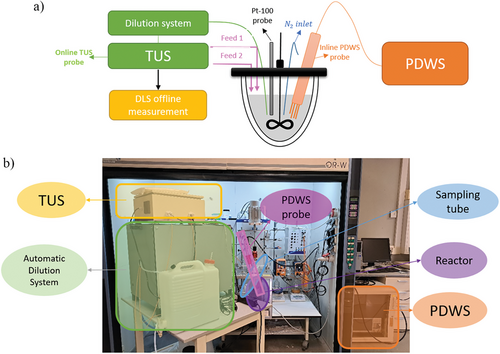
A 1 L calorimetry reactor (RC1e) from Mettler Toledo was used to perform all the reactions, equipped with a jacketed glass reactor fitted with the following fittings: a sampling device to withdraw the samples for TUS measurements, the inline PDWS probe, a nitrogen inlet, feeding inlets, a Pt-100 probe, and a stainless steel anchor type stirrer. iControl RC1e Software was used to control the reaction temperature and the inlet flow rates of semicontinuous feeds. Samples were withdrawn during the reaction to analyze the evolution of particle size offline by DLS (every 10–15 min during the first 60 min of the reaction and every 20–30 min after that time).
A PDWS equipment developed by PDW Analytics GmbH (Potsdam, Germany) was used for the particle size monitoring.[15, 22, 33, 34] The PDWS was equipped with four lasers of 636, 778, 855, and 973 nm wavelengths, 27 possible distances from 3 to 25 mm, and 41 possible frequencies from 10 to 610 MHz. To calculate the particle size, a software developed by innoFSPEC Potsdam from the University of Potsdam was used, based on Mie theory and the theory of dependent scattering.
TUS equipment developed by IRIS Technology Solutions (Barcelona, Spain) was used, which consists of a continuous spectrometer and is composed of a probe, an electrical cabinet, and a computer with a dedicated software for data processing. As mentioned above, turbidity should be measured at conditions with no significant multiple scattering, what means that samples withdrawn from the emulsion polymerization experiments need to be diluted.[18-21] The dilution system, developed by IRIS in collaboration with POLYMAT, used for this work is a dilution system with an automatic decision making software to select the appropriate dilution level by analyzing the transmission curves. A sketch of the setup and an image of the actual lab setup used for the simultaneous analysis are shown in Figure 1.
A Zetasizer Nano Series (Malvern Instrument) DLS was used as reference technique in this work. For the analysis, the latex was diluted in DI water until an attenuation number of 6–7 was achieved at 4.65 mm position to ensure single scattering conditions. DLS measurements were carried out at room temperature, and three repeated measurements were carried out for each sample. All reference particle sizes shown in this work were both intensity- and number-average particle sizes measured by DLS.
3 Results and Discussion
A seeded semibatch emulsion copolymerization (composition MMA/BA/MAA: 51/47/2 wt%) reaction (SB1) was used to simultaneously assess the performance of both TUS and PDWS technologies to monitor particle size growth. Reaction SB1 aims to produce a latex with an average particle size of 225 nm and a solids’ content of 45 wt% starting from a seed (S1, see the Supporting Information) with a particle size of 67 nm (intensity-average size) and 3% of solids’ content. Figure 2 presents the transmission curves obtained for the samples online analyzed by TUS during SB1 emulsion polymerization reaction.
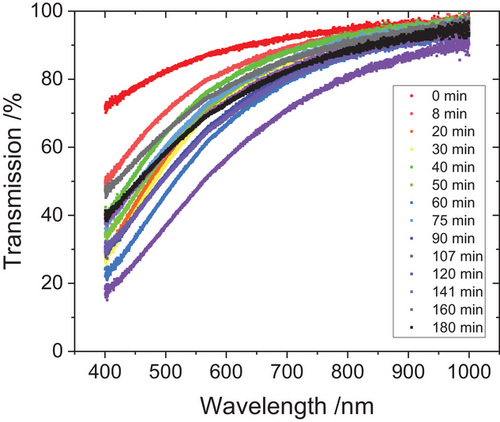
From the transmission curves presented in Figure 2, the wavelength exponent was calculated as explained in the previous section, getting to the following results (Figure 3).
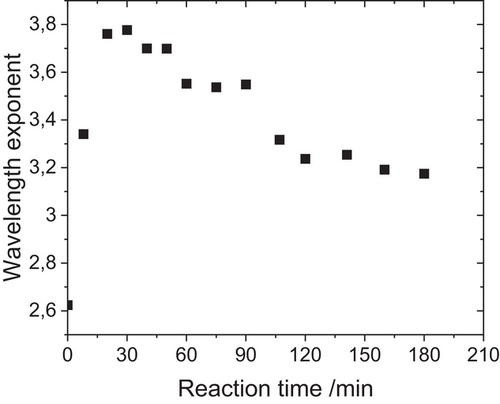
Figure 3 shows that the wavelength exponent decreases during the reaction, which, according to the calibration curve used, predicts an increase in the particle size, as it is expected in this seeded semibatch emulsion polymerization. From the wavelength exponent values presented in Figure 3 and by means of the calibration curve explained above (which can also be found in Figure SI1 in the Supporting Information), the particle size was retrieved (see Figure 5).
Figure 4 presents the time evolution of the reduced scattering coefficient obtained by inline PDWS analysis during SB1 emulsion polymerization reaction.
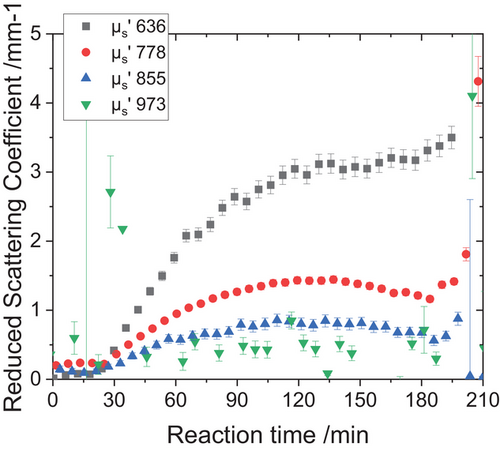
Figure 4 shows that the reduced scattering coefficient increases during the synthesis for all the laser wavelengths. At the beginning of the reaction, the solids’ content is very low; thus, the multiple scattering conditions are not fully accomplished, and the changes in the reduced scattering coefficient can hardly be detected, but after 20 min, the sample is turbid enough (both particle size and solids’ content increased) and the entire process can be monitored. Moreover, it can be seen that for the analyzed particle size range, the smaller the wavelength of the laser light, the higher the sensitivity to the changes occurring in the reactor.[22]
The particle size evolution was retrieved, from the above presented wavelength exponent (Figure 3) and reduced scattering coefficient evolutions (Figure 4), using the wavelength exponent method and the radiation transport theory, Mie theory, and dependent scattering approaches, respectively, as discussed in further detail in other works.[16, 22, 23, 25, 30] The results obtained by the simultaneous analysis and their comparison to offline DLS reference measurements are displayed in Figure 5.
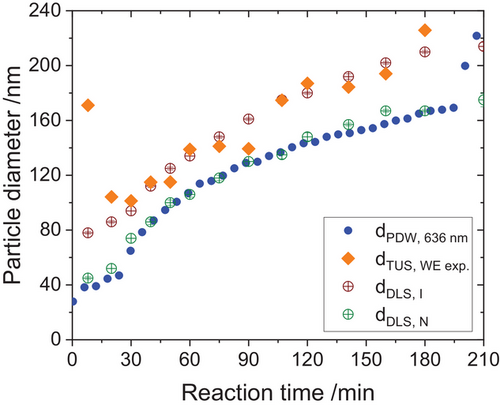
All the techniques, real-time online TUS and inline PDWS and offline DLS, captured the growth of the particle size with reaction time, which matches the theoretical evolution of the particle growth in the absence of secondary nucleation or aggregations (see Figure SI3 in the Supporting Information). However, there are some differences that need a correct interpretation of the plotted data. Note that for the offline DLS analysis two averages are provided; the intensity-average, which is the natural average obtained from the DLS and the number average that is calculated from the cumulant method assuming a unimodal Gaussian distribution for the dispersed particle sizes (DLS particle size and PDI values can be found in Table SI3 in the Supporting Information). Interestingly, the evolution of the particle sizes calculated from the real-time spectroscopic techniques is closer to different average values; TUS particle sizes are in reasonable agreement with intensity-average sizes of DLS, while PDW particle sizes are closer to the number-average sizes of DLS. The matching of the TUS particle size and intensity-average particles sizes of DLS was expected, because the calibration curve that relates the wavelength exponent and particle size (see Figure SI1 in the Supporting Information) was built using intensity-average particle sizes measured by DLS. For the PDWS, there is no calibration curve to retrieve the particle size. The particle size is obtained from the theoretical dependence of the reduced scattering with the particle size as explained elsewhere.[30, 35] The only input parameters are the physical properties of the polymer particles (in this work the wavelength-dependent refractive index and the density of the MMA/BA/MAA copolymer) and the solids’ content of the dispersion. Therefore, the particle size measured can be considered as the PDWS average. Interestingly, this average (obtained from the reduced scattering obtained with the laser with lowest wavelength of the probe; 636 nm, the most sensitive one) seems to be in excellent agreement with the number-average particle size measured by DLS. In literature, different comparisons can be found, but there is not a consensus about which average is provided by PDWS.[15-17, 22, 35]
4 Conclusions
In the present work, an emulsion polymerization process to produce an MMA/BA/MAA copolymer latex was monitored by simultaneously using TUS and PDWS equipments. A calorimeter reactor was equipped with both spectroscopic instruments. For PDWS, a probe was introduced into the reactor medium allowing inline measurements, while, for TUS, an automatic dilution system was built-in that was able to extract and dilute the sample before the analysis in the measurement cell.
Thus, real-time inline and online particle size measurements were obtained during the seeded semibatch emulsion polymerization reaction. The particle size of the monitored process changed from the initial 67 nm of the seed (and 3 wt% solids’ content) to around 200 nm (and 45 wt% solids’ content) of the final latex. Both techniques predicted well the growth of the seed particles. However, the absolute value calculated by each technique matches better with different average values calculated offline by DLS.
Acknowledgements
The authors would like to thank the financial support from the Basque Government (IT-1525-22), European Union`s Horizon 2020 Research and Innovation Programme for the funding received through the NanoPAT project (Grant agreement No. 862583), IRIS Technology Solutions SL for the TUS equipment, PDW Analytics for the PDW equipment, and innoFSPEC department from Potsdam University for the training and the help during the study.
Conflict of Interest
The authors declare no conflict of interest.
Open Research
Data Availability Statement
The data that support the findings of this study are available from the corresponding author upon reasonable request.


