Predicting VCSEL Emission Properties using Transformer Neural Networks
Abstract
This study presents an innovative approach to predicting VCSEL emission characteristics using transformer neural networks. It is demonstrated how to modify the transformer neural network for applications in physics. The model achieved high accuracy in predicting parameters such as VCSEL's eigenenergy, quality factor, and threshold material gain, based on the laser's structure. This model trains faster and predicts more accurately compared to conventional neural networks. The transformer architecture also suitable for applications in other fields is proposed. A demo version is available for testing at https://abelonovskii.github.io/opto-transformer/.
1 Introduction
Research into vertical-cavity surface-emitting lasers (VCSELs) began in the second half of the 20th century with the proposal and demonstration of their fundamental design principles.[1-6] The primary advantage of VCSELs over traditional edge-emitting lasers is their ability to emit light perpendicular to the semiconductor wafer's surface, allowing for the creation of more compact and efficient optical devices. VCSELs have found extensive applications in fields such as optical communications, sensing, and high-speed data transfer, thanks to their high efficiency and the capability to be manufactured in arrays.[6-8]
A vertical-cavity laser consists of an active region and two distributed Bragg reflectors surrounding it. The layers of the structure are made of various semiconductor materials. A combination of GaAs-AlGaAs is often used for their lattice-matched properties which allow efficient layering on a GaAs substrate, However, other combinations of lattice-matched pairs of semiconductor materials can also be used, such as GaN/AlGaN.[9] This system also varies in refractive index with changes in aluminum content, enhancing the Bragg mirror's efficiency. High aluminum concentrations form an oxide layer that aids in current confinement, enabling low threshold currents. Advancements in growth techniques include a commercial process for oxide VCSELs that focuses on uniform epitaxial thickness and aperture control, leading to high-yield, low-voltage operation with promising reliability comparable to proton-implanted VCSELs.[10] Significant research includes the development of a conductive distributed Bragg reflector (DBR) using a single material indium tin oxide demonstrating notable index contrast and reflectivity improvements through porous layers.[11] Moreover, VCSELs can be integrated into biocompatible polydimethylsiloxine (PDMS) substrates, showing potential in biomedical fields due to their effective low threshold and high output.[12] Modern VCSELs feature low threshold current densities and high output powers, making them excellent for short-range optical communications and optical interconnects.[13-15]
In calculating VCSEL parameters, various methods are applied to ascertain optical and electrical characteristics, including electric field distribution inside the resonator, reflection, and transmission coefficients, eigenmodes, threshold values, etc. Analytically, the Transfer-Matrix Method is utilized to calculate the reflection and transmission coefficients of multilayer structures and to find eigenenergies, particularly effective in 1D systems.[16] For more complex geometries, including 2D and 3D systems, numerical methods such as Finite-Difference Time-Domain, Finite Element Method, and Eigenmode Expansion provide detailed insights into the behavior of nanostructures and allow for comprehensive modeling of optical devices.[17]
Traditional VCSEL modeling methods often involve complex simulations and empirical models, requiring extensive computational resources and in-depth knowledge of the underlying physical processes. These methods can be time-consuming and computationally intensive, as each structural modification necessitates a new simulation, further increasing the time and complexity involved. Therefore, developing faster modeling techniques, such as neural networks, is crucial for efficient VCSEL design and analysis.
The recent advancements in neural networks and machine learning architectures have had a significant impact on various fields, including natural language processing, computer vision, and, more recently, the modeling of complex physical systems. Artificial neural networks (ANNs) were used to approximate the electromagnetic responses of complex plasmonic waveguide-coupled with cavities structure (PWCCS).[18] The ANNs used in that study were optimized by using genetic algorithms (GA) varying hyperparameters such as the number of layers, neurons per layer, solvers for weight optimization, and activation functions for the hidden layers. The study demonstrates that ANNs can significantly improve the efficiency of spectrum prediction and inverse design for PWCCSs. The results indicate that the trained ANNs can predict the electromagnetic spectrum with high precision using only a small sampling of simulation results. The use of ANNs, optimized via GA, provides a more efficient method for both spectrum prediction and inverse design in PWCCSs, addressing key challenges in computational cost and data consistency, thus advancing the design and optimization of complex photonic devices.
There are several examples of feedforward neural networks for photonics.[19, 20] They were used to learn electromagnetic scattering with variable thicknesses and materials, proposing a tandem architecture for forward simulation and inverse design.[21] Peurifoy et al. used a feedforward neural network with four hidden layers to approximate light scattering in core-shell nanoparticles.[22] Malkiel et al. developed a neural network with multiple layers for direct on-demand engineering of plasmonic structures.[23] Tahersima et al. built a robust deeper network based on a feedforward neural network for the inverse design of integrated photonic devices, utilizing intensity shortcuts from deep residual networks.[24] Generative adversarial networks (GAN) are usually used for generating patterns, particularly in tasks involving design optimization of metasurfaces and other photonic structures. Liu et al. combined a GAN with a simulation network to optimize metasurface patterns.[25] Jiang et al. used GANs to produce high-efficiency, topologically complex devices for metagrating design.[26]
The authors present a method to optimize the Q factors of 2D photonic crystal (2D-PC) nanocavities using deep learning.[27] The authors created a dataset of 1000 nanocavities with randomly displaced air holes and calculated their Q factors using first-principles methods. They trained a four-layer neural network, including a convolutional layer, to understand the relationship between air hole displacements and Q factors. The neural network could predict Q factors with a standard deviation error of 13% and estimate the gradient of Q factors quickly using back-propagation. This allowed them to optimize a nanocavity structure to achieve an extremely high Q factor of 1.58 × 10⁹ over ∼106 iterations, significantly surpassing previous optimization methods. It was shown that the deep learning-based approach provides a highly efficient method for optimizing the Q factors of 2D-PC nanocavities, making it feasible to explore large parameter spaces and achieve significantly higher Q factors than possible with traditional optimization methods. Another promising application of neural networks in photonics is the Tandem Neural Network (TNN) architecture, which combines a forward model for predicting device performance with an inverse design network for optimizing structural parameters based on desired outcomes. This approach has been successfully applied to perovskite solar cells, enabling efficient optimization of optical structures and bridging the gap between theoretical and experimental efficiencies.[28]
These insights show the potential of integrating machine learning techniques with photonic system design to enhance performance and efficiency.
One such breakthrough is the Transformer architecture, which has demonstrated exceptional capabilities in handling sequential data.[29] Transformers are advanced neural network architectures designed to model complex relationships in data. They consist of encoder and decoder layers, where the encoder extracts features from the input, and the decoder uses this information to produce predictions. A key innovation in transformers is the self-attention mechanism, particularly multihead attention, which enables the model to assess the relative importance of each input element in the context of others.[29] This mechanism captures intricate patterns and contextual dependencies with remarkable efficiency. Additionally, transformers employ embedding layers that map input data, such as words or numerical parameters, into a high-dimensional space, allowing the model to understand relationships based on their positions in this space. These features collectively make transformers highly effective for tasks requiring deep contextual understanding.[29]
Deep learning has already proven its efficacy in analyzing, interpolating, and optimizing complex phenomena in various fields, including robotics, image classification, and language translation. However, the application of neural networks in photonics is still in its early stages, and there are many challenges that this approach encounters.
Recently, researchers have started to use deep learning to accelerate the simulation process, leveraging its strong generalization ability, including Transformer.[30-32]
Although obtaining the training dataset through physical simulation can take some time, such an investment is a one-time expenditure. Once trained, these neural networks are capable of capturing the general mapping between the space of structures and the space of optical properties, serving as a fast and computationally efficient surrogate model to replace physical simulations. While they leverage the advantages of large language models, they often overlook the direct integration of physical quantities and their intrinsic nature.
Our work is aimed at adapting the Transformer architecture for tasks in mathematics and physics. We used embeddings that indicate the physical properties and conditions of the object, shifting the transformer into the physical plane. As an application demonstrating our transformer's capabilities, we chose the task of predicting VCSEL emission parameters. Our approach combines physical and trainable embedding components, uses positional encoding to preserve order information, and a multi-layer decoder structure to process input data and generate accurate predictions.
The flexibility and adaptability of the transformer allow our model to successfully work with various types of laser structures and operating conditions, applying the architecture to model VCSEL, including its components such as DBR and a single layer, which we call here as Fabry-Pérot. Our goal is to provide a reliable and adaptable tool capable of accurately predicting key emission parameters, such as eigenenergies, their quality factors, and the threshold material gain, thereby facilitating the design and optimization of advanced photonic systems.
In this study, we focus on these core characteristics. However, with greater computational resources, this approach could be extended to train neural networks for predicting more complex phenomena, such as field distribution within structures, thermal characteristics, and beyond. Our work opens up new possibilities for using advanced neural network architectures in the field of photonics and beyond.
2 Models of Nanostructures
In developing our VCSEL model, we relied on the framework described in the work by P. Bienstman et al., which provided a standard VCSEL model concept.[33] A complete tutorial on recreating this model in COMSOL is also available, including calculations of the eigenmodes of the structure and the threshold material gain.[34] The model represents a typical VCSEL, which includes two Bragg reflectors with a resonant cavity between them. Located at the center of this cavity is the active layer, which plays a key role in the generation of radiation. A 2D axial model is used in COMSOL. To simplify the original model, we removed the oxide apertures and other inhomogeneities along the radius, which allowed us to reduce the computational complexity without significantly losing accuracy in predicting parameters.
In addition to examining the full VCSEL, we begin our study with simpler models. Initially, we train our model using a single active layer in a medium, which we refer to as a Fabry-Perot resonator. We then move on to a more complex structure—the Bragg reflector. Only after these preliminary steps do we proceed to analyze the complete VCSEL. These intermediate steps with simpler models allowed us to better understand how to approach neural network training: optimizing layer sizes, adapting to various conditions, and determining key parameters for each structure. Using simplified models at the initial stages also helped us tune the neural network for more precise perception and analysis of fine details in more complex configurations, which was crucial for successful modeling.
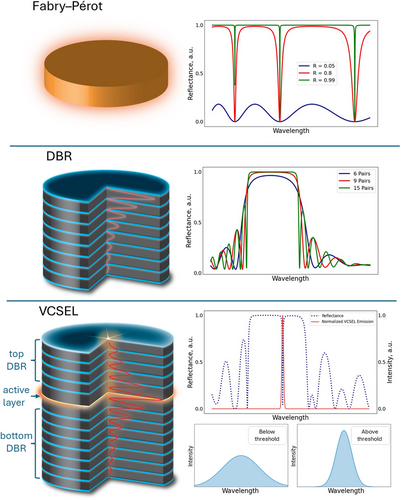
We generated ≈150,000 distinct models across three primary categories: Fabry-Perot structures (one layer in the medium), distributed Bragg reflectors (DBRs), and complete VCSEL configurations, utilizing COMSOL Multiphysics software for simulation.
-
Top Section: Fabry-Pérot
-
In the top portion of the figure, the Fabry-Pérot is depicted. It consists of an active layer, which is responsible for the light interaction.
-
The typical reflection spectrum of the Fabry-Pérot interferometer is shown on the right of the diagram. This spectrum illustrates how the reflection characteristics change with varying reflectivity levels of the mirrors. Peaks in the spectrum correspond to wavelengths that resonate within the cavity, while troughs represent non-resonant wavelengths.
-
-
Middle Section: Distributed Bragg Reflector (DBR)
-
The middle section of the figure features a Distributed Bragg Reflector (DBR). This structure comprises alternating layers of materials with different refractive indices. These layers are designed to reflect specific wavelengths of light through constructive interference. The distribution of the field within this structure is also depicted.
-
To the right, the reflectance spectrum of a typical DBR is shown. This spectrum indicates how the reflectance varies with the number of layer pairs in the DBR. More pairs result in higher reflectivity, which is crucial for creating highly reflective mirrors in optical devices.
-
-
Bottom Section: Vertical-Cavity Surface-Emitting Laser (VCSEL)
-
The bottom section of the figure presents a Vertical-Cavity Surface-Emitting Laser (VCSEL). The VCSEL contains a gain medium positioned between two DBRs, forming a vertical optical cavity. This design allows the laser to emit light perpendicular to the surface of the device. The distribution of the field within this structure is also depicted.
-
To the right of the VCSEL diagram, two spectra are displayed. The first spectrum is a typical reflectance spectrum, showing how the DBRs reflect light at specific wavelengths. The second spectrum illustrates the emission characteristics of the VCSEL, showing how the device emits light both below and above the lasing threshold.
-
These models spanned a broad spectrum of VCSEL designs by varying parameter values, including the real and imaginary components of the refractive index, and layer thicknesses. Materials commonly used in VCSEL construction such as GaAs, AlAs, AlGaAs, TiO2, SiO2, Si, and Si3N4 were incorporated into our simulations.
For the single-layer models, a range of initial energy values was used for the calculations. The real refractive index (n) and imaginary refractive index (k) values, as well as the thickness, were varied extensively. For the DBR and VCSEL structures, the n and k values were chosen to match the material pairs used and were dependent on the specified initial energy ranges for the calculations. The layer thicknesses were adjusted to ensure that each layer had an optical thickness equal to a quarter-wavelength or a half-wavelength, optimizing the optical properties. Moreover, initial energy values for DBR and VCSEL did not exceed two electron volts to avoid increased material dissipation, which is common in most materials at higher energy levels.
Furthermore, the number of layer pairs in the DBRs varied extensively, from one to fifty pairs in pure DBR models and between twenty to forty-five pairs in the upper and lower DBRs of VCSEL models. In VCSELs, the number of pairs in the upper layers was always less than in the lower layers to optimize the structural symmetry and performance. The thickness of the quantum wells was also varied between 5 and 15 nm to study different energy configurations, primarily focusing on models where the threshold material gain was not excessively high to better understand effective laser models. For the data types involving only DBRs, no active layers were added, thus no threshold material gain calculations were needed for these types.
For all materials used in the structures, literature data for the real (n) and imaginary (k) parts of the refractive index were utilized, thus accounting for absorption within the structures. As the simulations were conducted in a surrounding medium, radiative losses were implicitly included. The simulation models had sufficiently large radii to neglect edge-related losses, which are commonly minimized in practice through the use of oxide apertures in VCSEL designs.
To input information about the structure into the neural network, we first need to determine the format in which it will be presented. Each structure can be uniquely represented by a record in the following format:
ENERGY <value>
BOUNDARY N <value> K <value>
PAIRS_COUNT <value>
{ LAYER THICKNESS <value> N <value> K <value> ;
LAYER THICKNESS <value> N <value> K <value> }
LAYER THICKNESS <value> N <value> K <value>
LAYER THICKNESS <value> N <value> K <value>
LAYER THICKNESS <value> N <value> GAIN <value>
LAYER THICKNESS <value> N <value> K <value>
PAIRS_COUNT <value>
{ LAYER THICKNESS <value> N <value> K <value> ;
LAYER THICKNESS <value> N <value> K <value> }
BOUNDARY N <value> K <value>
In this structured record format, we use tokens followed by their respective values. The sequence starts with the ENERGY value, which is necessary for various tasks, followed by a description of the structure itself. For describing boundaries, we use the BOUNDARY token followed by parameters N and K, where N is the token for the real part of the refractive index n, and K represents the imaginary part of the refractive index k. When describing any layer, we use the LAYER token followed by three parameters: THICKNESS, N, and K. However, for active layers, instead of using K, we specify GAIN to denote the gain medium, where GAIN describes the amplification of the laser light within that layer. For structures like Distributed Bragg Reflectors (DBRs), we start the record with PAIRS_COUNT and then describe each pair of layers enclosed in curly braces {}.
In our work, we utilize transformer neural networks, which are particularly adept at processing embeddings for input data. Embeddings are methods of representing data as fixed-size vectors that can be handled by the neural network. Generally, embeddings transform heterogeneous data into a unified vector space, making them extremely valuable for machine learning applications.
In the context of our project, we have implemented one-hot embeddings to represent each quantity used as input for the neural network. These embeddings are designed not only to represent numerical values such as layer thickness or refractive index (both real and imaginary components) but also to encapsulate the physical meaning of each quantity and specific conditions such as boundary or DBR layers.
To accurately model and predict the physical parameters of nanostructures, we structured the input embeddings to capture the main physical properties of these structures. These embeddings specify key quantities like layer thickness, refractive index (real and imaginary components), and specific conditions such as boundary or DBR layers. Each physical embedding is a vector containing detailed information about these properties, allowing the model to retain critical quantitative details essential for precise simulations.
Table 1 shows an example of how these physical embeddings are structured for the DBR case:
| Energy | Thickness | N | K | GAIN | Boundary | DBR | Pairs | Value | |
|---|---|---|---|---|---|---|---|---|---|
| 1 | 1 | 0 | 0 | 0 | 0 | 0 | 0 | 0 | 1.2 |
| 2 | 0 | 0 | 1 | 0 | 0 | 1 | 0 | 0 | 1.0 |
| 3 | 0 | 0 | 0 | 1 | 0 | 1 | 0 | 0 | 0.0 |
| 4 | 0 | 0 | 0 | 0 | 0 | 0 | 1 | 1 | 40 |
| 5 | 0 | 1 | 0 | 0 | 0 | 0 | 1 | 0 | 136.49 |
| 6 | 0 | 0 | 1 | 0 | 0 | 0 | 1 | 0 | 3.46 |
| 7 | 0 | 0 | 0 | 1 | 0 | 0 | 1 | 0 | 0.0 |
| 8 | 0 | 1 | 0 | 0 | 0 | 0 | 1 | 0 | 15.03 |
| 9 | 0 | 0 | 1 | 0 | 0 | 0 | 1 | 0 | 2.95 |
| 10 | 0 | 0 | 0 | 1 | 0 | 0 | 1 | 0 | 0.0 |
| 11 | 0 | 0 | 1 | 0 | 0 | 1 | 0 | 0 | 1.0 |
| 12 | 0 | 0 | 0 | 1 | 0 | 1 | 0 | 0 | 0.0 |
-
First Five Columns (Energy, Thickness, N, K, GAIN): These columns determine the nature of the physical quantity.
-
Energy: Indicates whether the row represents energy parameters.
-
Thickness: Specifies the layer thickness in nanometers.
-
N: Represents the real part of the refractive index.
-
K: Denotes the imaginary part of the refractive index.
-
GAIN: For active layers, the gain is represented instead of K.
-
-
Boundary: This column indicates whether the parameter pertains to the upper or lower part of the structure.
-
DBR Indicator: This column specifies whether the value is related to the DBR layer pairs.
-
Pairs: Indicates the number of layer pairs in the DBR.
-
Value: Represents the specific value associated with the physical property described by the embeddings in the row.
For instance, a row with a ‘1’ in the “Thickness” column and ‘0’s in the other first five columns indicates that the embedding represents a thickness value. The “Boundary” column would then show if this thickness pertains to the upper or lower layer, and the “DBR” columns indicate if this thickness is associated with a DBR layer.
This type of embedding schema allows for clear and convenient identification of physical quantities across all types of nanostructures under consideration. Each embedding vector uniquely encodes specific physical parameters, making it easier to systematically represent and analyze diverse attributes such as energy, thickness, refractive indices, and layer properties.
For example, from Table 1, we can precisely deduce that we are examining the parameters of the DBR for energy at 1.2 eV on the lower boundary with n = 1 and k = 0. It specifies 40 layer pairs. The first layer in the pair has a thickness of 136.49 nm, n = 3.46, and k = 0. The second layer in the pair has a thickness of 15.03 nm, n = 2.95, and k = 0. The parameters for the upper semi-infinite medium are n = 1 and k = 0.
By including these embeddings, the model is equipped to handle the complex relationships between physical properties and the resulting optical behaviors of nanostructures. The detailed configurations for other cases are provided in the Section “Additional Embeddings” (Supporting Information).
This detailed capture of physical parameters through embeddings is a crucial step before delving into the transformer model's architecture, described in the following section.
We initiate the training of our model with simpler structures such as the Fabry-Perot resonator. Subsequently, we progress to more complex structures like DBR. Finally, we train the model to determine parameters for Vertical-Cavity Surface-Emitting Lasers (VCSELs).
The output from the model includes critical parameters such as energy, quality factor (Q-factor), and threshold material gain (TMG).
-
Eigenvalues Implementation: This version is engineered to calculate the two closest eigenvalues E1 and E2 to a specified target energy, using the input energy E to define the search region.
-
Quality Factor Implementation: This variant calculates the quality factor Qi using the energy eigenvalue Ei, relevant to where the Q-factor had to be evaluated.
-
Threshold Material Gain Implementation: In this implementation, the model uses the first eigenvalue E1 to determine the threshold material gain (TMG) gth. It is designed to compute both the gth and the corresponding energy Er, a crucial step as TMG is directly linked to the specific energy level at which the lasing threshold occurs.
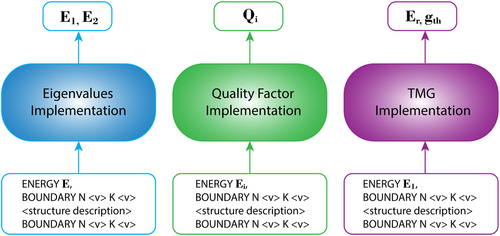
For all three implementations, we consider three types of structures: single-layer, DBR, and VCSEL. Unlike the first and third types, the DBR is not a resonator in the conventional sense, and therefore we do not calculate the threshold material gain for this structure. However, we do calculate its so-called eigenmodes and their quality factors.
To clarify the concept of ‘eigenmodes’ in DBRs, we conducted eigenfrequency calculations in COMSOL to identify resonance-like states within a standalone DBR. These states correspond to field localization within the DBR layers, arising from the intrinsic properties of the structure. While these are not eigenmodes in the traditional sense of cavity modes, they provide valuable insights into the optical behavior of DBRs. The correlation between field localization and various macroscopic characteristics of the reflector was demonstrated, ensuring the physical justification of this parameter.[35-37] In our work, we use the term ‘eigenmodes’ for DBRs to maintain consistency with the terminology used for other structures and to avoid unnecessary complexity.
Each implementation tailors the transformer to effectively solve a specific type of problem, ensuring high precision and applicability to different aspects of laser performance.
3 Transformer Model Description
The architecture of our model is presented in Figure 3. This is a modified transformer model adapted to solve the problem of determining the VCSEL radiation parameters based on the model parameters.[29]

The input data consists of parameters from the physical model of the VCSEL, such as geometry and materials.
Each physical quantity associated with the VCSEL is represented by what we call a “physical embedding.” These embeddings contain vectors with information about specific physical quantities like energy, thickness, and refractive index (Table 1). The inclusion of physical embeddings allows the model to retain critical quantitative details, which are pivotal for accurate simulations.
To extend the model's capability beyond static physical representations, trainable embeddings are also incorporated. This allows the model to adapt and identify patterns autonomously, creating what we refer to as hybrid embeddings. These are combinations of physical values and contextual information, enriching the model's learning substrate and enabling a more dynamic adaptation to complex physical phenomena.
After the integration of hybrid embeddings, positional encoding is added to the mix. This step is essential for maintaining the sequence order of input data, especially crucial for transformer models where the relative positions of elements significantly influence the processing outcomes.
The processed data then enters the encoder, which consists of several layers, each with blocks of Multi-Head Attention and Feed Forward layers. The encoder extracts significant features from the data, with the Multi-Head Attention allowing the model to focus concurrently on different segments of the input sequence, thereby enhancing the detail and quality of information extraction. The Feed Forward layers are crucial as they enable the model to learn complex dependencies within the input data.
After encoding, the data are recombined with their original corresponding physical quantities. This recombination is vital for enhancing the model's accuracy and stability as it progresses through the network, maintaining essential information about the physical parameters. All vectors are subsequently amalgamated into a single comprehensive vector that is fed into the decoder.
The decoder, a conventional sequential model consisting of several fully connected layers, processes the combined data. It predicts the final characteristics of the VCSEL, such as eigenenergy, quality factor, and threshold material gain.
This architecture effectively models and predicts the physical parameters of complex structures, achieving high accuracy and adaptability in VCSEL characteristic prediction. This approach is a testament to our commitment to leveraging cutting-edge AI techniques to solve complex challenges in photonics engineering.
4 Results
Initially, we trained our model separately for each type of structure—namely Fabry-Pérot, Distributed Bragg Reflector, and Vertical-Cavity Surface-Emitting Laser. This step-by-step approach allowed us to focus on the unique characteristics and requirements of each structure type, ensuring that the model could accurately interpret and process the distinct physical properties inherent to each.
However, during the course of our research, we discovered that a unified model, capable of handling all types of structures simultaneously, significantly improved predictability. To implement this, we employed a masking technique within the transformer architecture. This technique enables the model to manage varying sequence lengths and adapt dynamically to the structural complexities of each type. The use of masking ensures that irrelevant or non-applicable parts of the input data are ignored during the training process, allowing the model to focus only on pertinent information.
When trained on the entire set of structures as a single dataset, the model demonstrated enhanced capability in accurately predicting the output parameters. This indicates not only a higher degree of generalization but also an improved ability to capture and process the nuances across different nanostructures.
To ensure reliability and to prevent overfitting, techniques such as dropout and k-fold cross-validation were implemented during training. Mean squared error (mse) was utilized as the error metric.
For all three implementations, we used the following model parameters: the number of trainable embeddings was set to 5, the number of attention heads was 8, and the hidden layer size in the encoder was 128, with 5 encoder layers.
4.1 Eigenenergy Predictions
The distribution of the first two eigenenergies calculated for all data types in COMSOL is presented in Figure 4. The first and second identified eigenenergies are illustrated in Figure 4a,b, respectively.
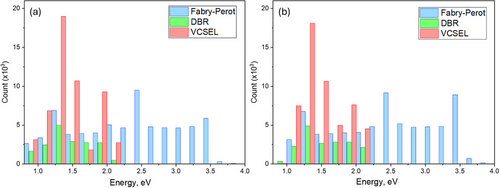
For DBRs and VCSELs, the eigenenergies generally did not significantly exceed 2 eV, remaining closely within the initial energy ranges used for searching. The similarity in eigenenergy distributions for both modes can be attributed to the 2D axial symmetry considered in the simulations. In such symmetrical systems, there tend to be modes with similar eigenenergy but different azimuthal mode numbers.
The results of training to predict the first two eigenenergies are presented in Figure 5. For this model, the transformer outputs two eigenenergies directly. Errors were calculated as the average error across both values. The graph in Figure 5a shows the mean absolute percentage error (MAPE) dependency on the epoch. By the 144th epoch, the error reaches 0.4%. Figure 5b illustrates the dependence of the coefficient of determination (R2) on the epoch. It is also evident that by the 144th epoch, the coefficient of determination reaches 0.9993, which is very close to 1, indicating that the model explains 99.93% of the data variation, demonstrating high accuracy and reliability of the predictions. The learning rate also varied during the training process.
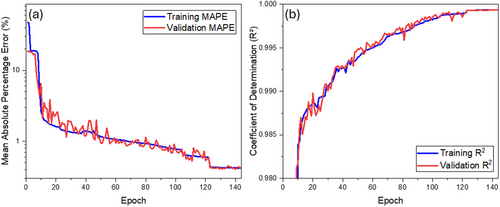
For all data (comprising training, validation, and test data), the errors are as follows: Average MAPE Loss is 0.4%, and the standard deviation of the error σ is 0.5%.
Figure 6 shows the distribution of true and predicted values for data that were not involved in the training process (test data). The figures depict a) the distribution of the first eigenenergy and b) the distribution of the second eigenenergy. It can be observed that across the entire training interval, the model accurately predicts the energy values for various VCSEL configurations.
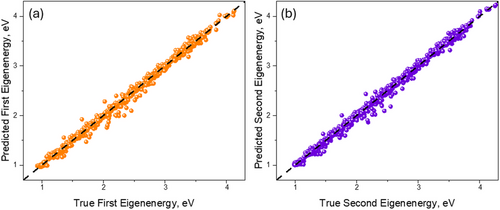
The predictive performance of the transformer model in accurately determining the first two eigenenergies, along with its rapid convergence within just 144 epochs, underscores the robustness and reliability of our approach. The minimal variation observed in the predicted data further reinforces the model's efficiency, making it a formidable tool in the study and optimization of VCSEL configurations.
4.2 Quality Factor Predictions
Figure 7 displays the distribution of the logarithm of the Q-factor for all data types calculated in COMSOL, using a logarithmic scale.
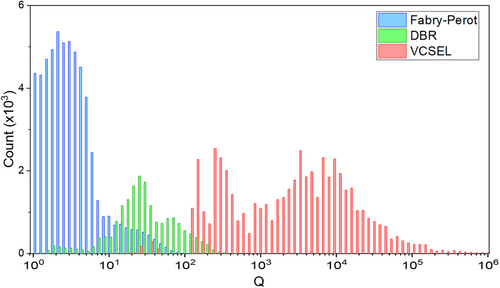
The histogram shows that each data type exhibits distinct Q-factor ranges. Single layers typically have low Q-factors not exceeding 100, DBRs range from 10 to 500, and VCSELs vary from 100 to 106, aligning with expectations for these structures.
Following our successful eigenenergy predictions, we utilized our transformer model to forecast the quality factor (Q-factor) of VCSELs based on specified eigenenergy values and VCSEL configurations.
The training outcomes for predicting the Q-factors are illustrated in Figure 8a, which displays the mean absolute percentage error over epochs. By the 240th epoch, the error rates were 2.2% for training data and 2.8% for validation data. Figure 8b shows the evolution of the coefficient of determination (R2), reaching 0.97 for training data and 0.94 for test data by the 240th epoch.
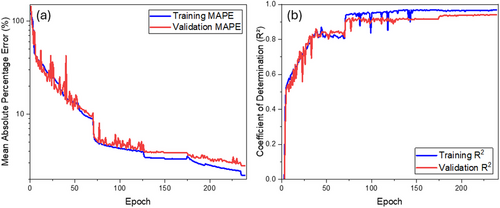
Overall, for all data, the average MAPE Loss was 2.3%, with σ at 4.8%.
Figure 9 presents the distribution of true and predicted values for the test data, involving 14,000 configurations.
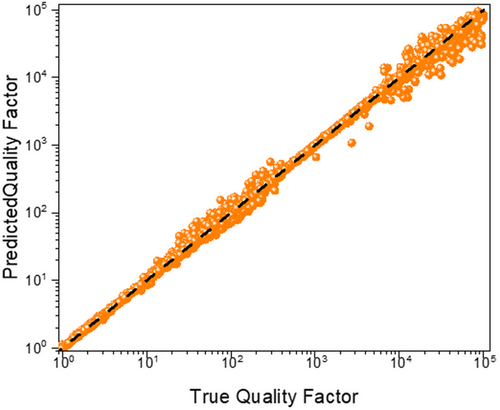
While the model required a slightly longer training period to achieve precision in Q-factor predictions, it efficiently computed results within a reasonable timeframe. Considering the complexity involved in predicting the Q-factor, which ranges broadly from 1 to 105, the model's performance is noteworthy. This achievement underscores the transformer model's capability to handle complex, high-dynamic-range predictions effectively, further validating its utility in advanced VCSEL design and analysis, as well as other applications.
4.3 Threshold Material Gain Predictions
For the training, the model seeks both the energy and threshold material gain (TMG) since the generation energy does not always match the system's inherent energy. In the COMSOL model, finding the TMG involves an iterative process of searching both TMG and energy. For VCSELs, this iterative process results in energies that coincide with the eigenenergies due to the resonant structure of the devices. In contrast, for single layers, the iterative process may lead to optimal generation energies that do not align with the eigenenergies, lacking the resonant effect seen in multilayer structures. Thus, the model searches for both TMG and energy simultaneously.
Histograms of resonant energies (a) and threshold material gain gth (b) are presented in Figure 10.
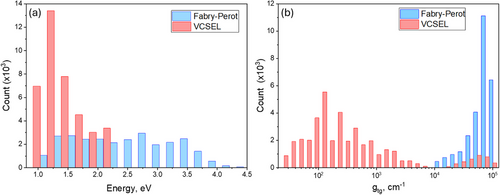
The data reveal that resonant energies for VCSEL systems are generally not much higher than 2 eV. For threshold material gains, there is a clear separation between single layers and VCSELs, with single layers exhibiting a wide range from 104 to 105 cm−1 and VCSELs typically below 1000 cm−1, although a small proportion of models show higher values up to 105.
The training results for finding gth and resonant energies are presented in Figure 11a. It shows the dependence of the mean absolute percentage on the epoch. By the 433rd epoch, the error reaches 0.4% on average for both metrics. Figure 11b displays the relationship of the coefficient of determination (R2) over the epochs. It is also evident that by the 433rd epoch, the coefficient of determination reaches 0.9993, which is very close to 1, indicating that the model explains 99.93% of the data variation.
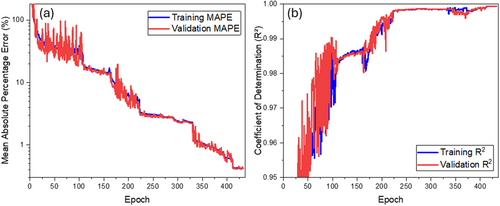
For all data, the errors are as follows: the average MAPE is 0.6% for energies and 1.0% for gth, while the standard deviation of the error σ is 1.2% for energy and 1.4% for gth. However, if we calculate the errors only for complete VCSEL models, excluding single-layer models, the errors are as follows: the average MAPE is 0.12% for energies and 0.66% for gth, and the standard deviation of the error σ is 0.09% for energy and 0.3% for gth.
Figure 12 presents the distribution of true and predicted values for the test data, involving ≈6 and a half thousand configurations.

In Figure 12b, the prediction errors for TMG are shown for both single-layer models and complete VCSEL models. It is evident that the errors for the VCSEL models are significantly lower, and the data points are much more tightly aligned with the axis of true values.
4.4 Comparison of Transformer and MLP
During this study, a performance comparison was conducted between the proposed transformer model and a traditional multilayer neural network (MLP) (Figure 13), both tasked with predicting quality factors. Identical training conditions were applied to both models to ensure a fair comparison.
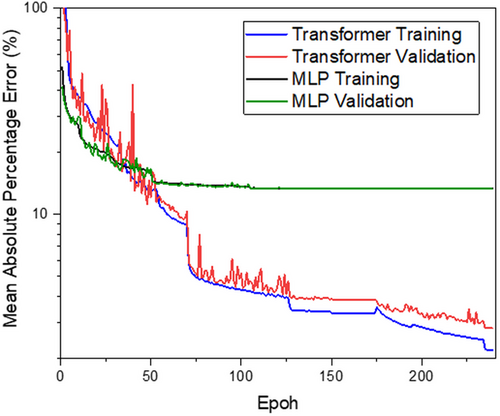
Interestingly, the MLP started with a smaller initial error and demonstrated a comparable training speed. However, it quickly reached its performance limit, with the validation error stagnating at ≈13% by the 100th epoch. In contrast, the transformer model continued to improve, achieving a validation error of 2% by the 240th epoch.
This outcome highlights the complexity of the task and underscores the advantages of the transformer architecture for such challenges. Its ability to efficiently handle data with high variability and complex structures makes it a powerful tool for photonic applications.
5 Discussion
The successful application of the transformer model to predict VCSEL emission properties has not only demonstrated high accuracy but also underscored the potential of deep learning in photonics. Through various configurations and experiments, the transformer model has proven to be robust, capable of handling complex and high-dimensional data effectively and providing reliable predictions that are critical for optimizing VCSEL designs.
The prediction model faces challenges, including the wide range of parameter values in the training dataset and the exclusion of certain environmental factors, such as temperature dependencies. To enhance prediction accuracy, future models could incorporate additional influencing factors, such as temperature or azimuthal indices for modes. Another effective way to reduce errors is by increasing the size of the training dataset. While the current model was trained on 150,000 data points, expanding the dataset to tens of millions would allow the model to better generalize across a broader parameter space, reducing errors and improving the reliability of predictions. To further enhance prediction accuracy and its application in the industry, one could consider using conformal predictions or a two-level model. In the framework of a two-level model, the first part would predict a range of values, and the second, trained within this range, would refine the results. This approach can provide additional accuracy and reliability of predictions, which is especially important for industrial applications.
The model demonstrates significant potential not only in terms of modeling accuracy and speed but also in building a statistical foundation for further exploration. Rapid response times enable the identification of hidden dependencies between structural and optical parameters, facilitating a deeper understanding of device physics. An example of this capability is presented in the Section “Exploring the Relationship Between Structural Parameters and Optical Properties,” (Supporting Information) where we demonstrate the fast generation of a contour map of threshold material gain (TMG) as a function of eigenenergy and Q-factor. This map helps identify regions that represent optimal configurations for efficient laser operation.
The potential applications of the transformer extend beyond direct modeling. The model can be adapted for inverse design tasks, where desired optical characteristics, such as minimal threshold power or maximum Q-factor, are used to generate optimized structural designs. This is made possible through the standard transformer decoder, which allows for generating structural solutions based on specified conditions. Furthermore, leveraging the transformer for inverse design could substantially improve device design efficiency. For example, this approach could be applied to the design of metasurfaces, photonic crystals, or other optical devices, enabling the synthesis of structures with tailored optical properties. Similarly, neural networks have already been employed to optimize the structure of perovskite solar cells, enhancing their efficiency through analysis and inverse design.[28] Our work showcases the broader applicability of the transformer architecture in photonics, with VCSEL serving as an illustrative example of its capabilities.
The model's flexibility allows for future enhancements, such as calculating current spectra and incorporating convolutional layers to analyze electromagnetic field distributions in complex laser structures. Additionally, simulating temperature effects and other environmental factors could broaden its applications. These expansions would enhance its utility in designing and optimizing advanced photonic systems, making it a more comprehensive tool in photonics.
6 Conclusions
In this study, we have introduced and validated a novel approach using transformer-based neural networks to predict VCSEL emission properties, marking a significant advancement over traditional simulation methods. This approach is faster, more accurate, and computationally efficient, making it a game-changer for VCSEL technology.
The transformer model achieved exceptional accuracy in predicting key parameters such as eigenenergy, quality factor, and threshold material gain. This precision is critical for the design and optimization of VCSELs, demonstrating the model's high accuracy and efficiency. By comparing the transformer model with traditional multilayer neural networks, we underscored its superior capability in handling complex photonics simulations.
The success of this model in VCSEL technology also has broader implications for photonics. It opens the door to applying this innovative approach in other areas of photonics where similar challenges in simulation and design exist.
In conclusion, the application of transformer-based neural networks represents a significant leap forward in the field of photonics, particularly in the modeling and simulation of VCSELs. Our work demonstrates the practical benefits of this technology and lays a solid foundation for its broader application in the field, setting the stage for future advancements and innovations.
Acknowledgements
A.B. and E.G. contributed equally to this work.
Conflict of Interest
The authors declare no conflict of interest.
Open Research
Data Availability Statement
The data that support the findings of this study are available from the corresponding author upon reasonable request.


