Arbuscular mycorrhizal fungi alleviate the negative effect of nitrogen deposition on ecosystem functions in meadow grassland
Abstract
Nitrogen (N) deposition can reduce plant species richness and cause grassland degradation, thus affecting grassland ecosystem stability. Arbuscular mycorrhizal (AM) fungi play an important role in ecosystem stability. However, the influences of AM fungi on grassland ecosystem stability under N deposition remain unclear. We need more information on the impacts of N accumulation on the interactions between AM fungi and the plant community. To test the contribution of AM fungi to grassland stability under N deposition, a 5-year field experiment was conducted in a temperate meadow with two manipulated factors, namely, N addition and AM fungi suppression. The plant species richness and diversity, biomass stability, litter decomposition, and greenhouse gas emissions were quantified. Under N addition, AM fungi did not affect the plant species diversity and richness but altered the coverages of different functional groups and increased the aboveground productivity and biomass stability. Litter decomposition increased under N addition and increased more in the treatment where AM fungi were not suppressed. The emissions of N2O and CH4 in the AM fungi suppression treatment were much higher than those in the nonsuppression treatment under N addition. Our results suggest that AM fungi can alter the plant community structure, increase plant productivity and community biomass stability, accelerate litter decomposition, and reduce the soil total N concentration and emissions of N2O and CH4 under N addition. Our results highlight that the conservation of AM fungi should be considered to alleviate grassland degradation and maintain grassland ecosystem multifunctionality in the future considering global change.
1 INTRODUCTION
With the increase of industrial fossil fuel consumption and agricultural fertilizer application, there have been increasing nitrogen (N) inputs into terrestrial ecosystems. In many areas of the world, N deposition rates are much higher than in the pre-industrial era and are expected to reach 200 Tg yr−1 by 2050 (Galloway et al., 2008). Although increased N deposition could improve plant growth and increase net primary productivity by increasing the soil N availability (Frink, Waggoner, & Ausubel, 1999; Xia & Wan, 2008), elevated N deposition can also have negative effects on ecosystem stability (Xu et al., 2015) and reduce grassland ecosystem function (Dias et al., 2017; Zhao et al., 2019). For instance, N deposition has caused plant species loss (Clark & Tilman, 2008), decreased soil microbe species (e.g., arbuscular mycorrhizal [AM] fungi) diversity (Liu et al., 2012; Zhang, Yang, Guo, & Guo, 2016), increased N2O greenhouse gas emissions (Avrahami & Bohannan, 2009; Yan et al., 2018), and reduced soil organic carbon sequestration (Li et al., 2018). Moreover, the temporal stability of the plant community, which is defined as the inverse of the temporal variability that measures the variation of aboveground biomass over time (Hautier et al., 2014), could also be reduced by N deposition (Xu et al., 2015). However, most of the previous studies have focused on the effects of N deposition on either aboveground or belowground, whereas the influence of belowground (soil microbe) on the aboveground ecosystem function remains unclear under N deposition conditions.
AM fungi are a very widespread group of soil microbes that may contribute to terrestrial ecosystem stability by increasing plant diversity and productivity (van der Heijden et al., 1998; Yang, Wagg, Veresoglou, Hempel, & Rillig, 2018) and affecting plant–plant competition (Wagg, Jansa, Stadler, Schmid, & van der Heijden, 2011). Under greenhouse conditions, AM fungi can influence N cycling by improving plant N uptake (Bender & van der Heijden, 2015; Cavagnaro, Barrios-Masias, & Jackson, 2012), facilitating the transfer of N to their host plants from organic material (Hodge, Campbell, & Fitter, 2001; Leigh, Hodge, & Fitter, 2009), reducing soil nutrient leaching by enhancing nutrient interception (Bender & van der Heijden, 2015), and decreasing N2O emissions by increasing N immobilization into microbes or plants (Bender et al., 2014); therefore, AM fungi can alleviate the negative effects of N enrichment on plant species evenness by promoting legumes and suppressing grasses (van der Heijden, Verkade, & de Bruin, 2008). However, the influences of AM fungi on grassland ecosystem functions under field conditions are still not well understood.
Although AM fungi play an important role in maintaining ecosystem stability, the development and species composition of AM fungi are often influenced by N deposition in many ecosystems. Previous studies have found that N fertilization decreased the AM fungi spore abundance (Antoninka, Reich, & Johnson, 2011), species richness (Egerton-Warburton, Johnson, & Allen, 2007), and extraradical hyphae length density (Liu et al., 2012), in addition to altering their species composition (Egerton-Warburton & Allen, 2000; Johnson, 1993; Liu et al., 2012; Zhang et al., 2016). These reductions of AM fungi spore abundance and species richness and the changes in AM fungi species composition caused by N addition could alter ecosystem stability by influencing plant community composition (Johnson, Rowland, Corkidi, & Allen, 2008). Moreover, a small amount of evidence from greenhouse experiments has shown that AM fungi can reduce the negative effects of nitrogen enrichment on plant species diversity (van der Heijden Verkade, & de Bruin, 2008; Zhang et al., 2016), and the interactions between AM fungi and soil N play a key role in plant community composition (Johnson Rowland, Corkidi, Egerton-Warburton, & Allen, 2003). N enrichment could induce phosphorus (P) limitation (Mei, Yang, Zhang, Zhang, & Guo, 2019), alter the N:P ratio, and affect mycorrhizal associations (Johnson Rowland, Corkidi, Egerton-Warburton, & Allen, 2003; Johnson, 2010; Johnson, Wilson, Wilson, Miller, & Bowker, 2015). Nevertheless, whether AM fungi can alleviate the decline in grassland ecosystem function caused by N deposition and enhance grassland stability (e.g., increase carbon sequestration, accelerate litter decomposition, reduce greenhouse gas emissions, and increase plant species diversity and productivity) has not been explored adequately in the field.
Ecosystem multifunctionality is defined as the array of biological and geochemical processes that occur within an ecosystem, which is relevant to the drivers of ecosystem function (Manning et al., 2018). The aim of this study was to test whether AM fungi can reduce the negative effects of N deposition on grassland stability and ecosystem multifunctionality. A 5-year factorial N addition and AM fungi suppression experiment was conducted in a temperate meadow in northeastern China. We predicted that although N addition would reduce plant diversity and species richness, increase N2O and CH4 emissions, and increase plant productivity, these effects would be exacerbated by the suppression of AM fungi.
2 MATERIAL AND METHODS
2.1 Study site
This experiment was conducted at the Songnen meadow (44°45′N, 123°45′E) in northeast China, which is the largest meadow steppe in China. The Songnen meadow is located at the eastern edge of the Eurasian steppe. It is one of the most severe areas of N deposition globally (Richter, Burrows, Nüß, Granier, & Niemeier, 2005), and the effects of N deposition on the plants and soil have already been observed. However, the Songnen meadow is still an N-limited ecosystem (Zhang, Guo, Gao, Guo, & Sun, 2015). The annual average temperature is 5.0°C and the annual average precipitation is approximately 400 mm, 80% of which occurs from May to September. The soil in this area is characterized by typical soda-saline soil (Zhang et al., 2016), the soil pH is 8.0–9.0, and the soil organic matter is approximately 3.0% in the top soil (0–30 cm). The experimental site is dominated by the plant species, Leymus chinensis, Kalimeris integrifolia, and Carex duriuscula. The plant species appearing in the experimental plots are listed in Table S1 along with their relative abundance.
2.2 Experimental design
We conducted a completely randomized block factorial experiment with two factors, N addition and AM fungi suppression (using the fungicide benomyl), which resulted in four different treatment combinations: control (C), N addition only (N), AM fungi suppression only (benomyl), and N addition plus AM fungi suppression (NB), replicated six times. The size of the experimental plots was 2 m × 2 m. In the N addition treatment, ammonium–nitrate (10 g m−2 yr−1) was added as aqueous pulses throughout the growing season from May to September. As Bai et al. (2010) reported, the N influence on plant community composition and productivity becomes saturated when the N addition rate is approximately 10.5 g m−2 yr−1. N addition was performed 10-times in total by adding 1 g m−2 of ammonium–nitrate with 40 L of water every 2 weeks because the high frequency of N addition can aid in avoiding the overestimation of the effects of N addition on plant species loss (Zhang et al., 2016). In the AM fungi suppression treatment, the fungicide benomyl (24-g active ingredient in 40-L water per plot) was added as a soil drench every 2 weeks following O'Connor, Smith, and Smith (2002), for a total of 10-times. Benomyl is widely used to suppress the activities of AM fungi in the field (Carey, Fitter, & Watkinson, 1992; Hartnett & Wilson, 1999; O'Connor, Smith & Smith, 2002; Wilson & Hartnett, 1997; Yang et al., 2014) because it can suppress the colonization of plant roots by glomalean fungi (Merryweather & Fitter, 1996). In the N addition plus AM fungi suppression treatment, the same amounts of ammonium–nitrate (10 g m−2 yr−1) and benomyl were added. In the control, the same amount of water was added. The air temperature and precipitation were measured using an eddy covariance system (CPEC310, Campbell Scientific Inc. USA) close to the experimental site (Figure S1). The field experiment started in May 2013 and lasted for 5 years. All treatments were conducted at the same rate/frequency over the 5-year period.
To establish the effects of benomyl on AM fungi suppression and plant growth in our ecosystem prior to the field experiment, a preliminary pot experiment was conducted in a greenhouse with two treatments: control and benomyl. The control and benomyl treatments were the same as the treatments in the field experiment. We collected the soil (0–20 cm) and seeds of one dominant species L. chinensis nearby our experiment plots. The soil was sieved using a 2-mm sieve to remove large stones and debris, and then 2,000 g of soil was placed into the pots. The seeds of L. chinensis were surface disinfected in 10% (v/v) hydrogen peroxide for 5 min, rinsed five times with deionized water, and germinated at 20°C. After germination, 20 L. chinensis seedlings were planted into each pot. The pots were irrigated every 2–3 days; the soil water content was 50–60% of the field capacity. The pots were treated every 2 weeks. In the benomyl treatment, the pots were immersed in the benomyl solution (the concentration was the same as the field experiment). In the control, the pots were immersed in the water without benomyl. The experiment was harvested after growing for 2 months. The plants and soil were measured according to the methods described below.
2.3 Plant composition and productivity
During the growing season (in mid-July every year), a 1 m × 1 m subplot was delineated within each field plot, and the coverage, density, and number of each plant species were estimated using a modified point-frame method (Cook & Stubbendieck, 1986). The number of individuals per species occurring in each subplot also was used to calculate the species richness (species number per quadrat) and diversity (Shannon–Wiener index H, which accounts for both the abundance and evenness of the species present). In our experiment sites, grasses (e.g., L. chinensis and Phragmites communis) were the dominant species that occupied approximately 50–60% of the total aboveground biomass, and Asteraceae species (AS) were subordinate species (e.g., K. integrifolia and Artemisia sieversiana) that occupied approximately 30% of total aboveground biomass, whereas others were non-Asteraceae forbs (NF; Figure S2). For analysis, the plants were divided into three functional groups, specifically graminoid species (GS), AS, and NF, on the basis of aboveground biomass percentages. The percent coverage of each functional group (coverage of each functional group/total coverage of all functional groups × 100) was also calculated. In mid-September each year, a 50 × 50-cm subplot within each field plot was sampled for aboveground biomass. The shoots were cut at the soil surface and dried in an oven at 65°C for 48 hr. The community temporal stability, which is defined as the inverse of the temporal variability that measures the variation of aboveground biomass, has been frequently linked to species diversity (Xu et al., 2015). The community stability was calculated according to the formula described by Hautier et al. (2014).
2.4 Litter decomposition
To assess the effects of AM fungi on litter decomposition, a 5 × 5-cm litter bag made of nylon mesh (mesh size = 30 μm; AM fungal mycelium can penetrate, but roots cannot) was inserted into each plot in April 2016 and 2017. The litter bag was filled with 15 g of sterilized L. chinensis shoots (L. chinensis is the dominant grass species in the studied ecosystem). The remaining litter mass in each litter bag was determined after the last treatment in 2016 and 2017, and the percent of litter decomposition was calculated according to the following formula: litter decomposition (%) = (original litter mass − remaining litter mass) /original litter mass × 100%.
2.5 Soil N and C contents and mycorrhizal colonization
Soil samples were collected in September in 2014, 2015, 2016, and 2017. Five soil cores (5.0 cm diameter, 25 cm deep) were collected from each plot and sieved (2-mm mesh size) to remove stones, roots, and other litter. The soil samples were air-dried to measure the soil total C and N concentrations using a TOC Analyzer (multi-N/C ®3100, Analytik Jena AG, Germany). Soil ammonium (NH4+-N) and nitrates (NO3−-N) were determined using the methods described by Zhang, Guo, Song, Guo, and Gao (2013). The mixed roots were collected, and mycorrhizal colonization was measured according to the methods described by Zhang et al. (2016).
2.6 Gas sampling
N2O and CH4 were assessed using a stainless steel chamber according to the methods described in Li et al. (2012). Gas samples were collected on the third day after N addition from all plots in July 2016 and July and August 2017. Approximately 200 ml of gas sample was extracted each time from each chamber and placed into polyethylene-coated aluminium bags. The concentrations of N2O and CH4 were analyzed using a CH4/N2O Analyzer (913-1054, Los Gatos Research, USA).
2.7 Statistical analyses
Before analysis, all of the data were tested for normality and homogeneity of variance, which were performed with SPSS 16.0 software (SPSS 16.0 for Windows, Chicago, IL, USA). A three-way analysis of variance was performed to test the main and interactive effects of year, N addition and AM fungi on plant species composition, aboveground productivity, community biomass stability, litter decomposition, the emissions of N2O and CH4, and the soil total N and C contents. The treatment means were compared using Tukey's test (P ≤ .05). To examine the effects of N addition and AM fungi suppression on plant community structure, all plant community matrices were ordinated (two-dimensional solution) using nonmetric multidimensional scaling with the Bray–Curtis dissimilarity measurement using the software of PC-ORD 5 after 5 years of treatment (in 2017). Nonparametric multivariate analysis was performed to test the dissimilarity of the plant community structure. To determine the direct and indirect effects of N addition and AM fungi on grassland ecosystem functioning, we constructed a structural equation model (SEM) using AMOS 5.0 software (SPSS Inc.) according to the methods described by Liu et al. (2012). In this model, we used plant species richness, and H and aboveground biomass represent the status of plant community composition and productivity, respectively; litter decomposition and emissions of N2O and CH4 represent the carbon decomposition and greenhouse gas emission, respectively. To test how well the model fitted the data, the chi-square test (χ2) and the root mean square error of approximation were used.
3 RESULTS
3.1 The development of plant and AM fungi and soil N concentration in pot experiment
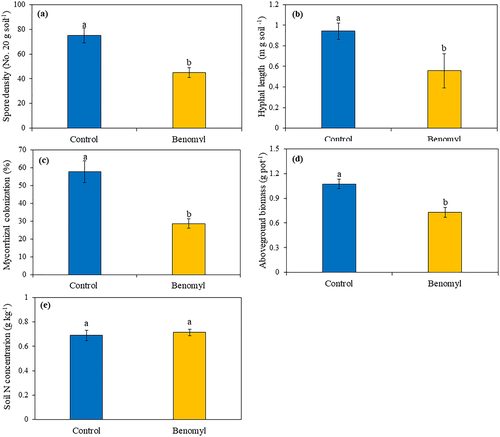
The pot experiment results showed that benomyl application significantly suppressed the activities of AM fungi and mycorrhizal colonization in the root system; the AM fungal spore density, hyphal length, and mycorrhizal colonization in benomyl treatment were 40% (P < .05; Figure 1a), 45% (P < .05; Figure 1b), and 52% (P < .05; Figure 1c) lower than in the control. The aboveground biomass decreased by 35% (P < .05; Figure 1d), but benomyl application did not alter the soil available N concentration (Figure 1e).
3.2 Plant community composition and productivity
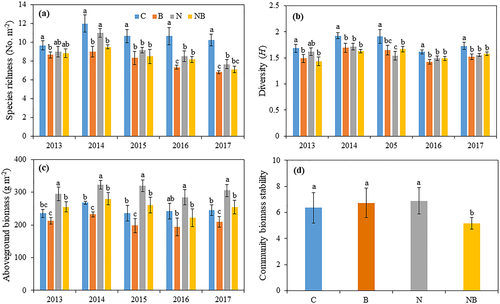
The application of benomyl significantly reduced the mycorrhizal colonization under both the control and N addition treatments (Figure S3). The plant species richness and Shannon–Wiener diversity index (H) were altered in the fungicide-treated plots with and without N addition across the 5 years (Figure 2a,b). Without N addition, the plant species richness and H in the AM fungi suppression plots decreased by 23% (P < .05; Figure 2a) and 12% (P < .05; Figure 2b), respectively, compared with those in the control plots across the 5 years. Under N addition, the suppression of AM fungi did not affect the plant species richness (P > .05) or H (P > .05), except in 2014, where the plant species richness was lower in the N addition plus AM fungi suppression plots (P < .05) than in the N addition plots. Significant main effects of N addition and AM fungi suppression, along with interactive effects of N addition × AM fungi suppression on plant species richness and H, were also observed (Table 1).
| Source of variation | Richness | Diversity | Coverage of GS | Coverage of AS | Coverage of NF | Aboveground biomass | Soil total N concentration |
|---|---|---|---|---|---|---|---|
| Y | 6.52** | 6.34** | 63.79*** | 66.94*** | 140.38*** | 27.21*** | 1.08a |
| N | 28.34*** | 22.56*** | 3.16a | 2.20a | 13.86*** | 24.63*** | 71.97*** |
| AM fungi | 6.90* | 6.58* | 26.31*** | 4.34* | 45.48*** | 10.56** | 7.82* |
| Y × N | 1.50a | 0.72a | 1.23a | 5.99** | 5.99** | 0.83a | 0.04a |
| Y × AM fungi | 0.17a | 2.33a | 18.08*** | 1.19a | 5.46** | 3.93* | 1.76a |
| N × AM fungi | 9.13** | 4.60* | 4.70* | 0.84a | 0.98a | 0.03a | 0.66a |
| Y × N × AM fungi | 0.61a | 0.19a | 2.06a | 0.09a | 26.86*** | 0.18a | 0.58a |
- Abbreviation: AM, arbuscular mycorrhizal.
- * P < .05.
- ** P < .01.
- *** P < .001.
- a P > .05.
Without N addition, AM fungi suppression significantly reduced the aboveground biomass by 14% (P < .05), 16% (P < .05), and 15% (P < .05) compared with the control in 2014, 2015, and 2017 (Figure 2c), respectively, but no impact in 2013 and 2017. Under N addition, the aboveground biomass in the N addition plus AM fungi suppression plots was 13%, 13%, 18%, 22%, and 17% lower (all P < .05) than in the N addition treatment in 2013, 2014, 2015, 2016, and 2017, respectively. Significant interactive effect of year × AM fungi suppression on aboveground biomass (P < .05) was observed (Table 1). Without N addition, AM fungi suppression did not affect the aboveground biomass stability, and no significant differences between the AM fungi suppression treatment and the control were observed (P > .05). Under N addition, the aboveground biomass stability in the N addition plus fungicide application treatment was 25% lower (P < .05) than in the N addition treatment (Figure 2d). Significant main effects of N addition and AM fungi suppression on the aboveground biomass (Table 1) and interactive effects of N addition × AM fungi suppression on the biomass stability (P < .05) were observed (Table 2).
| Source of variation | Biomass stability | Litter decomposition | N2O | CH4 |
|---|---|---|---|---|
| Year (Y) | — | 6.03** | 15.07*** | 20.38*** |
| N | 0.53a | 4.56* | 39.47*** | 0.32a |
| AM fungi | 0.17a | 11.2** | 16.34*** | 6.51* |
| Y × N | — | 0.44a | 2.58a | 1.26a |
| Y × AM fungi | — | 3.3a | 2.24a | 0.75a |
| N × AM fungi | 3.57* | 4.52* | 5.24* | 3.44* |
| Y × N × AM fungi | — | 0.89a | 0.59a | 0.91a |
- Abbreviation: AM, arbuscular mycorrhizal.
- * P < .05.
- ** P < .01.
- *** P < .001.
- a P > .05.
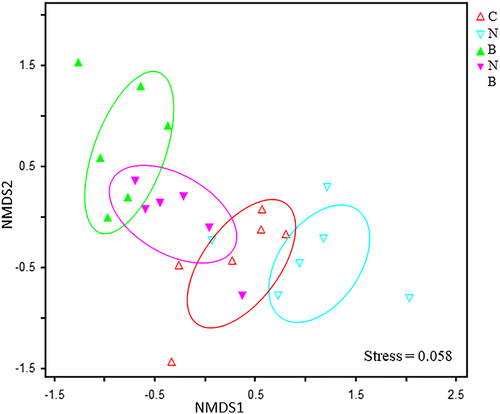
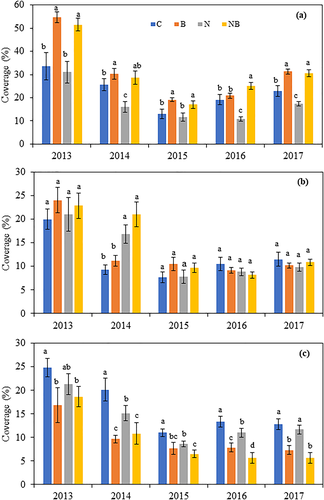
The nonmetric multidimensional scaling results found that the plant community composition was significantly altered by N addition and AM fungi suppression (Stress = 0.058, Figure 3). Nonparametric multivariate analysis showed that N addition (P < .05), benomyl application (P < .05), and their interactions (P < .05) had significant influence on plant community structure. With respect to functional group responses, the AM fungi exerted contrasting effects on the coverage of different functional groups under N addition (Figure 4). Without N addition, AM fungi suppression increased GS coverage by 62%, 18%, and 47% (all P < .05) in 2013, 2014, and 2015, respectively, no impact in 2016 and 2017 (all P > .05); AM fungi suppression decreased NF coverage by 32%, 52%, 30%, 41%, and 43% (all P < .05) in 2013, 2014, 2015, 2016, and 2017, respectively. With N addition, the coverage of GS in the N addition plus AM fungi suppression treatment was 66%, 79%, 57%, 132%, and 76% higher (all P < .01) than that in the N addition treatment in 2013, 2014, 2015, 2016, and 2017, respectively, whereas NF coverage was 29%, 25%, 49%, and 51% lower (P < .05) in 2014, 2015, 2016, and 2017, respectively. AM fungi suppression did not affect the coverage of the AS (P > .05) under N addition. Significant main effects of AM fungi suppression on the coverages of GS, AS, and NF and interactive effects of N addition × AM fungi suppression on the coverage of GS, year × N addition on the coverages of AS (P < .01) and NF (P < .01), and year × AM fungi suppression on the coverage of GS (P < .001) and NF (P < .01) were detected (Table 1).
3.3 Litter decomposition
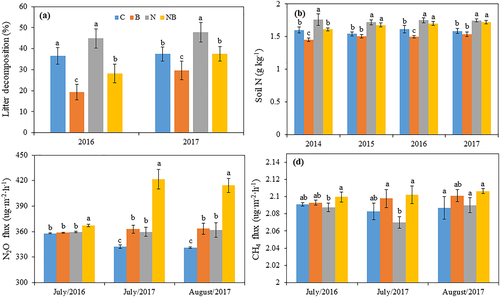
AM fungi suppression significantly decreased litter decomposition, and this effect was independent of N addition (Figure 5a). Without N addition, the litter decomposition in the AM fungi suppression treatment was 59% lower (P < .05) than that in the control. Under N addition, litter decomposition in the N addition plus AM fungi suppression treatment was 47% lower (P < .01) than that in the N addition treatment without AM fungi suppression. Significant main effects of N addition (P < .05), AM fungi suppression (P < .01), and an interactive effect of N addition × AM fungi suppression (P < .05) on litter decomposition were observed (Table 2).
3.4 Soil N and C contents
The soil total N (Figure 5b) was influenced by AM fungi. Without N addition, the soil total N concentration in the AM fungi suppression treatment was 7% (P < .05) meanly lower than that in the control across the 4 years. In the N addition treatment, the soil total N concentration was 4% higher than that in the N addition plus AM fungi suppression treatment across the 4 years, no significant difference in soil total N concentration between N addition treatment and N addition plus AM fungi suppression treatment (P > .05). N addition and AM fungi did not affect the soil total carbon (Figure S4). Significant main effects of N addition (P < .001) and AM fungi (P < .001) on the soil total N concentration were detected (Table 1).
3.5 N2O and CH4 fluxes
AM fungi suppression significantly increased N2O emissions (Figure 5c) with and without N addition. The N2O emissions in the AM fungi suppression plots were much higher (P < .05) than those in the control. With N addition, AM fungi suppression also significantly increased the N2O emissions; the flux of N2O in the N addition plus AM fungi suppression treatment was 16% higher (P < .05) than that in the N addition treatment. Significant main effects of N addition (P < .001), AM fungi suppression (P < .001), and an interactive effect of N addition × AM fungi suppression (P < .05) on the N2O emissions were observed (Table 2). In the absence of N addition, AM fungi suppression did not influence the CH4 emissions compared with the control (P > .05, Figure 5d). With N addition, the CH4 emissions in the N addition plus AM fungi suppression treatment increased by 5.8% (P < .05) compared with the N addition treatment. A significant main effect of AM fungi and an interactive effect of AM fungi suppression × N addition on the CH4 flux were detected (all P < .05, Table 2).
3.6 Relationships among N addition, AM fungi, and ecosystem functioning
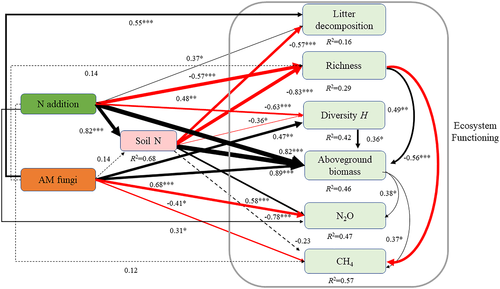
Our SEM results displayed the direct and indirect effects of N addition and AM fungi on ecosystem functionality (Figure 6). N addition exerted positive direct effects on litter decomposition (P < .05), the aboveground biomass (P < .001) and N2O emissions (P < .05), and negative effects on the plant species richness (P < .001) and diversity (P < .001); N addition indirectly altered these parameters by affecting the soil total N concentration. AM fungi exerted positive direct effects on litter decomposition (P < .01), plant diversity (P < .01), and aboveground biomass (P < .001) and negative effects on the emissions of N2O (P < .001) and CH4 (P < .05).
4 DISCUSSION
Several studies observed that the fungicide benomyl could affect other soil organisms (Newsham, Fitter, & Watkinson, 1995; Frank, Gehring, Machut, & Phillips, 2003); hence, the observed AM fungi effects might be attributed to other soil biota. However, the fungicide benomyl has been widely used for the suppression of AM fungi activities in the field (Hartnett & Wilson, 1999; O'Connor, Smith, & Smith, 2002), and a recent study found that the application of benomyl had no significant impact on other bacteria and fungi (Yang et al., 2014). The present results found that the application of benomyl significantly reduced mycorrhizal colonization (Figure S3), which suggests that it can suppress the activities of AM fungi in the studied meadow ecosystem.
The role of soil microbes and the interactive effects of soil microbes and N deposition on grassland stability are poorly understood. The path coefficients of our SEM indicate that, under N addition (although AM fungi did not affect plant species richness and soil total N concentration), AM fungi might reduce the negative effect of N addition on grassland ecosystem functioning by increasing plant productivity and biomass stability (Figure 2), enhancing litter decomposition, and reducing N accumulation and greenhouse gas emissions (Figure 5). Our results corroborate those of other studies showing that AM fungi enhance grassland sustainability (Bender & van der Heijden, 2015; Wagg, Bender, Widmer, & van der Heijden, 2014).
A large number of studies have demonstrated that AM fungi can alter plant species richness and diversity, but the effect size has depended on the response of the plant species to mycorrhiza (Hartnett & Wilson, 1999; O'Connor, Smith, & Smith, 2002; van der Heijden & Horton, 2009; Yang et al., 2014). In the current study, AM fungi increased the plant species diversity and richness without N addition but had no impact on plant species richness and diversity under N addition, which contrasts the microcosm experiment of van der Heijden, Verkade, & de Bruin, (2008). First, the effect of the disappearance of the AM fungi on the plant species diversity and richness might be explained by the decline of the AM fungi species richness (Liu et al., 2012) because the increase of AM fungi species diversity could increase plant species diversity (van der Heijden et al., 1998). Second, the discrepancy between these results might be related to the low soil N availability (Zhang et al., 2013), suggesting that the growth of AM fungi might be affected in the low N system, which could also indirectly influence the effect of AM fungi on plant species richness and diversity. Moreover, this discrepancy might be related to the difference in the sensitivities of different plant species to N addition. In our ecosystem, forb species significantly declined with N addition (Zhang et al., 2015), whereas they significantly increased in a European grassland ecosystem (van der Heijden, Verkade, & de Bruin, 2008). However, AM fungi increased the community biomass temporal stability under N addition (Figure 2d), suggesting that AM fungi might weaken the negative effects of plant species diversity on biomass stability under N deposition (Hautier et al., 2014). Moreover, AM fungi exerted contrasting effects on the coverage of different functional groups under N addition (Table 1). The decline in the coverage of the GS and the increase of the NF might be related to the mycorrhizal dependence and the N utilization of these two different functional groups. Our results suggest that AM fungi can influence the plant community structure by altering the coverage of different functional groups rather than affecting the plant species diversity and richness under N addition. The present results found that year and N addition interactively affected the coverages of AS and NF and year and AM fungi interactively affected the coverages of GS and NF, suggesting that the effects of AM fungi suppression and N addition on plant species coverage might be influenced by the fluctuations in precipitation because more precipitation could increase N leaching and affect the effects of AM fungi suppression on plant growth in the Songnen meadow ecosystem. Moreover, the present results also indicate that the effect of AM fungi on plant community composition under N addition might be influenced by environmental factors, and long-term N addition and AM fungi suppression experiments are needed in the further studies.
Many studies have demonstrated that AM fungi can increase plant productivity (van der Heijden et al., 1998, 2006; Vogelsang, Reynolds, & Bever, 2006; Yang et al., 2014). Several greenhouse studies have found that AM fungi can increase plant productivity in response to global change factors such as warming (Zhang et al., 2016) and N addition (van der Heijden, Verkade, & de Bruin, 2008). However, the influence of AM fungi on plant productivity and stability under global change remains unclear in natural ecosystems. The present results demonstrated that AM fungi increased the aboveground biomass and stability under N addition in the field, suggesting that AM fungi might reduce the negative effects of N deposition on the grassland biomass stability in the studied meadow ecosystem.
Our results also revealed that litter decomposition was increased by AM fungi, especially under N addition (Figure 5a). This result is consistent with previous results from four independent microcosm and field experiments, which suggested that AM fungi can accelerate litter decomposition under elevated CO2 (Cheng et al., 2012). However, the AM fungi did not increase the soil C content under N addition (Figure S4a), which might be related to changes in the soil C/N ratio. To maintain the soil C/N ratio, the C released from the litter was likely consumed by other soil microbes. AM fungi can increase the transfer of N from the soil to plants (Bender et al., 2014; Govindarajulu et al., 2005), which might indirectly stimulate litter decomposition. In the present study, AM fungi significantly reduced the soil total N concentration under N addition (Figure 5), which suggested that AM fungi can increase plant N uptake and consequently reduce the negative effects of N accumulation on soil quality. Moreover, the increase in litter decomposition might also be related to the changes of soil bacteria caused by the application of benomyl because AM fungi could indirectly affect litter decomposition by altering the bacteria composition (Hodge, Campbell, & Fitter, 2001; Hodge & Fitter, 2010).
N2O and CH4 are important greenhouse gases, and their release can aggravate global warming. A few studies have addressed the effects of AM fungi on the emission of N2O and CH4, but the results have been inconsistent. Under greenhouse conditions, it has been shown that AM fungi can reduce N2O emissions (Bender et al., 2014; Bender, Conen & van der Heijden, 2015; Lazcano, Barrios-Masias, & Jackson, 2014; Storer, Coggan, Ineson, & Hodge, 2018), but in the field, AM fungi had little effect on N2O emissions (Cavagnaro, Barrios-Masias, & Jackson, 2012). Our result was the first to demonstrate that AM fungi can reduce N2O emissions under N addition in the field. The reduction of N2O emission might be caused by AM fungi increasing the plant N absorption and subsequently affecting bacterial communities, thus increasing the rate of N mineralization under N addition (Figure S4). The increase in N mineralization might increase the N:P ratio, cause P limitation, and then conversely affect the mycorrhizal association between AM fungi and the host plant (Johnson, 2010). In addition, the results also suggest that AM fungi might reduce N2O emission by decreasing N nitrification (Storer, Coggan, Ineson, & Hodge, 2018). Moreover, AM fungi reduced CH4 emissions under N addition, which might be related to the acceleration of litter decomposition caused by AM fungi. Overall, these results suggest that AM fungi can reduce the emissions of the greenhouse gases N2O and CH4 and therefore improve the contribution of grasslands to the alleviation of global warming. However, the present study estimated the greenhouse gases at different discreet time points. Whether the effects of AM fungi on reduction of greenhouse gases are consistent and effective for a long time are still unclear, long-term continuous observation is needed in the future. Moreover, the mechanism whereby AM fungi affect the emissions of the greenhouse gases N2O and CH4 under N addition also needs further study.
5 CONCLUSION
In conclusion, the present results demonstrate that AM fungi reduce the grassland degradation caused by N addition and benefit grassland ecosystem multifunctionality and sustainability. First, AM fungi can alter the coverage of different functional groups and increase the aboveground biomass and stability under N addition, rather than affecting the plant species richness and diversity; the effects of AM fungi on plant species coverages of different functional groups and aboveground biomass might be influenced by the fluctuations in environmental factors. Additionally, AM fungi can accelerate litter decomposition and reduce the N soil accumulation under N addition, implying that AM fungi might reduce the negative effect of N deposition on soil quality by increasing the N utilization efficiency. The results highlight that the decline of AM fungi species diversity caused by global change should be considered and alleviated in future grassland management to enhance ecosystem sustainability. Moreover, the mechanism by which AM fungi reduce greenhouse gas emissions by affecting other soil microbes (e.g., denitrifying bacteria and methanogens) needs further study.
ACKNOWLEDGMENTS
We would like to thank Hugh A. L. Henry, Franz Bender, Florian Walder and Mingming Wang, and the anonymous reviewers for helpful comments on revision of this manuscript. This work was supported by the National Natural Science Foundation of China (Grants 31770359, 41701601, and 31601521) and the Fundamental Research Funds for the Central Universities (Grant 2412018ZD011).
CONFLICT OF INTEREST
The authors declare no conflict of interest.


