Comparison of different land degradation indicators: Do the world regions really matter?
Abstract
In 2010, the Convention on Biological Diversity created the Aichi Biodiversity targets to aid the restoration of degraded ecosystems, which include the restoration of at least 15% of degraded ecosystems by 2020. A crucial step to achieve this goal is the development of nonbiased prioritization methodologies that help establish key areas for restoration. However, prioritization methodologies depend heavily on each country's economic capability, governance, internal politics, degradation level, and access to data. Because only 78 countries are considered high-income economies, only this select group of countries would potentially have the necessary resources to compile the information needed to carry out a prioritization process. In this work, our aim was to analyze and compare key land degradation indicators (e.g., land use/change, primary productivity, biodiversity loss, soil organic carbon, degradation level, and social acceptance) in five world regions, with different incomes and political and cultural background, Africa, Asia, Europe, Latin America, North America (USA–Canada), and Oceania. We also grouped these key land degradation indicators by type (ecological, social, cultural, economic, and policy). Our results indicate that the different world regions seem not to have a direct impact on the number of land degradation indicators used. However, we found differences in the type of indicators used per region, partially denoting the idiosyncrasy of each of these regions. Our study shows that governance is important in the use of indicators although we suspect that there are other variables that could be at play not included in this study.
1 INTRODUCTION
Land degradation (LD) is a combination of environmental and anthropogenic induced/direct processes that generate a negative impact on fertility, productivity, and biodiversity (Adamo and Crews-Meyer, 2006). Despite early warnings during the 1960s, right governance decisions during the 1970s, and the emergence of the ecological restoration 30 years ago, degradation of natural resources is still a relevant concern worldwide; land deterioration has increased in the last decades (Ellis and Ramankutty, 2008). For example, in the past 15 years, vegetation cover has declined by approximately 20% globally (UNCCD, 2017). The increasing rates of LD and declining land productivity (Bajocco et al., 2012; Stavi and Lal, 2015) have led the United Nations (UN), in the past two decades, to put in place a series of initiatives and programs to counter the negative effects of this trend (e.g., Reynolds et al., 2007; Tóth et al., 2018). The most important initiatives conceived to accomplish this task are the Convention on Biological Diversity, the United Nations Convention to Combat Desertification (UNCCD), and the 2030 Agenda for Sustainable Development.
In 2010, the Convention on Biological Diversity created a list of 20 objectives (the Aichi Biodiversity targets), among them, the commitment to restore at least 15% of worldwide degraded terrestrial ecosystems by 2020 (Marques et al., 2014; Skidmore et al., 2015). In addition, in 2015, the UNCCD introduced and defined the land degradation neutrality (LDN) concept. The LDN consists of a 'no net loss' target, which main objective is to avoid or diminish further degradation and to recover land with the final goal of enhancing productivity (Cowie et al., 2018). Complementary to these two conventions, in 2015, the new Agenda for Sustainable Development (2030 agenda) included 17 novel Sustainable Development Goals. Goal Number 15 seeks to combat desertification, stop and reverse LD, and halt biodiversity loss. Although these conventions and agendas were created independently, their objectives are closely related to accomplish a sustainable development and collaborating efforts with each other to achieve goals using an integrative approach. In addition to these efforts, similar initiatives are being carried out by other international institutions such as the International Union for Conservation of Nature, Food and Agriculture Organization of the United Nations, and World Resources Institute (Stringer, 2008; Chasek et al., 2011).
During the past decades, the combat of LD has improved from a passive approach (e.g., protection) to an active one represented by ecological restoration activities (Aronson and Alexander, 2013). In many regions of Latin America, Africa, and Asia, the later approach is likely the most relevant one to prevent environmental damage, particularly by the application of nonstructural measures such as prevention, better planning, or regulation of land use/land cover (LULC) and land tenure (a more fair distribution), reduce the intensification of agroindustry, and promote traditional land uses (Shono et al. 2007; Ntshotsho et al. 2011; Lamb 2011; Vargas 2017; Zuleta et al. 2017). To improve the rates of land recovery and productivity, a crucial step is the development of nonbiased prioritization methodologies to establish key areas for restoration (Fernández and Morales, 2016), for which the identification of relevant LD indicators is crucial, and to provide a nonbiased evaluation of the state, condition, or level of degradation (Jorgensen et al., 2013). However, the construction process of indicators is not exempt from uncertainties and biases, as there are several factors that can affect the objectivity of an indicator such as data collection methodology, data quality and data normalization, and spatial and temporal scales, among others (Nardo et al. 2005). In general, LD assessments require several indicators that are used together, and therefore, biases in one or more indicators can have an effect in the overall analysis.
Indicators are a crucial tool for evaluating LD current risk status; future trends and the success of management activities aimed to reverse and halt LD (Kairis et al., 2014). However, as degradation is a complex issue, we need several indicators to build a composite index that allow us to evaluate and compare results among different periods of time and in different parts of the world, among other criteria of good indicators (Nardo et al. 2005; OECD 2008). For example, using the LDN program as a backdrop, the UNCCD proposed three general and comparable indicators, which include LULC, land productivity, and soil organic carbon (SOC; Kust et al., 2017).
To identify degraded areas on a worldwide scale, the need for a large amount of data is self-evident. Although most of the programs and initiatives provide the required data to accomplish the identification of zones of interest (e.g., LDN and REDD+), in most cases, the data provided can only help develop maps at a national or subnational scale. The responsibility lies on each country then to develop local and regional level maps (Grainger, 2015), the operating scale where most decisions on LULC changes are taken. However, data availability to compile such indicators relies on each country's economic capability, governance, internal politics, degradation level, reliable information, and free access to data (Akhtar-Schuster et al., 2017). For example, only 36% of world countries are high-income economies in the world representing 1.25 billion people and approximately 40 million km2 (World Bank, 2017) and theoretically with access to the necessary resources to compile all the needed indicators and monitoring LD at multiples scales, which for most of the countries, it is not the case (Reynolds et al., 2003; Bedunah & Angerer, 2012). In addition, data availability can vary in time due to changes in factors such as governance. For example, the World Governance Indicator compiled by the World Bank shows that, in a period of 8 years, some countries can improve significantly their governance indicators (e.g., Serbia and Indonesia), whereas others can have a substantial deterioration in governance (e.g., Venezuela and Zimbabwe; World Bank, 2017).
To develop a comparable, practical, widely applicable monitoring methodology, it is imperative to diminish the number of indicators to a few representative metrics that can help perform a coarser prioritization before developing regional or local ones. For example, the three LDN indicators seem capable to provide a general view of the national LD context (Global Mechanism, 2016). Although transforming these indicators at a regional or local scale is technically feasible, due to the complexity of the degradation processes, they must be complemented with other indicators that can represent the singularities of LD at both subnational scales (e.g., ecological, cultural, economic, and social components; Geist and Lambin, 2004). However, the rescaling process and the generation of new indicators can potentially become costly and time consuming, and not all the countries are prepared to deal with these different sets and level of information required because of technical, logistical, and budgetary reasons. For example, among the indicators proposed by the LDN initiative, SOC is the most expensive and difficult to obtain at larger scales (Stevens et al., 2013).
Our aim in this study was to analyze and compare general LD indicators in five world regions (Africa, America, Asia, Europe, and Oceania) with different economic income, political and cultural backgrounds, and at different scales. In addition, we wanted to determine if the newly proposed LDN indicators have been used in the past and which world region is more prepared to use them at multiple scales. We hypothesized that regions with more stable economies and high indexes of governance would have more access to the data needed to compile indicators to a regional and local level. In addition, we evaluated if low income and governance performance could have an impact in the provision of reliable data.
2 METHODOLOGY
2.1 Literature analysis
We performed a systematic review using the ISI Web of Science and Google Scholar databases using the keywords 'land degradation indicators,' 'ecological indicators,' and 'social indicators' in title and abstract. In addition, we did a manual search using the same keywords in the webpages of international organizations such as UNCCD, International Union for Conservation of Nature, Food and Agriculture Organization, and World Resources Institute. A first filter was applied to the articles selected in the previous steps, and only accessible articles and technical reports dealing with terrestrial ecosystems and written in English are sorted out (Figure 1).
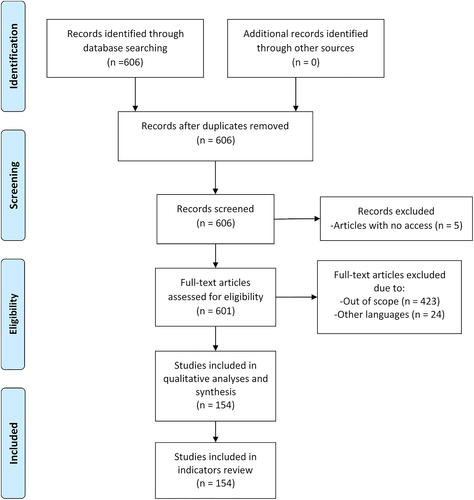
The remaining studies were then filtered a second time discarding all the articles without a practical use of indicators such as articles presenting only a framework, conceptual work, reviews, proposing new policies, or changes in current policies (Figure 1; see Table S1). The filtered documents were then classified according to the world region, spatial scale, and the type of indicator used (Table 1). We used three separate categories for the type of indicator including a general classification (six categories), a more in-depth classification (29 in-depth indicators), and the UNCCD criteria (Table 1). We examined the number of indicators (frequency) per spatial scale, general category, and continent for each type of indicator. A comparison between Latin American and Caribbean zones with the only two high-income countries in the continent (the USA and Canada) was also carried out.
| Type of classification | |
|---|---|
| Continent | Africa, America, Asia, Europe, and Oceania |
| Spatial scale | World, continental, national, regional, and local |
| UNCCD indicators | Land use and land cover (LULC), temporary change, land productivity, and soil organic carbon (SOC) |
| General | 1) Ecological, 2) socio, 3) cultural, 4) economic/productive, 5) policy/institutional, and 6) mixed |
|
In-depth indicators (n = 29) |
Cultural, enhance biodiversity, conservation habitat, diminish negative impacts of productive activities, soil conservation, land degradation, contamination soil/water/air/etc., habitat quality, forest indicators, animal indicators, vegetation indicators, ecosystem services, wetlands conservation, soil quality, productivity indicators, social indicators, fire impact, invasive species, carbon stock, fragmentation, policy, infrastructure, resilience, archaeological history, water availability, economic indicators, carbon footprint, traditional or community knowledge/use, and environmental management |
To evaluate the potential relationship between the governance and the number of indicators per country, we calculated a governance average index (GAI) by obtaining the mean of the six governance indicators provided by the Worldwide Governance Indicators project of the World Bank: voice and accountability, political stability and absence of violence, governance effectiveness, regulatory quality, rule of law, and control of corruption. We used each country per continent as a replicate.
The data from Oceania were discarded as it did not have enough number of replicates (only two countries). A map representation of the average governance index and the number of indicators per country was prepared using QGIS Madeira (QGIS Development Team, 2018).
2.2 Statistical analysis
We performed a Chi-square goodness-of-fit test based on 9999 Monte-Carlo resamplings to compare the percentage of the average number of indicators per continent and between the Latin American–Caribbean areas and USA–Canada (using the 'coin' [Hothorn et al. 2008] and 'RVAideMemoire' [Maxime 2019] package in R). The same test was used to look for significant differences on the several general indicators categories per region. We only performed graphical analysis and did not perform any statistical analysis on the in-depth indicators due to the small sample sizes of some of the categories. To determine the most important indicators at different spatial scales, we ranked the indicators belonging to the more in-depth classification (in-depth indicators) previously made according to their frequency.
A Kruskal–Wallis test was used to evaluate differences in the GAI and the number of indicators among the different world regions with a Bonferroni correction and a posteriori Conover–Iman test (package 'agricolae,' De Mendiburu 2012). To evaluate if there was a relationship between the number of indicators, GAI and continent, we performed different negative binomial multiple regressions. We used the number of indicators as the response variable and continent and the GAI as predictors. Also, an interaction predictor was included between continent and governance index in some models. We compare four different models: a null model, an additive model, an additive model specifying a cross classification, and an additive model specifying a nested classification. We compare the goodness of fit of the generated models using a likelihood-ratio test (see Table S2). The chosen model was an additive model plus specifying a cross classification (World region*GAI). The analysis was perform using the package “MASS” (Venables and Ripley, 2002). All analyses were carried out in R 3.5.2 (R Core Team, 2018).
3 RESULTS
3.1 LD indicators in the world
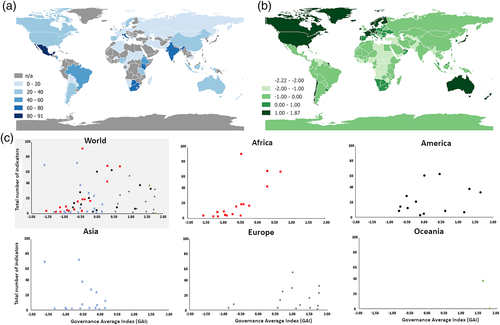
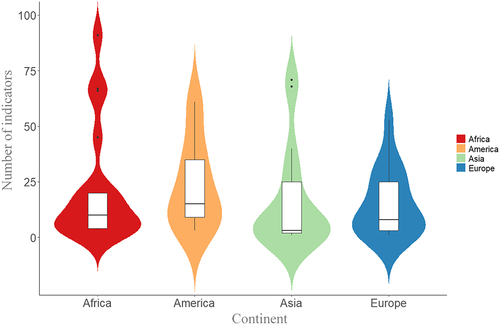
Our systematic search produced a total of 1,330 indicators used at a global, regional, or local level. The continent with the highest number of indicators used was Africa, followed by America, Europe, Asia, and Oceania with 419, 332, 314, 220, and 45 indicators, respectively (Table 2 and Figure 2a). Countries' participation in all continents was low ranging from 31.5% to 37.8%. In Oceania, country representation was particularly low, with only a 14.3% of countries participating. We did not find any significant differences on the average number of indicators per continent (Kruskal–Wallis χ2 = 4.85, df = 3, p = .18; Figures 2a and 3). In the case of the Americas, the results show that, in the Latin American and the Caribbean regions, there is a higher total number of indicators in comparison with the high-income countries (USA and Canada; 256 vs. 74 indicators, respectively). However, the difference in the average number of total indicators (23 vs. 37) was not significant (goodness of fit χ2 = 3.26, p = .09).
| Continent | WOS (Web of Science) | Google scholar | Institutional webpages | Total per regiona | Number of different in-depth indicators used | Number of countries represented in each continent | Total % of countries represented in the continent |
|---|---|---|---|---|---|---|---|
| Africa | 126 | 253 | 40 | 419 | 18 | 54 | 31.5 |
| America | 191 | 99 | 42 | 332 | 26 | 35 | 34.3 |
| Asia | 142 | 21 | 57 | 220 | 24 | 45 | 37.8 |
| Europe | 147 | 95 | 72 | 314 | 18 | 51 | 35.3 |
| Oceania | 41 | 0 | 4 | 45 | 9 | 14 | 14.3 |
| Total | 647 | 468 | 215 | 1,330 |
- a The total number of indicators mentioned for each category.
3.2 LDN indicators
The LDN indicators proposed by UNCCD have not been used intensely of the 1,330 indicators recorded, and only 139 indicators (9.6%) corresponded to LND indicators. The indicators with more mentions were LULC (44.6%) and productivity (37.4%), followed by SOC with only 18%. The continents with a higher use of LDN indicators were Africa, Asia, and America with 33.8%, 25.9%, and 19.4%, respectively. The SOC indicator is underrepresented in most regions except for Africa, which concentrates 64% of the total use of SOC (Figure 4a).
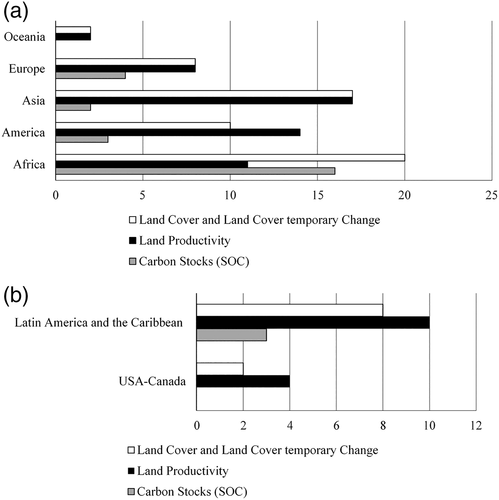
There is a poor use of LND indicators in the Latin American and the Caribbean regions (0.6 indicators used per country on average) in comparison with the USA–Canada. The most used indicator in the Americas was the land productivity. Interestingly, no use of SOC indicators was reported in the USA and Canada (Figure 4b).
3.3 General indicators
By far, ecological indicators were the most used ones (73.3%) followed by economic/productive and social with 13.4% and 8.3%, respectively (Table 3a). Most of the indicators are distributed in the African, American, and European continents. The ecological indicators are the type of indicators more broadly used in all the world regions. We did not find any significant differences on the percentage of ecological indicators per continent (goodness of fit χ2 = 4.3, p = .23). However, we detected significant differences among regions regarding social (goodness of fit χ2 = 40.79, p = .0001) and cultural indicators (goodness of fit χ2 = 22.72, p = .0001). America and Europe have a high incidence of social indicators in comparison with Africa (America, p = .0001; Europe, p = .003) and Asia (America, p = .00002; Europe, p = .0005). Also, America, Africa, and Europe showed a high prevalence of cultural indicators compared with Asia (America, p = .00001; Africa, p = .009; Europe, p = .027).
| Number of indicators | ||||||||
|---|---|---|---|---|---|---|---|---|
| (a) | Continent | Ecological | Social | Cultural | Economic/productive | Policy/institutional | Mixed | Totala |
| Africa | 334 | 14 | 10 | 52 | 4 | 3 | 417 | |
| America | 190 | 46 | 12 | 69 | 11 | 1 | 329 | |
| Asia | 186 | 11 | 3 | 17 | 2 | 1 | 220 | |
| Europe | 218 | 39 | 8 | 39 | 9 | 1 | 314 | |
| Oceania | 43 | 0 | 0 | 1 | 0 | 0 | 44 | |
| Total | 971 | 110 | 33 | 178 | 26 | 6 | 1,324 | |
| Number of indicators | ||||||||
|---|---|---|---|---|---|---|---|---|
| (b) | Region | Ecological | Social | Cultural | Economic/productive | Policy/institutional | Mixed | Totala |
| USA–Canada | 48 | 7 | 5 | 13 | 0 | 1 | 74 | |
| Latin America and the Caribbean | 142 | 39 | 7 | 56 | 11 | 0 | 255 | |
| Total | 190 | 46 | 12 | 69 | 11 | 1 | 329 | |
- a The total number of indicators mentioned for each category.
We found significant differences among different regions for economic/productive indicators (goodness of fit χ2 = 18.31, p = .00001). Economic/productive indicators were predominant in America, Africa, and partially, in Europe. The economic/productive indicators were significantly different between America and Africa regions when compared with Asia (America, p = .000004; Africa, p = .001). In addition, America's economic/productive indicators statistically differ from Europe (p = .003). Policy/institutional indicators were not predominant except for the Latin American and Caribbean zones (Table 3a), and we found significant differences among continents (goodness of fit χ2 = 41.51, p = .00001). A comparison among the Americas and the rest of the world showed significant differences in terms of policy/institutional indicators with Africa (p = .00007) and Asia (p = .00001). Significant differences were also found among Europe and Africa (p = .017) and Asia (p = .0001).
In terms of USA–Canada region in comparison with the Latin American and Caribbean countries, an analysis of the percentage of the average number of indicators per region showed significant difference in ecological (goodness of fit χ2 = 9.024, p = .0016) and cultural indicators only (goodness of fit χ2 = 35.3, p = .00001; Table 3b). One notable distinction is the lack of policy/institutional indicators in the USA–Canada in comparison with the Latin American and Caribbean countries.
3.4 In-depth indicators
The in-depth indicators with a higher number of mentions were soil quality (17.9%), LD (11.7%), productivity indicators (9.7%), and vegetation (9.1%; Table 4). However, when we analyzed each continent independently, the order of importance of the in-depth indicators changed, and some new indicators gain importance. In Africa, 'soil quality' largely prevailed. In contrast, 'land degradation' was the most applied indicator in America, Asia, and Europe. It is important to mention that in the Americas, LD shares the same importance as the 'social indicators,' been this continent the only one that has the 'social indicators' category among the fourth most used indicators. Africa, Asia, Europe, and Oceania share the utilization of the 'vegetation indicators' on different levels of relevance. Interestingly, Europe showed distinctive indicators such as 'fragmentation,' 'contamination,' and 'infrastructure' (e.g., road and building expansion). It is probably associated to the severe modification of its natural environment since historical times. Results showed that Oceania was quite different in terms of the use of indicators, only sharing one type ('vegetation indicators') on the top-four list. The other most used indicators in Oceania were 'water availability,' 'habitat quality,' and 'enhance biodiversity' (Table 4). Latin America used a wide range of in-depth indicators, reinforcing this pattern among world continents.
| Type of indicator | Africa | America | Asia | Europe | Oceania | Total |
|---|---|---|---|---|---|---|
| Soil quality | 169 | 19 | 17 | 33 | 0 | 238 |
| Land degradation | 31 | 39 | 35 | 46 | 4 | 155 |
| Productivity indicators | 59 | 26 | 21 | 22 | 0 | 128 |
| Vegetation indicators | 33 | 23 | 30 | 24 | 11 | 121 |
| Forest indicators | 13 | 27 | 21 | 13 | 3 | 77 |
| Social indicators | 15 | 39 | 10 | 9 | 0 | 73 |
| Enhance biodiversity | 19 | 20 | 8 | 15 | 5 | 67 |
| Fragmentation | 6 | 9 | 12 | 30 | 4 | 61 |
| Animal indicators | 13 | 7 | 15 | 14 | 2 | 51 |
| Habitat quality | 7 | 7 | 5 | 16 | 6 | 41 |
| Infrastructure | 2 | 4 | 6 | 23 | 0 | 35 |
| Water availability | 12 | 9 | 1 | 4 | 6 | 32 |
| Policy | 3 | 11 | 7 | 9 | 0 | 30 |
| Habitat conservation | 0 | 20 | 6 | 3 | 0 | 29 |
| Ecosystem services | 4 | 9 | 5 | 10 | 0 | 28 |
| Environmental management | 4 | 15 | 1 | 6 | 0 | 26 |
| Economic indicators | 5 | 14 | 2 | 3 | 0 | 24 |
| Contamination soil/water/air/etc. | 1 | 5 | 3 | 12 | 0 | 21 |
| Cultural | 2 | 7 | 1 | 9 | 0 | 19 |
| Traditional or community knowledge | 9 | 4 | 2 | 0 | 0 | 15 |
| Carbon stock | 3 | 1 | 1 | 9 | 0 | 14 |
| Invasive species | 6 | 0 | 3 | 0 | 2 | 11 |
| Fire impact | 0 | 4 | 4 | 2 | 0 | 10 |
| Soil conservation | 1 | 2 | 3 | 1 | 0 | 7 |
| Carbon footprint | 1 | 3 | 0 | 1 | 1 | 6 |
| Resilience | 1 | 3 | 0 | 0 | 0 | 4 |
| Diminish negative impacts of productive activities | 0 | 1 | 0 | 0 | 0 | 1 |
| Wetlands conservation | 0 | 0 | 1 | 0 | 0 | 1 |
| Archaeological history | 0 | 1 | 0 | 0 | 0 | 1 |
3.5 Spatial scale distribution
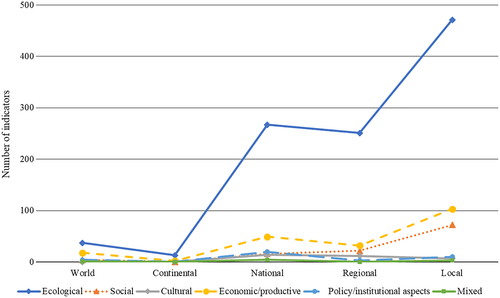
Ecological indicators showed a strong inverse relationship between the total number of indices and the extent of the spatial scale (Figure 5). Besides, the total number decreases almost 50% between the local scale (666) and the other ones, 370 and 320 indicators in the national and regional scales, respectively. The world and continental scales were the ones with the less number of indicators with only 64 and 15 indicators in total. At a local, regional, and national levels, the indicator categories, ecological, economic/productive, and social, were the more important ones (Figure 5). The ranking of the in-depth indicators showed that the most used indicators at global and continental scales were land productivity, LD, and soil quality (Table 5). As the spatial scale changed, other indicators started to gain importance such as vegetation and forest indicators. It is relevant to note that soil quality was the only indicator that maintained in the first three positions in all the different spatial scale categories (Table 4).
| Spatial scale | |||||
|---|---|---|---|---|---|
| Ranking | World | Continent | National | Regional | Local |
| 1 | Productivity | Soil quality | Vegetation | Land degradation | Soil quality |
| 2 | Land degradation | Productivity | Soil quality | Vegetation | Productivity |
| 3 | Soil quality | Land degradation | Land degradation | Soil quality | Forest |
| 4 | Vegetation | Water availability | Productivity | Productivity | Land degradation |
| 5 | Economic | Habitat quality | Enhance biodiversity | Fragmentation | Vegetation |
3.6 Governance
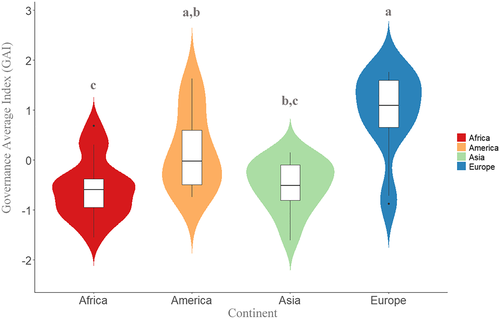
The GAI could range from −2.5 to 2.5 where higher values correspond to better governance (Figure 2b). Results showed that there are significant differences between GAI and the continent (Kruskal–Wallis χ2 = 23.80, df = 3, p = .000027; Figure 6). A post hoc tests to test pairwise comparisons showed that Europe differs significantly from Africa (p = .0001) and Asia (p = .0001) but not from America (p = .17) in terms of GAI. There were no significant differences between Asia and Africa (p = .99).
3.7 Relationship between indicators, world region, and GAI
In terms of the influence of the world region and GAI on the number of indicators, our results showed that the number of indicators was not influenced by region (negative-binomial GLM χ2 = 2.5, df = 3, p = .47) but by GAI (negative-binomial GLM χ2 = 3.86, df = 1, p = .049) and GAI/world region interaction (negative-binomial GLM χ2 = 14.16, df = 3, p = .002). Our results suggest that although governance has an influence in the number of indicators, this impact is country dependent. However, the magnitude of the effect of GAI on the number of indicators can differ depending on the world region. A graphical summary of the relationship between the GAI and the number of indicators for each world region is presented in Figure 2c.
4 DISCUSSION
Our results indicate that the world region seems not to have a direct impact on the implementation of indicators per se although they are an important aid to meet biodiversity targets (e.g., Bokpin, 2017). In addition, our results showed that world region seems not to have a direct impact on the number of LD indicators used (Figures 2a and 3). However, we found differences in the type of indicators used per region, partially denoting the idiosyncrasy of each of these regions (Figure 6). It would appear that the country's internal policy framework and governance are more important (e.g., GAI) than the world region (Newig et al. 2007; Figures 2b and 6).
Contrary to our prediction, our results show that regions with a higher number of high-income countries (e.g., USA, Canada, and Australia) did not have a widespread use of SOC as an indicator, and it was in Africa where SOC was used more often. One explanation for this is that in Africa, human survival depends heavily on land fertility and productivity hence the importance of indicators as SOC or soil quality (AUC-ECA-AfDB Consortium, 2010). Also, many African countries have initiatives in place towards improving food security, especially in rural areas (e.g., Pretty, 1999; Tittonell et al., 2012). In addition, most of the revised literature showed that the authors or the funding were from outside Africa (51%), particularly from Europe, which could explain the high use of SOC in comparison with other world regions. Therefore, African results are European-biased towards a high-tech approach.
Therefore, some countries will be better prepared to achieve the LDN goals and the biodiversity targets than others. However, there is a battery of different indicators not necessarily associated among different continents. That is the main strength of the proposed UNCDD indicators is that they are standardized indicators general enough that can be useful in the prioritization of sites to restore and to accomplish other targets such as the Aichi targets, regardless of a country's GDP or world region (Figure 4), although the incorporation of indicators that represent each countries idiosyncrasy appears to be critical (e.g., Murcia et al., 2016; Table 3). As such, UNCDD indicators could allow the “zero deforestation targets” if there are complemented with local or regional indicators (Tables 3, 4, and 5).
Ecological indicators were the most used type of indicators. In contrast, we found differences in the use of social and cultural indicators (Table 3a). These types of indicators are considered the second most important types and are commonly used to denote the idiosyncrasy of each region. We expected that Africa would be a continent with a high use of social indicators because of the high levels of poverty (41% headcount ratio; The World Bank, 2016) and basic welfare needs. However, this was not the case. The region with higher use of social and cultural indicators was the Americas, which have lower levels of poverty (5.4% headcount ratio), even though these types of indicators are expensive to calculate and require reliable data. This unexpected scenario is in part explained because of the lack of reliable data in Africa (Anyanwu and Erhijakpor, 2010; Center for Global Development, 2014) unlike the Americas that have the support of the United Nations Economic Commission for Latin America and the Caribbean from 1948. Sociocultural indicators of LD should be relevant regardless the country or the world region idiosyncrasies.
The in-depth indicators classification showed that indicators related to soil quality were predominant in Africa in comparison with other continents. This tendency could be explained because in Africa policies to prevent and mitigate soil erosion are in place since 1923, meaning that the use of soil quality indicators is widespread (Mills and Fey, 2004). Another interesting difference in terms of in-depth indicators among the different continents was Oceania. For example, 'water availability' was one of the most used indicators in this region, which could be explained by the fact that this continent has the lowest total volume of water in comparison with the other analyzed world regions (Sophocleous, 2004). In Asia, the most important indicators were LD (mostly associated to soil conditions) and 'vegetation,' which is consistent with the fact that this continent has one of the highest deforestation rates, overexploitation of the vegetative cover, and water and wind soil erosion in comparison with the rest of the world regions (Gabriels and Cornelis, 2009).
In terms of the spatial distribution, we expected to find differences on the type of indicators used at varying scales. This trend is explained because some indicators are quite expensive to produce at large scales (e.g., SOC, fragmentation, animal indicators, tree density, and tree height; e.g., Dyer et al., 2017) or the results are impossible to extrapolate to larger scales (e.g., ecosystem structure; e.g., Styers et al., 2010). In addition, there are some indicators that are used to fulfill international commitments, especially at the national level (e.g., enhance biodiversity and fragmentation; e.g., Kupfer, 2006). In other cases, data are collected only on large scales because complexities inherent to the measured resource. For example, water availability is usually recorded at large scales and, due to dynamic and complex characteristics of the resource, is difficult to describe with simple indicators (e.g., Rijsberman, 2006).
Our results suggest that the GAI has a significant relationship with the number of indicators; although the magnitude of this effect is region dependent (e.g., Africa and Europe), an increase in the number of indicators when there is an augment in the GAI was observed (Figure 2c). There is a debate whether in some continents foreign aid, depending on the level, can deteriorate the quality of governance (e.g., Bräutigam and Knack, 2004), for example, by not securing the rule of law (Erbeznik, 2011). Nevertheless, there is still no consensus in this matter, and it is reported that, in certain cases, foreign governance aid can have a positive impact (e.g., Jones and Tarp, 2016). Our study showed that governance is important in the use of indicators. However, we suspect that there are other variables not included in this study, such as country idiosyncrasy, LD awareness, technological abuse/misuse, and economic issues that are relevant drivers influencing a particular region.
| Type of indicator | Compliance criteria | Description | ||||||
|---|---|---|---|---|---|---|---|---|
| P | D | T | S | R | M | C | ||
| (*) Land cover | √ | √ | √ | √ | √ | √ | √ | Percentage of land with terrestrial vegetation (including crops). Comprises LULC dynamics, fragmentation. |
| (*) Land productivity | √ | partial | √ | √ | √ | √ | √ | Measured as plant biomass/hectare/period of time. Do not reflect LD in all conditions. Related to vegetation indicators: forest, richness, habitat, tree density, biodiversity. |
| (*) Land/soil erosion | √ | partial | √ | √ | √ | √ | partial | Loss of land volumes or ground materials from human uses in comparison to a reference condition. Includes reduction of soil quality and/or productivity. Related to other soil indicators; most of them apply for specific cases, local conditions. |
| (*) Soil organic matter (SOM) | √ | √ | partial | partial | √ | √ | √ | Estimated as kg/ha. SOM, as well as most soil indicators, rarely reflects socio-temporal variations at large scale: big data and resources are required. |
| (*) Soil organic carbon (SOC) | √ | √ | partial | partial | √ | partial | no | Estimated as mg/ha. If measured, SOM should also be informed. Related to carbon footprint. |
| (*) Biodiversity conservation | √ | √ | √ | √ | partial | √ | partial | Land values according to species vulnerability to extinction and ecosystem integrity, in comparison to a reference condition (historical, pre-disturbance). Related to several in-depth indicators: wildlife, enhanced biodiversity, resilience. |
| Invasive species | √ | √ | √ | √ | partial | partial | no | Percentage of land dominated by exotic, invasive species. Apply for specific cases, local conditions. G |
| (*) Wetlands conservation | partial | partial | partial | √ | √ | √ | partial | Percentage of wet zones protected from human disturbances or unsustainable activities. Related to water availability. |
| (*) Social indicators | √ | partial | partial | partial | no | √ | partial | Human welfare per area unit associated to land degradation or restoration. Welfare must consider, as a reference, cultural identities and needs of each region or country. |
| (*) Policy | √ | partial | partial | partial | partial | √ | √ | Enforcement and specific regulations per area unit that promote effective sustainable uses of land. Related to environmental management. |
| (*) Economic indicators | √ | √ | partial | partial | partial | partial | partial | Profits generated per area unit associated to unsustainable or effective sustainable land uses. Profits include investments on measures to avoid degradation and protect/restore the land. |
| Cultural | √ | √ | partial | partial | partial | partial | partial | Includes traditional or community knowledge. |
- Note. Selection was based on the compliance of seven criteria. Three categories of compliance were assigned: complete/direct (√), partial/indirect, and low–very low (no). Redundant, biased, or impractical 'in-depth' indicators (Table 4) were not considered (e.g., ecosystem services, resilience, contamination, infrastructure, fire impact, and archaeological history). Definitions are adapted from Nardo et al. (2005), Donnelly et al. (2007), and Zuleta and Reichmann (2013).
- Abbreviations: P, pertinence (the indicator must be applicable to real situations in order to facilitate decision making: legal and social implications (regulations, standardizations, and permanent monitoring); D, sensitive to degradation (must reflect the intensity or severity of human disturbance on land); T, reveal temporal changes; S, applicable at varying spatial scales, from local to regional to global (sample size should not affect the indicator); R, repeated measures can be done by different persons (should not be observer dependent); M, easy to measure (is necessary that the unit of measure will be easy to understand and implement and that provides relevant and documentable information); C, cost-effective (must be consistent with the economic resources available).
5 CONCLUSIONS AND RECOMMENDATIONS
Africa is the continent with a high use of degradation indicators in comparison with the rest of the world. Among all the studied continents, the Americas seem to have a more diverse assemblage of indicators such as social, cultural, and economic/productive. In Europe, the use of ecological and cultural indicators is important. The lower number of indicators shows that the indicators used in Europe are more standardized than in other regions. In Asia, the application of mixed/multiple/varied indicators (cultural, social, and productive) is quite low; most of them are ecological. Oceania followed the same pattern of using mostly ecological indicators despite the huge social and cultural diversities in the region.
We consider that the LDN indicators are a good start to determine degradation. Despite that SOC could be difficult and expensive to obtain, Africa is the region with the widespread use of the SOC. This could be explained by the long-term historical international influence by aid organization and institutions to this continent by part of high-income countries that could have led to a transfer of technology and knowledge, although we propose that SOC indicator could be interchanged with soil organic matter (SOM) because of budgetary or logistic reasons. Besides, SOM is an indicator of SOC. In addition, LDN indicators should be complemented with local–regional indicators (e.g., enhance biodiversity, policy, social, habitat conservation, and wetland conservation) to account for the particularities of each country. In addition, we need to consider or develop indicators related to nonstructural measures to revert LD as discussed in Section 1: LULC planning and regulation, land tenure, reduce agribusiness intensification, better governance, and modify consumption habits.
Finally, and considering our results, discussions, and critical review of the literature, we proposed a set of relevant indicators to be used worldwide (Table 6). The selection was based on the compliance of seven criteria mostly associated to decision making of different stakeholders: policy-makers, scientists, NGOs, land users, and the finance sector, among others. Land cover, land productivity, and SOC or SOM are the basic indicators, as already discussed. Land/soil erosion caused by human activities is a key indicator but absent in many studies. We included two conservation indicators: biodiversity and wetlands. Regardless the difficulty to relate to the spatial-temporal scales and their dynamics, we also recommend to include social, political, and economic indicators as part of the set. There is a strong challenge to make cultural and natural indicators compatible. Otherwise, comparisons are negligible and decisions biased. We expect these recommendations to help to revert degradation and improve land productivity and ecosystem integrity.
ACKNOWLEDGMENTS
We would like to thank I. Fernandez and G. Muschett for their comments and help in polishing the manuscript. We also thank D. Fernández for reviewing the database indicators.


