Modelling Soil Detachment of Different Management Practices in the Red Soil Region of China
Abstract
Soil erosion from cropland is a primary cause of soil degradation in the hilly red soil region of China. Soil characteristics and the resistance of soil to erosion agents can be improved with appropriate management practices. In this study, hydraulic flume experiments were conducted to investigate the effects of five management practices [manure fertilizer (PM), straw mulch cover (PC), peanut–orange intercropping (PO), peanut–radish rotation (PR) and traditional farrow peanut (PF)] on soil detachment. Based on the results, three conservation management practices (PC, PM and PO) increased the resistance of soil to concentrated flow erosion. The rill erodibility of different treatments was ranked as follows: PC (0·001 s m−1) < PM (0·004 s m−1) < PO (0·007 s m−1) < PF (0·01 s m−1) < PR (0·027 s m−1). The rill erodibility was affected by soil organic content, aggregate stability and bulk density. The soil detachment rate was closely correlated with the flow discharge and slope gradient, and power functions for these two factors were developed to evaluate soil detachment rates. Additionally, the shear stress, stream power and unit stream power were compared when estimating the soil detachment rate. The power functions of stream power and shear stress were equivalent, and both are recommended to predict detachment rates. Local soil conservation can benefit from the results of this study with improved predictions of erosion on croplands in the red soil region of China. Copyright © 2016 John Wiley & Sons, Ltd.
Introduction
One of the most serious causes of soil degradation in croplands in many parts of the world is soil erosion (Cerdà et al., 2009; Keesstra et al., 2016; Borrelli et al., 2015). The erosion rates in conventionally tilled cropland are on average one- to twofold greater than the rates of soil production (Montgomery, 2007). Because soil erosion removes the productive layer of topsoil, crop yields and land values are reduced, and a serious threat is posed to global food production capacity and food security (Biggelaar et al., 2004).
Appropriate management practices can control soil erosion in agricultural lands by increasing coverage and altering soil characteristics (Novara et al., 2011; Cerdà et al., 2016). In recent decades, the application of alternative management practices has prevented soil and water loss from cropland. The adoption of conservation measures such as no tillage (Jiao et al., 2006), mulch-till (Andruschkewitsch et al., 2013; Li et al., 2016), intercropping (Beedy et al., 2010), crop rotation (Ba et al., 2016) and manure management (N'Dayegamiye & Angers, 1990) were reported to significantly enhance soil organic matter concentrations and to be beneficial for soil structure via aggregation processes (Aksakal et al., 2016; Ba et al., 2016). With the improvement in soil properties such as texture, structure and organic matter content, the capability of soil to resist erosion agents increases (Knapen et al., 2007) and erosive driving forces decrease (Cerdà, 1998, 2000; Mekonnen et al., 2015; Rodrigo Comino et al., 2015; Ochoa et al., 2016). Therefore, quantifying the resistance of soils to water erosion is essential in evaluating the efficiency of certain management practices in controlling soil loss, and in particular for the application of soil erosion models.
In process-based erosion models, the erosion resistance of soil often applies during the detachment process (Knapen et al., 2007). Soil detachment is defined as the dislodging of soil particles from the soil mass by raindrops and overland flow. In concentrated flow paths, for example, rills and gullies, overland flow scouring is the dominant process that detaches and transports soil particles. During previous decades, many researchers conducted hydraulic flume or field experiments to investigate the characteristics of soil detachment by open-channel flow (Lyle & Smerdon, 1965; Laflen et al., 1991; Nearing et al., 1991, 1997; Zhang et al., 2003, 2008). Mechanistic detachment models have been developed to predict the erosion rate for both cohesive and noncohesive soils (Wilson, 1993a, 1993b). The soil physical and chemical properties closely correlated with the detachment capacity (Morgan et al., 1998). Thus, adjustments in land use and farming activities can influence soil detachment by overland flow (Zhang et al., 2008; Li et al., 2015). Experiments have been conducted to determine soil detachment for a large variety of soil types and surface conditions, including deserts (Nearing et al., 1999), farmland (Zhang et al., 2003), forested land (Burylo et al., 2012) and unpaved road surfaces (Foltz et al., 2008; Cao et al., 2009, 2011). The soil detachment in these studies is generally measured by hydraulic variables such as the flow shear stress (Nearing et al., 1991), stream power (Hairsine & Rose, 1992) and unit stream power (Morgan et al., 1998). Because hydraulic parameter does not represent an actual measurable soil property (Knapen et al., 2007), the values in models are often acquired through calibration in different regions.
In China, approximately 4·54 × 105 km2 of farmland is under soil erosion risk (Zhang & Sheng, 2013). Severe soil erosion occurs in these croplands because of the high soil erodibility, high precipitation, hilly landforms and intensive cultivation, particularly in the hilly red soil region of China in which large areas of conventional agricultural fields continue to be found (Liang et al., 2010). Although several conservation tillage practices have been adopted to control soil loss from croplands (Wei et al., 2007; Zhang et al., 2009), tillage systems for the conservation of soil and water have received relatively little attention. Evaluating the efficiency of management practices in reducing erosion and protecting the soil surface is critical to effectively adopt these procedures in the sloping farmlands of this red soil region. Therefore, to predict soil loss effectively, erosion models are required, and related soil hydraulic parameters must be quantified. For this purpose, Wang et al. (2016) conducted field research to compare the soil hydrological properties under multiple tillage systems. However, the influence of management practices on the resistance of soil to overland flow remains unclear.
We hypothesized that soils from conservation management practices were less erodible than those from conventional management practices. In this study, hydraulic flume experiments were conducted under different overland flow conditions to (i) explore the influence of management practice on the resistance of soil to overland flow entrainment and (ii) to select hydraulic variables and develop equations to help to predict soil loss from croplands in the red soil region of China.
Materials and Methods
Study Site
The experimental site is located at the Ecological Experimental Station of Red Soil, Chinese Academy of Sciences, Yujiang County, Jiangxi Province, China (28°15′N, 116°55′E). The average annual rainfall is 1795 mm, with approximately 50% of the total precipitation occurring from March to June. The mean annual temperature is 17·6 °C, and the elevation ranges from 35 to 60 m. The primary soils of the area include ultisols from Quaternary red clay and inceptisols from red sand shale (Shi et al., 2004). The study area is a typical agricultural region in which traditional downslope tillage practices have been adopted along sloping cropland. Severe soil loss has been reported from these lands, particularly under heavy rainfalls (rainfall intensity of about 80 mm h−1 with the 50a return period).
Field plots were established in 2011 by planting peanuts with the five treatments described by Wang et al. (2016). These plots included peanuts that were fertilized with manure (PM) or covered by rice straw mulch (PC), peanut and orange intercropping (PO), peanut and radish rotation (PR) and traditional farrow peanut (PF). All plots were ploughed to a depth of 30 cm by a tractor in early April. Then, peanuts were planted at the density of approximately 125,000 plants ha−1 with a row spacing of 40 cm and a plant spacing of 20 cm. Descriptions of the different treatments are shown in Table I. Each treatment was replicated in three plots for a total of 15 plots. The plots were isolated from one another by concrete banks, which extended from 80 cm below the surface to 20 cm above the surface. At sowing, all fertilizer was banded at 5 cm from the seed. The fertilizer rates used for the peanuts were 61 kg ha−1 nitrogen (N), 90 kg ha−1 phosphorus (P2O5) and 52 kg ha−1 potassium (K2O). More details on fertilizer rates of the plots can be obtained in Wang et al. (2016). According to the USDA soil texture classification, the soils under the different treatments were clay soils, and the characteristics of the soils are listed in Table II.
| Treatment | Abbreviation | Description |
|---|---|---|
| Manure fertilizer | PM | Fresh pig manure that contained 8·87 g per kg N, 7·41 g per kg P2O5 and 3·45 g per kg K2O, and 70% water was applied at the rate of 23 t ha−1 |
| Straw mulch cover | PC | Peanut fields covered by rice straw mulch at a rate of 5 t ha−1 |
| Peanut and orange intercropping | PO | Orange trees were planted in spring 2011 with 15 orange trees per plot (3 × 5) |
| Peanut and radish rotation | PR | Radishes were sowed each September after the peanut harvest at the density of approximately 12,000 plants ha−1 |
| Traditional farrow peanut | PF | Peanut fields with 20-cm-wide furrows in the slope direction |
| Treatment | Sand | Silt | Clay | Bulk density (g cm−3) | Organic matter (g kg−1) | MWD (mm) | WSA0·25 |
|---|---|---|---|---|---|---|---|
| PC | 24·12 | 35·29 | 40·59 | 1·23 a | 18·18 ab | 1·21 b | 0·58 ab |
| PR | 25·04 | 34·89 | 40·07 | 1·06 b | 17·17 bc | 1·14 b | 0·51 b |
| PF | 23·25 | 36·00 | 40·75 | 1·14 ab | 15·64 c | 0·73 c | 0·56 ab |
| PO | 26·23 | 33·39 | 40·39 | 1·06 b | 19·43 a | 1·58 a | 0·65 a |
| PM | 25·53 | 32·35 | 42·12 | 1·11 ab | 18·63 ab | 0·79 c | 0·50 b |
- Note: Different letters in the same column indicate a significant difference at the level p < 0·05. PC, PR, PF, PO and PM represent the straw mulch cover, peanut–radish rotation, traditional furrow peanut, peanut–orange intercropping and manure fertilizer, respectively. Sand, Silt and Clay indicate soil particle sizes of 2–0·05, 0·05–0·00 and <0·002 mm, respectively. MWD is the mean-weight diameter, which was calculated as
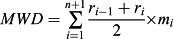 , where ri is the aperture of the ith mesh (mm), ro = ri and rn = rn + 1, mi is the weight fraction of the aggregates on the ith sieve and n is the number of sieves. WSA0·25 is the wet-sieved aggregates larger than 0·25 mm.
Soil Sampling
Experiments were conducted in July 2015 three months after the peanuts were planted, which was during the rainy season, March to July, and corresponded with the annual period of the highest risk of soil loss. Undisturbed soil samples were collected from the top layers of field plots with steel rings (10 cm in diameter and 5 cm in height) according to Cao et al. (2009). First, the ring was placed on a flat, bare patch between crops, avoiding roots of vegetation. Then, the iron ring was carefully pressed down into the soil until it was completely filled. The ring was removed, and the soil sample was carefully cut across the bottom end of the ring. A cushion of cotton cloth was placed onto the bottom of the soil ring, and the sample ends were tightly capped to avoid disturbance during sample transport. The surrounding soil was simultaneously sampled to measure soil moisture. The weight of the soil samples in the rings was measured as soon as possible to decrease the weight loss from evaporation and ensure the identical soil moisture as that in the field. The samples were wet for 8 h in a container with a water-level 1 cm below the topsoil surface and then drained for 12 h in preparation for experimentation (Wang et al., 2013; Li et al., 2015). In this study, 15 soil samples were collected from each plot for 225 total soil samples.
Measurement of Hydraulic Variables
 (1)
(1) (2)
(2) (3)
(3)
Measurement of Detachment
Before each test, the flume was set at the desired slope gradient, and the designed flow discharge was applied to the flume from the upper edge. A pre-wet soil sample was inserted into the soil chamber, which was located at a distance of 0·3 m from the lower end of the flume, and the surface of the sample was adjusted to the identical level as that of the flume bed. During this stage, a panel was used to prevent the scouring of the soil sample by the upslope water. Once the set-up was completed, the panel was removed and the detachment experiment was initiated. The test lasted no more than 600 s for each sample. When the scouring depth reached 2 cm, the test was stopped to prevent boundary effects from sampling the ring. After each test, the soil sample was oven-dried at 105 °C for 24 h and weighed to determine the final oven-dry mass. The soil detachment capacity was calculated as the total mass of soil loss (original weight of wet soil sample minus the weight of water within the sample and minus the final oven-dry mass) divided by the time interval of the test and the cross-sectional area of the soil sample (Nearing et al., 1991). Three tests were conducted for each treatment by using soil samples from the three replicate plots. Therefore, 75 treatments were analysed (5 tillage systems × 5 flow discharges × 3 slope gradients) for a total of 225 tests.
Data Analyses
 (4)
(4)Results and Discussion
Soil Detachment Rates of Different Treatments
The soil detachment rates for the PO, PM, PC, PR and PF treatments are shown in Table III. The PR treatment showed the highest average detachment rate (0·137 kg s−1 m−2), followed by the PF treatment, which had an average value of 0·061 kg s−1 m−2. The PC treatment showed the lowest average soil detachment rate among all treatments, which measured 0·016 kg s−1 m−2. The detachment rates of the PO and PM treatments were 0·048 and 0·034 kg s−1 m−2, respectively.
| Slope (%) | Flow discharge (L s−1) | Flow velocity (m s−1) | Flow depth (m) | Shear stress (Pa) | Stream power (kg s−3) | Unit stream power (m s−1) | Soil detachment rate (kg s−1 m−2) | ||||
|---|---|---|---|---|---|---|---|---|---|---|---|
| PC | PR | PF | PO | PM | |||||||
| 8·7 | 1 | 0·510 | 0·007 | 5·609 | 2·858 | 0·045 | 0·004 | 0·006 | 0·007 | 0·005 | 0·007 |
| 1·5 | 0·552 | 0·009 | 7·770 | 4·287 | 0·048 | 0·009 | 0·004 | 0·006 | 0·009 | 0·007 | |
| 2 | 0·714 | 0·009 | 8·002 | 5·716 | 0·062 | 0·009 | 0·008 | 0·011 | 0·006 | 0·009 | |
| 2·5 | 0·769 | 0·011 | 9·288 | 7·145 | 0·067 | 0·014 | 0·008 | 0·012 | 0·013 | 0·010 | |
| 3 | 0·851 | 0·012 | 10·074 | 8·574 | 0·074 | 0·009 | 0·013 | 0·017 | 0·015 | 0·011 | |
| 17·6 | 1 | 0·552 | 0·006 | 10·440 | 5·760 | 0·097 | 0·010 | 0·019 | 0·018 | 0·022 | 0·013 |
| 1·5 | 0·702 | 0·007 | 12·312 | 8·640 | 0·124 | 0·012 | 0·017 | 0·023 | 0·035 | 0·027 | |
| 2 | 0·777 | 0·009 | 14·832 | 11·520 | 0·137 | 0·012 | 0·085 | 0·065 | 0·041 | 0·029 | |
| 2·5 | 0·920 | 0·009 | 15·660 | 14·400 | 0·162 | 0·017 | 0·155 | 0·070 | 0·055 | 0·040 | |
| 3 | 0·936 | 0·011 | 18·468 | 17·280 | 0·165 | 0·025 | 0·401 | 0·162 | 0·057 | 0·036 | |
| 26·8 | 1 | 0·640 | 0·005 | 13·677 | 8·753 | 0·171 | 0·015 | 0·098 | 0·012 | 0·024 | 0·044 |
| 1·5 | 0·714 | 0·007 | 18·381 | 13·130 | 0·191 | 0·018 | 0·133 | 0·072 | 0·068 | 0·051 | |
| 2 | 0·870 | 0·008 | 20·132 | 17·506 | 0·233 | 0·022 | 0·116 | 0·058 | 0·115 | 0·054 | |
| 2·5 | 0·967 | 0·009 | 22·621 | 21·883 | 0·259 | 0·025 | 0·321 | 0·100 | 0·119 | 0·065 | |
| 3 | 0·988 | 0·010 | 26·587 | 26·259 | 0·265 | 0·032 | 0·668 | 0·279 | 0·137 | 0·104 | |
- Note: PC, PR, PF, PO and PM stand for the straw mulch cover, peanut–radish rotation, traditional farrow peanut, peanut–orange intercropping and manure fertilizer, respectively.
Soil detachment in rills is affected by both the flow hydraulics (Nearing et al., 1997; Zhang et al., 2003) and soil properties. Because the hydraulic conditions in this study were well controlled and were similar for each treatment, the disparities in the detachment rates for different management practices were caused by differences in the soil properties (Table II). As shown in Table II, the organic matter content, aggregate stability and bulk density of surface soil had statistically significant differences within treatments. Generally, the samples were more resistant to detachment in the soils with higher organic matter content. Therefore, the low detachment rates for PC and PM treatments might be explained by the relatively high organic matter contents because of mulch and manure decomposition. By contrast, organic matter contents were relatively low in both PR (17·17 g kg−1) and PF (15·64 g kg−1) treatments, which might explain the high rates of soil detachment. Additionally, the low mean-weight diameter (MWD) (1·14 and 0·73 mm for PR and PF, respectively) and the values for wet-sieved aggregates larger than 0·25 mm (WSA0·25) (0·51 and 0·56 for PR and PF, respectively) indicated low soil structural stability in the two treatments. The findings of this study were supported by Li et al. (2015) who showed that soil detachment rate was negatively correlated with stable aggregate and aggregate median diameter. It also verified the high soil-loss potential for PR and PF treatments because of the intensive disturbances with the radish rotation and the conventional downslope furrows (Wang et al., 2016).
However, the characteristics of the aggregate stability may not be the only factor that determines the susceptibility of soil to runoff and erosion. Although the PO treatment showed the highest MWD (1·58 mm) and WSA0·25 (0·65) values, the soil detachment rate remained relatively high. The soil bulk density of the PO treatment likely explained this result, which was the lowest among all treatments. A power relationship described the decrease in soil detachment rates in all the tests as soil bulk density increased, as shown in Figure 2. Therefore, the low soil detachment rate of the PC treatment, which had the highest soil bulk density (1·23 g cm−3) among all treatments, was likely explained by this relationship. Of note, although straw mulch treatments generally reduce soil bulk density (Keesstra et al., 2016), some researchers also claim that mulching effects on bulk density may vary due to soil type, antecedent soil properties, type of mulch, climate and land use (Mulumba & Lal, 2008). In our future studies, the bulk density in the PC treatment will be explored further with other properties such as aggregate stability.

Detachment Rate under Different Flow and Slopes
With a slope of 8·7%, the soil detachment rates were approximately 0·01 kg s−1 m−2, and no significant differences were detected among the five treatments (ANOVA, p = 0·8). With an increase in the slope gradient, the soil detachment rates increased, and differences among the treatments became more prominent. The soil detachment rates in the PR and PF treatments were significantly higher than those in the other treatments under slopes of 16·7% and 26·8% (ANOVA, p = 0·026 and 0·031, respectively). Especially for the PR treatment, soil detachment was much higher than that of the other treatments under a slope of 26·8% (ANOVA, p = 0·002). The soil detachment rates for the different treatments are plotted with flow discharge in Figure 3, and the detachment rates increased linearly with flow discharge for the identical slope gradient. The coefficients of linear functions increased with the slope gradient, and when the slope gradient was greater than 16·7%, the function coefficients increased sharply, particularly for the PR and PF treatments. This relation was consistent with previous results (Zhang et al., 2003; Cao et al., 2009) and demonstrated the importance of slope gradient in determining the soil detachment rate.

Additional multiple nonlinear regression analyses were conducted to predict the detachment rate based on simple hydraulic variables such as the flow discharge and slope gradient. The soil detachment rates in all treatments were described by power functions of the flow discharge and slope gradient (Table IV). For the determination coefficients (R2), the agreement between the predicted and observed values was high, particularly for the PO and PM treatments (R2 = 0·943 and 0·965, respectively). The standardized regression coefficients of flow discharge and slope gradient indicated the ability of the two independent variables in explaining the variation in soil detachment rates (Stumpe et al., 2011). As shown in Table IV, when evaluating the soil detachment rates for all treatments, high standardized coefficients indicate that slope gradient contributed more than flow discharge to soil detachment.
| Treatments | Equations | Standardized coefficients | R2 | |
|---|---|---|---|---|
| Flow discharge | Slope gradient | |||
| PC | 11·07 q0·831S0·794 | 0·624 | 0·709 | 0·874 |
| PR | 571,488·7 q1·732S2·965 | 0·417 | 0·850 | 0·879 |
| PF | 57,746·8 q1·776S1·770 | 0·600 | 0·712 | 0·849 |
| PO | 1,252·39 q1·115S1·983 | 0·417 | 0·882 | 0·943 |
| PM | 47·86 q0·704S1·730 | 0·318 | 0·932 | 0·965 |
- Note: PC, PR, PF, PO and PM stand for the straw mulch cover, peanut–radish rotation, traditional farrow peanut, peanut–orange intercropping and manure fertilizer, respectively. q is the flow discharge in m3 s−1, and S is the tangent value of the slope gradient.
Soil Erosion Resistance of Different Management Practices
Linear regression was conducted between the soil detachment rate and flow shear stress, with the results shown in Table V. The linear functions were essentially the excess shear stress models that are adopted in the Water Erosion Prediction Project (WEPP) model to describe rill soil detachment (Foster et al., 1995). The function coefficient is the rill erodibility (s m−1), which is a measure of soil susceptibility to detachment by concentrated flow (Alberts et al., 1995).
| Treatments | Equations | R2 |
|---|---|---|
| PC | Dc = 0·001 (τ − 0·83) | 0·90 |
| PR | Dc = 0·027 (τ − 9·15) | 0·73 |
| PF | Dc = 0·010 (τ − 8·42) | 0·71 |
| PO | Dc = 0·007 (τ − 7·33) | 0·92 |
| PM | Dc = 0·004 (τ − 6·37) | 0·91 |
- Note: PC, PR, PF, PO and PM stand for the straw mulch cover, peanut–radish rotation, traditional farrow peanut, peanut–orange intercropping and manure fertilizer, respectively. Dc (kg s−1 m−2) is detachment rate, and τ (Pa) is shear stress.
As shown in Table V, the variation in the rill erodibility was high among the five management practice treatments. The lowest value of the rice straw mulch (PC) treatment (0·001 s m−1) was consistent with that of Prosdocimi et al. (2016a), who reported that straw mulch was very effective in reducing soil erodibility. Soils from the radish crop rotation (PR) showed the highest rill erodibility (0·027 s m−1), which was 27-fold higher than that of the PC treatment. The rill erodibility of the PF treatment was also higher than that of the other three treatments. As discussed earlier, the low organic matter content, MWD and WSA0·25 might explain the high rill erodibility of PR and PF. The low soil bulk density of the PR treatment was also an important cause of the high rill erodibility, which was consistent with results of previous research in which bulk density is negatively correlated with soil erodibility during concentrated flow (Bennett et al., 2000; Sheridan et al., 2000; Li et al., 2015). The rill erodibility for the PF treatment, a conventional management practice, was lower than that reported by Zhang et al. (2008) for a silt loam loess soil (0·0164 s m−1) cropland. The soils in this study contained more clay than loess soil, which possibly resulted in the higher susceptibility to detachment (Alberts et al., 1995). The soil texture was not the only determining factor; the PR treatment in this study showed higher rill erodibility than that in the loess cropland because of more tillage disturbances during the radish rotation. In this study, generally, the rill erodibility parameters were within the range of the WEPP rill erosion study (Laflen et al., 1991). Nevertheless, the values in PR and PF treatments were nearly double those in the clay or clay loam soils of the WEPP data, which implied that soils in this study were easily detached and that the soil erosion risk might be underestimated by using mode default values. However, the rill erodibility for the three treatments (PO, PM and PC) after the conservation measures were adopted was close to that reported by Laflen et al. (1991) for cropland soils of the identical texture.
Prediction of Detachment Rate Based on Hydraulic Variables
Flow shear stress, stream power and unit stream power are hydraulic variables that are widely adopted in erosion models to describe soil detachment processes. The soil detachment rates were plotted with these three parameters (Figure 4) to develop prediction models, and the nonlinear regressions are presented in Table VI. Based on the results, the detachment rates were better fitted to the shear stress with power functions than with linear functions (Table V) for the PR and PF treatments, which had extremely high detachment rates under steep slopes and high flow discharge. Compared with linear functions, the determination coefficients (R2) improved by 15% for power functions. These results are consistent with those of previous research reported under different conditions (Wilson 1993ab; Zhang et al., 2002, 2003; Cao et al., 2009; Al-Madhhachi et al., 2014); therefore, power functions of the flow shear stress are suggested to predict detachment rates in these treatments. For the PO, PM and PC treatments, the power function of the shear stress was equivalent to that of the linear function in predicting the soil detachment rate.
| Treatments | Flow shear stress | Stream power | Unit stream power | |||
|---|---|---|---|---|---|---|
| Equations | R2 | Equations | R2 | Equations | R2 | |
| PC | Dc = 8·94 × 10−4 τ1·08 | 0·89 | Dc = 0·0024 ω0·78 | 0·92 | Dc = 0·075 P0·79 | 0·76 |
| PR | Dc = 1·09 × 10−5 τ3·35 | 0·84 | Dc = 2·18 × 10−4 ω2·44 | 0·88 | Dc = 15·45 P2·65 | 0·61 |
| PF | Dc = 1·13 × 10−5 τ3·05 | 0·81 | Dc = 2·07 × 10−4 ω2·17 | 0·83 | Dc = 2·80 P2·10 | 0·52 |
| PO | Dc = 1·62 × 10−4 τ2·09 | 0·93 | Dc = 0·0012 ω1·47 | 0·90 | Dc = 1·83 P1·98 | 0·94 |
| PM | Dc = 1·70 × 10−4 τ1·94 | 0·93 | Dc = 0·0012 ω1·34 | 0·86 | Dc = 0·69 P1·60 | 0·91 |
- Note: PC, PR, PF, PO and PM stand for the straw mulch cover, peanut–radish rotation, traditional farrow peanut, peanut–orange intercropping and manure fertilizer, respectively. Dc (kg s−1 m−2) is detachment rate, τ (Pa) is shear stress, ω (kg m−3) is stream power and P (m s−1) is the unit stream power.

By contrast, as shown in Table VI, power functions of the stream power provided a good evaluation of the soil detachment rates in all the different treatments. In some experiments conducted in laboratory and field conditions, the flow stream power performed better than the shear stress in predicting soil detachment (Nearing et al., 1999; Zhang et al., 2002, 2003). Based on our data, the stream power was generally equivalent to the flow shear stress as a predictor of the detachment rate. The unit stream power is a relatively poor parameter in evaluating the soil detachment rate compared with the flow shear stress and stream power (Zhang et al., 2002, 2003; Cao et al., 2009), which was verified for the PC, PR and PF treatments by the low determination coefficients, as shown in Table VI. However, the precision of this parameter was higher (R2 > 0·90) than that of stream power in predicting the detachment rates for the PO and PM treatments. Notably, the PO and PM treatments had the highest standardized coefficients of the slope gradient (Table IV), which demonstrated the effect of slope on soil detachment and might explain the performance of the unit stream power in this study. Similarly, Cao et al. (2011) report that the precision of the unit stream power is higher than that of the shear stress and stream power under steep slope conditions.
Although the hydraulic variables showed close relationships with the soil detachment rate, disparity occurred among the prediction functions when adopted in different management practices. To determine effective models for evaluating the soil detachment rate in the study area, the model efficiencies for the functions mentioned earlier were calculated and are listed in Table VII. The high ME values for the slope and flow discharge indicated that this power function was the best among all models for predicting the soil detachment rates in low-risk treatments (i.e. PC, PO and PM). However, this function performed relatively poorly compared with the shear stress and stream power for the PR and PF treatments, which had high detachment capability (ME = 0·761 and 0·775 for PR and PF, respectively). The power function of the unit stream power was similar, which reached a model efficiency of greater than 0·93 for the PO and PM treatments but was low (average ME of 0·65) for the other three treatments. These results demonstrated that management practices should be considered when selecting the best hydraulic variable to predict soil loss. Among the equations, the power functions of both shear stress and stream power provided good estimations of the soil detachment rate for all treatments (ME higher than 0·80). Therefore, these functions are recommended to evaluate soil detachment rates, particularly for high-risk treatments, such as PR and PF in this study.
| Treatments | Slope and flow discharge | Shear stress (power function) | Shear stress (linear function) | Stream power | Unit stream power |
|---|---|---|---|---|---|
| PC | 0·926 | 0·896 | 0·771 | 0·926 | 0·775 |
| PR | 0·761 | 0·852 | 0·734 | 0·885 | 0·635 |
| PF | 0·775 | 0·821 | 0·707 | 0·841 | 0·551 |
| PO | 0·959 | 0·933 | 0·917 | 0·907 | 0·946 |
| PM | 0·932 | 0·938 | 0·894 | 0·866 | 0·912 |
- Note: PC, PR, PF, PO and PM stand for the straw mulch cover, peanut–radish rotation, traditional farrow peanut, peanut–orange intercropping and manure fertilizer, respectively.
Implications of This Study and Future Prospects
In this study, hydraulic flume experiments were conducted to investigate the effects of management practices on the soil detachment capacity, which was measured by using undisturbed topsoil samples from red soil cropland. As a general method adopted by many researchers (Nearing et al., 1991; Zhang et al., 2003; Li et al., 2015), the detachment rates determined for the different treatments of this study can be compared with those of other similar research. As demonstrated by our results, soils from conventional tillage cropland were highly erodible, but conservation measurements were also verified as efficient in preventing soil from detaching by overland flow. Nevertheless, because the laboratory flume is different from the actual rill conditions, the results are not suitable for a practical application in predicting soil loss. The primary objective of the experimental design was to examine the basic physics associated with detachment by flow and provide some theoretical support in erosion modelling. Therefore, the equations proposed based on our data should be helpful in selecting hydraulic variables when establishing a model to predict soil loss occurring on red soil cropland. To realistically reproduce the rill erosion process and estimate the rill erosion rate more accurately, field runoff simulation experiments would be conducted in the future. Especially for the straw mulch treatment, which showed the lowest rill erodibility in this study, different application rates, cover and types of mulches should be compared (Prosdocimi et al., 2016b) and the scale effect also should be considered when conducting experiments (Sadeghi et al., 2015). Additionally, further studies are required to clarify the relationships between soil properties of red soil cropland and detachment rates, and more soil structure indexes should be adopted and compared with one another to provide a better estimation of the physical condition of the soil.
Conclusions
The hydraulic flume experiments showed that soils from conventional downslope furrows (PF) and peanut and radish rotation (PR) treatments were highly erodible. By contrast, the relatively low detachment rates and rill erodibility revealed that the three conservation management practices, that is, straw mulch cover (PC), organic manure treatment (PM), and peanut–orange intercropping (PO), increased the resistance of soil to concentrated flow erosion. Our results also indicated that more tillage activity increases the erodibility of soil, and therefore, tillage disturbance should be minimized for purposes of conservation. Soil organic matter content, soil structural stability and bulk density influenced the soil detachment and rill erodibility. The soil detachment rate was also closely correlated with hydraulic variables, and prediction equations should be established according to management practices. Power functions of the flow discharge and slope provided excellent evaluations (model efficiency higher than 0·90) of the soil detachment rates in low-risk treatments (i.e. PC, PO and PM). Stream power was equivalent to shear stress and provided good estimations of the soil detachment rates for all treatments (model efficiency higher than 0·80). Therefore, the power functions of stream power or shear stress can be used to evaluate the high detachment rates of the PR and PF treatments.
Acknowledgements
The work in this paper is part of projects 2011BAD31B04-2 and 2014BAD15B0302, which are supported by the Key Technologies Research and Development Program of China, and projects 41571273 and 41471237, which are supported by the National Natural Science Foundation of China.