Utility of Machine Learning Algorithms in Predicting Preoperative Lymph Node Metastasis in Patients With Rectal Cancer Based on Three-Dimensional Endorectal Ultrasound and Clinical and Laboratory Data
This work was supported by Joint Funds for the Innovation of Science and Technology, Fujian Province (grant number: 2021Y9220) and the Fujian Provincial Health Commission (grant number: 2018-ZQN-14).
The authors declare that they have no competing interests.
We would like to acknowledge the hard and dedicated work of all the staff that implemented the intervention and evaluation components of the study.
Abstract
Background
We aimed to investigate the value of a machine learning (ML) algorithm in the preoperative prediction of lymph node metastasis in patients with rectal cancer.
Methods
Based on the histopathological results, 126 rectal cancer patients were divided into two groups: lymph node metastasis-positive and metastasis-negative groups. We collected clinical and laboratory data, three-dimensional endorectal ultrasound (3D-ERUS) findings, and parameters of the tumor for between-group comparisons. We constructed a clinical prediction model based on the ML algorithm, which demonstrated the best diagnostic performance. Finally, we analyzed the diagnostic results and processes of the ML model.
Results
Between the two groups, there were significant differences in serum carcinoembryonic antigen (CEA) levels, tumor length, tumor breadth, circumferential extent of the tumor, resistance index (RI), and ultrasound T-stage (P < 0.05). The extreme gradient boosting (XGBoost) model had the best comprehensive diagnostic performance for predicting lymph node metastasis in patients with rectal cancer. Compared with experienced radiologists, the XGBoost model showed significantly higher diagnostic value in predicting lymph node metastasis; the area under curve (AUC) value of the receiver operating characteristic (ROC) curve of the XGBoost model and experienced radiologists was 0.82 and 0.60, respectively.
Conclusions
Preoperative predictive utility in lymph node metastasis was demonstrated by the XGBoost model based on the 3D-ERUS finding and related clinical information. This could be useful in guiding clinical decisions on the selection of different treatment strategies.
Abbreviations
-
- 3D-ERUS
-
- three-dimensional endorectal ultrasound
-
- AUC
-
- the area under curve
-
- CEA
-
- carcinoembryonic antigen
-
- CT
-
- computed tomography
-
- ERUS
-
- endorectal ultrasonography
-
- ML
-
- machine learning
-
- MRI
-
- magnetic resonance imaging
-
- RC
-
- rectal cancer
-
- RF
-
- random forest
-
- RI
-
- resistance index
-
- ROC
-
- receiver operating characteristic
-
- SVM
-
- support vector machine
-
- TME
-
- total mesorectal excision
-
- XGBoost
-
- extreme gradient boosting
Rectal cancer (RC) is one of the most common malignant tumors of the digestive tract, affecting 700,000 new patients worldwide annually.1 According to the latest data from GLOBOCAN 2021,2 RC ranks eighth among all cancers worldwide in terms of both incidence (3.9%) and mortality (3.2%). Although total mesorectal excision (TME) is the standard surgical treatment of mid and low RC,3 positive lymph nodes suggest a risk of systemic metastasis and an unfavorable prognosis.4 Thus, patients with locally advanced RC (tumor categories 3–4 or node categories 1–2) require multimodal therapy to reduce the rate of local recurrence.5 Therefore, accurate preoperative evaluation of lymph node metastasis is important for facilitating treatment decisions and evaluating prognoses.
Preoperative evaluation of lymph nodes is done using imaging investigations such as computed tomography (CT), magnetic resonance imaging (MRI), and endorectal ultrasonography (ERUS),6-8 whereas ERUS and CT showed similar accuracy. The sensitivity and specificity of CT and ERUS were 79 and 76%, and 58 and 80%, respectively.9 Therefore, meta-analyses and population data demonstrate that clinical nodal staging, even with the combination of ERUS, CT, and MRI, is unreliable.10
Machine learning (ML) algorithms have been widely used in the medical field for outcome prediction, diagnosis, treatment management, and prognosis.11, 12 However, the logic and complexity of various ML algorithms vary,13 and there may also be differences in their clinical applications. A previous study14 compared the diagnostic performance of different ML algorithms, such as the support vector machine (SVM), k-nearest neighbor, random forest (RF), extreme gradient boosting (XGBoost), and light gradient-boosting machine (LightGBM), in the diagnosis of benign and malignant breast lesions. They found that the LightGBM model showed the best among the five ML models, achieving 99.86% accuracy, 100.0% precision, 99.60% recall, and 99.80% on the F1-score. Further, studies have demonstrated the potential of an ML model to preoperatively predict lymph node metastases in patients with RC. However, ML remains limited to MRI and CT images.15, 16 Consequently, in the present study, we developed and validated an ML algorithm for the preoperative prediction of lymph node metastasis of RC based on the three-dimensional endorectal ultrasound (3D-ERUS) findings, along with related clinical information, carcinoembryonic antigen (CEA), and carbohydrate antigen 19-9 (CA199) values.
Materials and Methods
Study Participants
Medical records of patients diagnosed with rectal cancer and admitted to our hospital between May 2020 and September 2022 were analyzed retrospectively. The inclusion criteria were the following: 1) Patients with rectal cancer confirmed pathologically by preoperative enteroscopy biopsy; 2) Patients whose preoperative blood test findings for CEA and CA199 were available; and 3) Patients whose 3D-ERUS findings within 1 week before surgery were available. All patients underwent total mesorectal excision and did not undergo neoadjuvant chemoradiotherapy. This study was approved by the Ethics Committee of the Fujian Cancer Hospital (2017-044-01, K2022-168-01), which waived the requirement of informed consent given the retrospective nature of this study.
Instruments
Ultrasonography was performed using a Flex Focus ultrasound scanner (BK Company, Denmark) with a rectal 3D probe frequency of 8–15 Hz. Intestinal cleaning was performed using a cleansing enema or two prescriptions of Hengkangzhengqing produced by Jiangxi Hengkang Pharmaceutical Co, Ltd, a laxative approved for bowel clearing, in our hospital and administered as a 2000 mL suspension before the examination.
Inspection Protocol
Intestinal cleaning was performed 4–6 hours before the imaging procedure. During 3D-ERUS, the patient was asked to lie on the left side with the hip and knee bent. An ultrasound examination was performed after injecting 60 mL of couplant with an enema irrigator into the rectum through the anus. The surface of the ultrasound probe was coated with latex and coated with coupling. Subsequently, the probe was slowly inserted into the rectum beyond the injury site. The depth of the probe was adjusted to allow the detection of the main part of the lesion. Next, when the tumor was detected, the tumor location, size, shape, internal echo, blood flow, depth, and extent of tumor infiltration of the intestinal wall were observed and recorded. Additionally, we determined whether there was tumor infiltration of surrounding tissues and organs, the number of perirectal lymph nodes, and the dimensions of the largest lymph node. Finally, two physicians with over 5 years' experience in ultrasound diagnosis analyzed the ultrasound images and determined the ultrasound T and N staging.
Evaluation Standards
We did the ultrasound staging of tumor infiltration depth (uT staging) as per the staging criteria of Beynon et al17, 18 as follows: 1) uTl stage: Tumor location is limited to the mucosa and submucosa and ultrasound shows integration of the second layer of the hyperechoic zone from the inner intestinal wall to the outer membrane; 2) uT2 stage: There is evidence of infiltration of tumor to the intrinsic muscular layer, the ultrasound shows destruction of the second layer of the hyperechoic zone in the local lesion, and thickening of the outer muscular layer (second layer of the hypoechoic zone), and there is integration of the second layer of the hyperechoic zone; 3) uT3 stage: The tumor involves the whole layer and there is evidence of infiltration of the fibrous perirectal fibrous adipose tissue and the ultrasound shows destruction of the third layer of the hyperechoic zone of the local lesion and irregular serrated protuberance of the hypoechoic zone involving the peri-intestinal tissues; and 4) uT4 stage: The tumor is eroding adjacent organs or tissues (including the prostate and vagina), with ultrasound showing disappearance of the hyperechoic zone in the normal margin of organs surrounding the lesion sites, as well as no boundary between the hyperechoic and hypoechoic zones.
Machine Learning Algorithms
Data Pre-Processing
Since TME surgery was performed in all cases in this article, all patients were inpatients. The clinical data (gender, age, BMI [weight (kg)/height (cm)]) of the patients were collected immediately after the patients arrived at the hospital. The laboratory examination (CA199, CEA) was the first fasting blood test for the patients conducted in the hospital. The 3D ultrasound data (distance from the lower edge of the lesion to the anal edge, distance from the lower edge of the lesion to the inner edge of the upper edge, long diameter of the lesion, short diameter of the lesion, RI value in the lesion) can be directly presented by 3D ultrasound images. The scope of the lesion to the perianal area % can be interpreted by doctors through ultrasound images. The T stage of the lesion was diagnosed by doctors through images and personal clinical experience.
Data analyzed in this study included continuous variables such as age, body mass index (BMI), serum CA199 levels, serum CEA levels, the distance between the tumor and anal margin, distance from the lower tumor margin to the upper internal anal sphincter (IAS), tumor length, tumor breadth, Vmax, and resistance index (RI), as well as categorical variables such as gender (male and female), circumferential extent of the tumor (25, 50, and 100%), and ultrasound staging (T1, T2, T3, and T4). Categorical variables were processed using an on-demand code.
Development of the Training and Test Sets
The 126 samples were randomly divided into training sets and test sets, following a ratio of 7:3. Samples were balanced to allow consistency of proportions between the train and test sets with that of the total data set.
We used the training set to train the model. Ten-fold cross-validation was performed on four ML algorithms, namely, the support vector machine (SVM), extreme gradient boosting (XGBoost), Random Forest (RF), and the Light Gradient Boosting Machine (LightGBM). The grid search method was used to optimize the parameters, which adjusted and optimized the diagnostic performance of all ML algorithms and avoided overfitting the model, improving the accuracy of model classification. We comprehensively evaluated the diagnostic performance of the four algorithms for predicting lymph node metastasis in patients with rectal cancer using the average AUC and average accuracy derived from the 10-fold cross-validation. The entire training data set was used for training the four ML models.
The diagnostic performance of the ML model was verified through the test set data, and the diagnostic performance of all models was evaluated using the ROC curve. We verified the fit of the best-performing model by analyzing the accuracy of the test. Then, we compared the best-performing ML algorithm with an experienced radiologist. There were two ultrasound radiologists; both are senior physicians with 5 years of clinical experience in colorectal cancer diagnosis. Finally, we evaluated the prediction utility of each variable for lymph node metastasis based on its importance identified during the algorithm application process.
Statistical Analyses
All statistical analyses were performed using SPSS (v. 26.0; IBM Corp., Armonk, NY) statistical software. Statistical significance was set at P < .05. K statistics were performed on 3D-EURS findings of lesions. Categorical variables are presented as number (percentage), with comparisons between groups done using the chi-squared test. Normally distributed continuous variables are presented as mean ± standard (x̄ ± s) deviation, with between-group comparisons done using the t-test. We used the rank sum test for between-group comparisons of non-normally distributed continuous variables. For data analysis, we used the four ML algorithms from the Scikit-learn (https://scikit-learn.org/stable/) packages in Python (version 3.8). Receiver operating characteristic (ROC) curves were drawn by combining the seaborn and matplotlib libraries and used to calculate the corresponding curve area, accuracy, sensitivity, specificity, negative predictive value, and positive predictive value. The classification efficiency of the model was evaluated using a confusion matrix.
Results
Clinical and Pathological Data of Patients
Among the 1803 patients with rectal cancer admitted to our hospital between May 2020 and September 2022, 599 patients underwent total mesorectal excision, 283 underwent neoadjuvant therapy before the operation, 148 did not undergo the 3D-ERUS examination, and 42 had imperfect 3D-ERUS images. In 42 patients, a) the tumor size could not be measured because the tumor was too large and not completely included in the 3D image collection; or b) in the acquisition of images, there was no color Doppler measurement; or c) the location of the distance from the anal margin was not completely collected, and the location of the tumor could not be defined. As a result, the data were incomplete and could not be selected for the study. Therefore, only the remaining 126 patients with rectal cancer (69 men and 57 women, age range: 27–78 years; mean age: 61.25 ± 10.36 years) who underwent preoperative staging with 3D-ERUS followed by surgery without neoadjuvant therapy were included in this study (Supplemental Figure 1).
In the two evaluations of the 3D-EURS findings of lesions, the intra-observer K value for radiologist A was 0.878–0.926, while the inter-observer K value for radiologists A and B was 0.866–0.906. Therefore, the evaluation of the 3D-EURS finding was reproducible and stable. All 3D-EURS findings of the lesions in this study were assessed by radiologist A.
We included 126 patients who were pathologically diagnosed with adenocarcinoma. Patients were divided into positive and negative lymph node metastasis groups according to the TNM staging of pathological results. As shown in Table 1, there were significant between-group differences in serum CEA levels, tumor length, tumor breadth, circumferential extent of the tumor, RI, and ultrasound stage T (P < .05), but not in age, gender, BMI, CA199 test, tumor location, and Vmax value (Table 1).
| Positive (47 Patients) | Negative (79 Patients) | Statistics (χ2/T/Z) | P-Value | |
|---|---|---|---|---|
| Clinical information | ||||
| Age | 59.49 ± 9.60 | 62.30 ± 10.70 | 1.482 | .141 |
| 0.009 | .923 | |||
| Male | 26 (55.32) | 43 (54.43) | ||
| Female | 21 (44.68) | 36 (45.57) | ||
| BMI | 23.56 ± 2.70 | 22.89 ± 3.37 | 1.168 | .245 |
| CA199 | 0.298 | .766 | ||
| CEA | 2.275 | .023 | ||
| Lesion site | ||||
| Distance to the anal margin (cm) | 6.16 ± 2.09 | 5.55 ± 1.89 | 1.685 | .095 |
| Distance to the upper margin of the internal anal sphincter (cm) | 2.25 ± 1.49 | 2.15 ± 1.52 | 0.359 | .720 |
| The long tumor diameter | 3.62 ± 1.00 | 3.19 ± 1.21 | 2.017 | .046 |
| The short tumor diameter | 2.278 | .023 | ||
| Tumor invasion circumference | 8.687 | .034 | ||
| ≤25% circumference | 16 (34.04) | 45 (56.96) | ||
| >25% and ≤50% circumference | 24 (51.06) | 30 (37.97) | ||
| >50% circumference and <100% circumference | 4 (8.51) | 1 (1.27) | ||
| 100% circumference | 3 (6.12) | 3 (6.38) | ||
| CDFI | ||||
| Vmax | 0.515 | .607 | ||
| RI | 0.68 ± 0.09 | 0.64 ± 0.08 | 2.307 | .023 |
| Ultrasound stage T | 12.117 | .007 | ||
| T1 | 4 (8.51) | 13 (16.46) | ||
| T2 | 11 (23.40) | 34 (43.04) | ||
| T3 | 27 (57.44) | 31 (39.24) | ||
| T4 | 5 (10.64) | 1 (1.26) |
- Note: Vmax was used to measure the peak value of systolic blood flow in tumor arteries. CA199, CEA, tumor short diameter, and Vmax values showed a non-normal distribution.
- CDFI, color Doppler flow imaging; RI, blood flow resistance index of the tumor.
Compared with pathological examination, the precision of ERUS in detecting lymph node metastasis was 65.87% (83/126 cases). Among the 47 (37.30%) patients with lymph node metastases on pathological examination, 20 (20/47 cases, 42.55%) and 27 (27/47 cases, 57.46%) patients either had or lacked evidence of lymph node metastases on ERUS, respectively. Among the 79 (62.70%) patients without lymph node metastases on pathological examination, 63 (63/79, 79.75%) and 16 (16/79, 20.25%) patients either lacked or had positive findings of lymph node metastases on ERUS, respectively.
Choosing a Machine Learning Model
In the total data set (n = 126), 47 and 79 patients had positive and negative lymph node metastases, respectively (ratio, 1:1.68). In the training set (n = 88), there were 33 and 55 patients with positive and negative lymph node metastases, respectively (ratio, 1:1.67). In the test set (n = 38), 14 and 24 patients had positive and negative lymph node metastasis, respectively (ratio, 1:1.71). Consequently, the proportions between the training and test sets groups were consistent with those of the total data set (Table 2).
| Train Set | Test Set | |||||||
|---|---|---|---|---|---|---|---|---|
| Positive (33 Patients) | Negative (55 Patients) | Statistics (χ2/T/Z) | P-Value | Positive (14 Patients) | Negative (24 Patients) | Statistics (χ2/T/Z) | P-value | |
| Clinical information | ||||||||
| Age | 59.40 ± 10.14 | 63.15 ± 10.58 | 1.636 | 0.106 | 59.71 ± 8.57 | 60.38 ± 10.95 | 0.194 | .848 |
| 0.196 | 0.658 | 0.009 | .923 | |||||
| Male | 17 (51.5) | 31 (56.4) | 9 (64.3) | 12 (50.0) | ||||
| Female | 16 (48.5) | 24 (43.6) | 5 (35.7) | 12 (50.0) | ||||
| BMI | 23.00 ± 2.22 | 22.94 ± 3.39 | 0.099 | 0.921 | 24.87 ± 3.31 | 22.77 ± 3.38 | 1.877 | .070 |
| CA199 | 0.388 | 0.698 | 0.061 | .952 | ||||
| CEA | 2.354 | 0.019 | 0.515 | .607 | ||||
| Lesion site | ||||||||
| Distance to the anal margin (cm) | 5.73 ± 2.11 | 5.78 ± 2.02 | 0.103 | 0.918 | 7.17 ± 1.70 | 5.03 ± 1.46 | 4.105 | .000 |
| Distance to the upper margin of the internal anal sphincter (cm) | 1.85 ± 1.23 | 2.18 ± 1.59 | 1.039 | 0.302 | 3.19 ± 1.67 | 2.06 ± 1.38 | 2.244 | .031 |
| The long tumor diameter | 3.59 ± 1.00 | 3.20 ± 0.98 | 1.743 | 0.086 | 3.68 ± 1.02 | 3.16 ± 1.65 | 1.056 | .298 |
| The short tumor diameter | 1.677 | 0.094 | 1.503 | .133 | ||||
| Tumor invasion circumference | 11.411 | 0.010 | 0.756 | .450 | ||||
| ≤25% circumference | 12 (36.4) | 34 (61.8) | 4 (28.6) | 11 (45.8) | ||||
| >25% and ≤50% circumference | 16 (48.5) | 21 (38.2) | 8 (57.1) | 9 (37.5) | ||||
| >50% circumference and <100% circumference | 4 (12.1) | 0 (0.0) | 0 (0.0) | 1 (4.2) | ||||
| 100% circumference | 1 (3.0) | 0 (0.0) | 2 (14.3) | 3 (12.5) | ||||
| CDFI | ||||||||
| Vmax | 0.241 | 0.809 | 0.575 | .565 | ||||
| RI | 0.67 ± 0.09 | 0.64 ± 0.08 | 1.532 | 0.129 | 0.70 ± 0.08 | 0.65 ± 0.09 | 1.884 | .068 |
| Ultrasound stage T | 9.053 | 0.029 | 4.571 | .206 | ||||
| T1 | 3 (9.1) | 6 (10.9) | 1 (7.1) | 13 (29.2) | ||||
| T2 | 9 (27.3) | 28 (50.9) | 2 (14.3) | 34 (25.0) | ||||
| T3 | 18 (54.5) | 21 (38.2) | 9 (64.3) | 31 (41.7) | ||||
| T4 | 3 (9.1) | 0 (0.0) | 2 (14.3) | 1 (4.2) | ||||
- Note: Vmax was used to measure the peak value of systolic blood flow in tumor arteries. CA199, CEA, tumor short diameter, and Vmax values showed a non-normal distribution.
- CDFI, color Doppler flow imaging; RI, blood flow resistance index of the tumor.
Based on the 3D-ERUS finding and related clinical information (including the value of CEA and CA199, gender, age, and BMI), the four ML models of RF, XGBoost, SVM, and LightBGM were compared using Average-AUC and Average-Accuracy derived from the 10-fold cross-validation (Supplemental Table 1). It showed that the XGBoost model had the best Average-AUC (0.945) and Average-accuracy (0.883).
We used the entire data from the training set for training the four ML models. Then the diagnosis performance of the training set of the ML algorithms was compared using the value of accuracy, sensitivity, specificity, and the F1-score (Table 3).
| Classifier | AUC | Accuracy | Sensitivity | Specificity | F1-Score |
|---|---|---|---|---|---|
| RF | 0.9970 | 0.9659 | 0.9091 | 1.0000 | 0.9655 |
| SVM | 0.9994 | 0.9886 | 1.0000 | 0.9818 | 0.9887 |
| XGboost | 0.9242 | 0.8863 | 0.8485 | 0.9091 | 0.8864 |
| LightGBM | 0.7579 | 0.6704 | 0.4242 | 0.8182 | 0.6569 |
External validation of the model-used test set showed that the XGBoost model performed better than the other ML models. As shown, the AUC of the model was 0.82, the accuracy was 84.21%, the sensitivity was 85.71%, the specificity was 83.33%, and the F1-score was 0.8439 (Table 4). Comparing the performance of both the training set and test set among all the ML algorithms, the XGBoost model showed a good fit (Supplemental Figures 2 and 3). Finally, we selected the XGBoost algorithm with the best diagnostic performance and compared the diagnosis performance with radiologist A.
| Classifier | AUC | Accuracy | Sensitivity | Specificity | F1-Score |
|---|---|---|---|---|---|
| RF | 0.6681 | 0.7105 | 0.4286 | 0.8750 | 0.6927 |
| SVM | 0.6057 | 0.6579 | 0.4286 | 0.7917 | 0.6474 |
| XGboost | 0.8214 | 0.8421 | 0.8571 | 0.8333 | 0.8439 |
| LightGBM | 0.6518 | 0.5789 | 0.2857 | 0.7500 | 0.5601 |
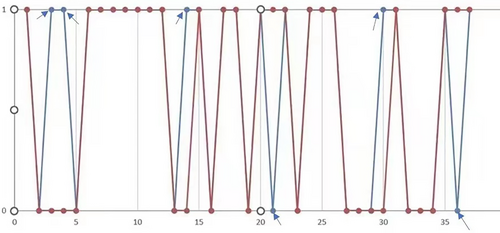
We compared the training and test sets of the XGBboost model in terms of pathological results. In the training set, the prediction precision of positive and negative lymph node metastasis was 84.85% (28/33 cases) and 90.91% (50/55 cases), respectively. In the test set, the prediction precision of positive and negative lymph node metastasis was 85.71% (12/14 cases) and 83.33% (20/24 cases), respectively. The classification efficiency of the model was evaluated using a confusion matrix (Figure 1). The diagnostic performance of the XGBoost model was excellent, and except for six samples, it made accurate predictions in the other samples (Figure 2).
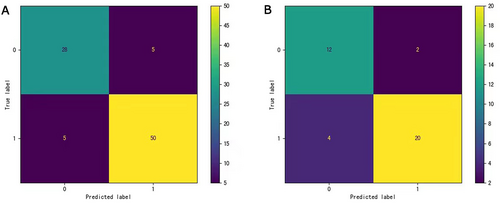
In the XGBoost model, the total accuracy of the train and test sets was 88.63 and 84.21%, respectively. In the training set, the F1 values for positive and negative lymph node metastases were 0.85 and 0.91, respectively. In the test set, the F1 values for positive and negative lymph node metastases were 0.80 and 0.87, respectively. The AUC values of the ROC curve of the train and test sets were 0.92 and 0.82, respectively (Table 5).
| Train Set | Test Set | |||||||||
|---|---|---|---|---|---|---|---|---|---|---|
| Cases | Accuracy | Recall Value | F1 Value | AUC | Cases | Accuracy | Recall Value | F1 Value | AUC | |
| Positive | 33 | 0.85 | 0.85 | 0.85 | 0.92 | 14 | 0.75 | 0.86 | 0.80 | 0.82 |
| Negative | 55 | 0.91 | 0.91 | 0.91 | 24 | 0.91 | 0.83 | 0.87 | ||
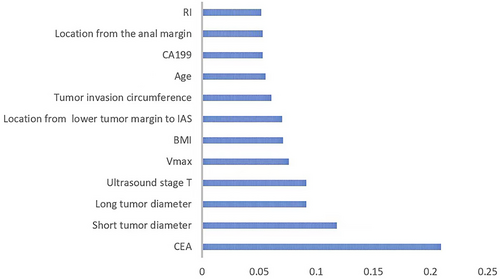
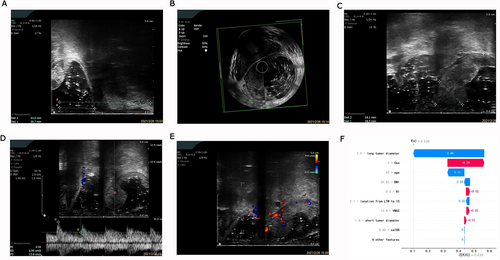
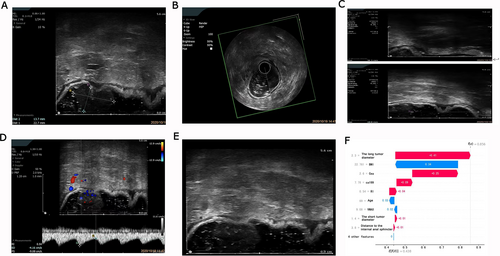
We used the importance score to visualize the performance of the XGBoost prediction model (Supplemental Table 2). The importance score for CEA, tumor breadth, tumor length, ultrasound stage T, Vmax, BMI, the location from the lower tumor margin to the upper internal anal sphincter, circumferential extent of the tumor, age, CA199, location from the anal margin, and RI was 0.2092, 0.1179, 0.0910, 2510.0910, 0.0758, 0.0709, 0.0701, 0.0607, 0.0556, 0.0531, and 0.0528, respectively, while the importance score for gender was 0. The bar graph (Figure 3) shows the predictive utility of each variable for lymph node metastasis in the algorithm application process. We found that CEA, tumor breadth, tumor length, and ultrasound staging had a greater impact on the diagnosis of lymph node metastasis in the XGBoost model. Figures 4 and 5 show two examples of correctly predicted lymph node metastasis and no metastasis, respectively. The waterfall plots (Figures 4F and 5F) demonstrate each variable's positive and negative effects on the predicted outcome in a single case. E[f(x)] represents the basic prediction probability of the XGBoost model, and f(x) represents the final prediction probability of the model.
The AUC value of the test set was 0.8214, while the corresponding value of radiologist A was 0.599, which indicated the diagnosis performance of the XGBoost model was better than that of radiologist A (Figure 6).
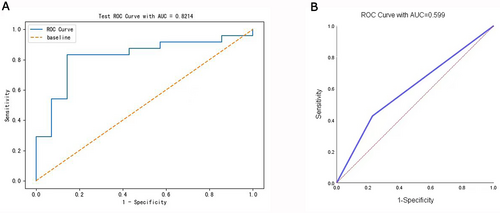
The accuracy, sensitivity, specificity, positive predictive value, and negative prediction value of the XGBoost model were 84.21, 75.00, 90.91, 85.71, and 83.33%, respectively. The accuracy, sensitivity, specificity, positive predictive value, and negative prediction value of 3D-ERUS alone were 65.87, 42.55, 79.75, 55.56, and 70.00%, respectively. This indicated that our XGBoost model had good performance compared with radiologist A (Table 6).
| AUC | Accuracy | Sensitivity | Specificity | Positive Prediction | Negative Prediction | |
|---|---|---|---|---|---|---|
| XGboost | 0.8214 | 0.8421 | 0.7500 | 0.9091 | 0.8571 | 0.8333 |
| Radiologist A | 0.5990 | 0.6587 | 0.4255 | 0.7975 | 0.5556 | 0.7000 |
Discussion
Here we report on an XGBoost model for preoperative prediction of lymph node metastasis in patients with rectal cancer based on 3D-ERUS and related clinical information.
A study showed that the sensitivity and specificity of ERUS were 57 and 80%, respectively, while the values of CT were 79 and 76%.9 The 3D-ERUS can automatically capture and store high-resolution images of the rectal wall and cancer.19-21 Thus, we used 3D-ERUS to evaluate lymph node metastasis. Compared with pathological examination, the sensitivity, specificity, and precision of ERUS were 42.55, 79.75, and 65.87%, respectively, which is consistent with previous reports.22
An earlier study on predicting lymph node metastasis in rectal cancer mostly used both radiomics models and deep learning. Radiomics based on advanced pattern recognition tools has been found useful in extracting a large number of quantitative features from medical images. It can provide more metabolic and biological information than conventional imaging methods.23 In a previous study, the least absolute shrinkage and selection operator (LASSO) regression model was constructed, which used feature selection based on the shear-wave elastography (SWE) ultrasomics signature of 87 patients.24 The results of the study indicated the diagnostic accuracy, sensitivity, specificity, positive predictive value (PPV), and negative predictive value (NPV) of the SWE ultrasomics signature were 82.8, 87.5, 78.8, 77.8, and 88.1%, respectively, while those of MRI were 75.9, 77.5, 74.5, 72.1, and 79.6%, respectively. A study created a radiomics nomogram based on T2-weighted imaging (T2WI) of 162 patients with rectal cancer, and this demonstrated good discrimination with an AUC of 0.937 for the training cohort and 0.884 for the validation cohort.25 However, these were limited in that they used CT and MRI imaging, which mostly focused on the technical aspects of the algorithm and did not include clinical information such as age and tumor site. In our study, we found the XGBoost model based on the combined information, when compared with 3D-ERUS alone, showed better precision than radiologist A.
Machine learning has been widely used in healthcare. However, due to complex nonlinear relationships and unexplainable model results, some ML algorithms are difficult to interpret, resulting in a “black-box” problem that limits the clinical application of predictive models. In our study, we visualized the results of the ML algorithms and interpreted them by using Matplotlib and Seaborn. Matplotlib is an extended drawing library widely used in Python. It can generate high-quality graphics in a cross-platform interactive environment and quickly generate visual charts such as scatter charts, line charts, bar charts, grid graphs, and so on. Seaborn is an advanced visualization library based on Matplotlib.
Furthermore, different algorithms have different advantages. A study compared the predictive ability of logistic regression and some ML algorithms26 and showed that the predictive ability of logistic regression was equally excellent. In our study, we found that the XGBoost algorithm was the best. We verified its prediction performance in comparison with other algorithms. XGBoost is a classification algorithm that allows the combination of several weak learning algorithms into a single strong learning algorithm with high performance.27 The XGBoost prediction model has been extensively used to predict acute myocardial infarction28, 29 and preoperative microsatellite instability in rectal cancer.30, 31 In our study, the XGBoost model demonstrated a reliable preoperative prediction of lymph node metastasis in patients with rectal cancer.
In our study, there were significant differences between groups in tumor size (tumor length and tumor breadth), RI, periluminal diameter of invasion, and ultrasound T staging. Specifically, the risk of lymph node metastasis was positively correlated with tumor size, tumor RI, periluminal diameter of the invaded intestine, and ultrasound T stage. With regard to the predictive utility of specific parameters for lymph node metastasis, tumor RI and tumor length were the most important variables affecting lymph node metastasis. Consequently, the in situ status of the rectal tumor could influence the lymph node metastasis. Tumor RI may be related to neovascularization. Tumor RI was positively correlated with tumor invasiveness,32 with a large tumor size contributing to poor tumor morphology, increasing the likelihood of lymph node metastasis.
Serum CEA levels have shown prognostic value in colorectal cancer.33 Specifically, high levels of CEA before surgery were associated with a poor prognosis for rectal cancer.34 In our study, there was a significant between-group difference in serum CEA levels. In addition, CEA and CA199 showed high-importance scores in the model. Single indicators may be inadequate to inform individualized treatment; instead, it is important to comprehensively analyze patient information and identify influencing factors that can improve diagnostic accuracy.
This preliminary study established a prediction model based on 3D ultrasound examination, which showed significantly better prediction accuracy with simple data acquisition and modeling methods. Ultrasound is cheaper than MRI and CT and, additionally, involves less psychological discomfort and radiation exposure when compared with MRI and CT, respectively.
There are limitations to this study. First, this was a small-scale single-center retrospective study, and the findings need to be validated by further multicenter prospective studies. Second, some cases were eliminated due to the quality of the ultrasound images, which reduced the size of the sample. Future large-scale, multicenter cohort studies are warranted to validate our findings. Furthermore, future research should also consider an extensive analysis of image texture information, other imaging information (e.g., CT and MRI), and genetic factors when developing a model.
In conclusion, the XGBoost algorithm that we developed demonstrated significantly better preoperative prediction value in lymph node metastasis in patients with rectal cancer, and this can be helpful in determining clinical treatment strategies.
Open Research
Data Availability Statement
The data that support the findings of this study are available from the corresponding author upon reasonable request.


