Fetal Micro and Macroglossia
Defining Normal Fetal Tongue Size
All of the authors of this article have reported no disclosures.
Natalie Koren and Shir Shust-Barequet contributed equally to this study.
Abstract
Objectives
Abnormal fetal tongue size is a phenotypic feature of various syndromes including Beckwith-Wiedemann, Pierre-Robin, oromandibular limb hypoplasia, chromosomal aberrations, etc. Current data regarding normal fetal tongue size are limited. Hence, micro/macroglossia are subjectively determined. The aim of the study was to construct a contemporary fetal tongue nomogram and to assess its clinical contribution.
Methods
A prospective cross-sectional study was performed in well dated, low risk, singleton pregnancies. Fetal tongues were measured by 5 trained sonographers. Highest quality images were selected. Intra- and interobserver variability was assessed. Tongue length, width, area, and circumference 1st to 99th centiles were calculated for each gestational week. Based on the normal tongue size charts, we created a Tongue Centile Calculator.
Results
Over 18 months, 664 tongue measurements were performed. A cubic polynomial regression model best described the correlation between tongue size and gestational age. The correlation coefficient (r2) was 0.934, 0.932, 0.925, and 0.953 for tongue length, width, area, and circumference, respectively (P < .001). Intra- and interobserver variability had high interclass correlation coefficients (>0.9). Using the new charts, we were able to identify 2 cases of macroglossia, subsequently diagnosed with Beckwith-Wiedemann, and 4 cases of microglossia, 3 associated with Pierre-Robin sequence, and 1 associated with persistent buccopharyngeal membrane.
Conclusions
We present novel fetal tongue size charts from 13 to 40 weeks of gestation. Clinical application of these nomograms may be beneficial in the prenatal diagnosis of syndromes or malformations associated with abnormal fetal tongue size.
Abbreviations
-
- BPM
-
- buccopgharyngeal membrane
-
- CI
-
- confidence interval
-
- CMA
-
- chromosomal microarray analysis
-
- CRL
-
- crown-rump length
-
- ICC
-
- interclass correlation
-
- GA
-
- gestational age
-
- N/A
-
- not applicable
-
- NICU
-
- neonatal intensive care unit
-
- NVD
-
- normal vaginal delivery
-
- OP
-
- oropharynx
-
- PLSVC
-
- persistent left superior vena cava
-
- SD
-
- standard deviation
-
- VSD
-
- ventricular septal defect
Introduction
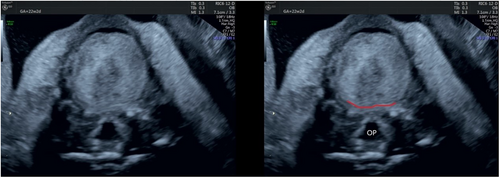
Tongue development begins during the fourth week of gestation as two lateral and one medial lingual swellings, originating from the first branchial arch, overgrow and merge to form the body of the tongue. The posterior third of the tongue, termed the root of the tongue, originates from the second, third, and part of the fourth pharyngeal arch. The body and root of the tongue are separated by a groove termed “terminal sulcus”1, 2 (Figure 1). Throughout pregnancy, the tongue continuously increases in size.3-7
Abnormal fetal tongue size is a phenotypic feature of various significant congenital syndromes and conditions including Down syndrome, Beckwith-Wiedemann Syndrome, Pierre-Robin Sequence, Simpson-Golabi, Oromandibular Limb Hypoplasia, mucopolysaccharidoses, chromosomal abnormalities, and more.1, 3, 5, 8-24 Tongue anomalies may present as an isolated finding9, 10, 15 and, occasionally, it may be the only presenting prenatal feature of a genetic syndrome.3, 10, 16
Despite the importance of accurate tongue measurement, a comprehensive fetal tongue growth curve throughout pregnancy, has not yet been published. Therefore, macroglossia and microglossia continue to be perceived subjectively.13, 21, 23, 25 Only 2 previous prenatal studies have established fetal tongue nomograms but only up through 26 weeks of gestation.3, 5 Since then, improved resolution has enabled a more precise measurement by demonstrating the fine posterior border of the body of the tongue, the terminal sulcus (Figure 1), which was not previously discernable.5
The aims of this study were 1) to construct a normal modeled reference interval charts of fetal tongue dimensions (length, width, circumference, and area) between 13 and 40 weeks of gestation and 2) to prospectively examine the clinical value of tongue measurement in suspected or confirmed pathologic cases using the new tongue reference charts.
Materials and Methods
A cross-sectional prospective study was conducted between 13 and 40 weeks of gestation at the Chaim Sheba Obstetric Ultrasound Unit. Inclusion criteria included singleton pregnancies, accurate pregnancy dating using first trimester crown-rump length (CRL) or a history of regular menses, and an estimated fetal weight within the normal range (10–90 centiles). Exclusion criteria included fetal malformations, genetic aberrations, maternal and/or placental conditions known to affect fetal growth. Measurements were taken by five examiners (EK, VY, EH, LA, and TW. A commercially available, Voluson E10 Expert machines (GE Medical Systems, Kretz Ultrasound, Zipf, Austria) equipped with an abdominal 2 to 6 MHz convex probe and a vaginal 6 to 12 MHz probe. A vaginal approach was used between 13 and 15 weeks of gestation. During 16 and 18 weeks of gestation both approaches were used, depending on fetal lie and transabdominal resolution. An abdominal approach was used from 19 to 40 weeks.
In order to obtain a standardized image, 3 basic requirements should be met: 1) an axial, antero-posterior plane at the level of the tongue, just above the mandible and just below the maxilla; 2) a neutral tongue position; and 3) clear tongue margins (Figure 1). To reach the appropriate plane, a mid-sagittal plane of the fetal profile is acquired. The fetal neck should be in a neutral position with the ultrasound beam perpendicular to the long axis of the fetal face. From this mid-sagittal plane, the transducer is rotated 90° to acquire an axial image of the fetal tongue. The transducer is gently tilted cranially and caudally until a clear image of the fetal tongue positioned between the maxillary alveolar ridge and the mandibular alveolar ridge is obtained.
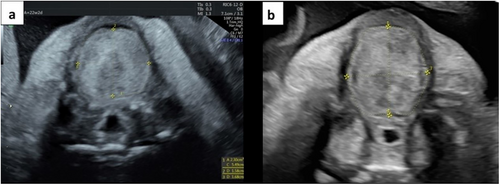
The anterior and lateral tongue boundaries were defined by the free margins of the tongue and the posterior boundary was set at the terminal sulcus, a naturally occurring fold separating the body and the base of the tongue.6 After image acquisition, 4 measurements were performed in real-time: the antero-posterior diameter (tongue length), the transverse diameter (tongue width), and a free-hand trace measurement of tongue circumference, with a formula-calculated tongue area routinely provided by the ultrasound machine (Figure 2).
Tongue length, width, area, and circumference 1st to 99th centiles were calculated for each gestational week. Based on the normal tongue size charts, we created a Tongue Centile Calculator (online supplemental Appendix S1).
We performed an additional pilot study to assess the reproducibility of the tongue measurements. Sixty fetuses between 14 and 37 weeks were assessed for intra-observer variability and 30 for inter-observer variability. Intra/interobserver variability were calculated and presented using the Bland–Altman formula and plot.26
The study protocol was approved by the institutional ethics committee (5344-18-SMC). All participating patients were informed and consented.
Statistical Analysis
Statistical analyses were performed using SPSS statistical package version 20 for Windows (IBM SPSS, I, New York, NY), and Microsoft Excel 2016 software (Microsoft Corp, Richmond, CA). All tests were 2 tailed and a P value of <.05 was considered statistically significant.
The intra- and interobserver variability was assessed by calculating interclass correlation (ICC) between the 2 groups of measurements. For assessing agreement between the 2 measurements, we used the Bland–Altman plot's limits of agreement ±1.96 standard deviation (SD).26 Moreover, the mean absolute and as percentage difference was calculated.
The statistical analysis used to calculate the modeled centiles, and SD, was based on the method described previously. After assessment of normal distribution using the Shapiro–Wilk test, fitted mean and SD were calculated using the regression models as functions of gestational age (GA), of the raw data (y = a + b*GA + b1*GA2 + b2*GA3). The r2 statistic were studied to assess the best quality of fit. After aggregation of the raw data per week of gestation, the mean and SD were calculated, and the predicted values were estimated according to the best fitted regression equation.
The modeled centiles for a given GA, were calculate by using CentileGA = meanGA + K*SDGA, where K is the corresponding centile of the Gaussian distribution (for example, determination of the 10th and 90th centiles requires K = ±1.28; determination of the 5th and 95th centiles requires K = ±1.645, etc.), and mean and SD are the predicted values obtained from modeling the original raw data for each week. An additional Z score for assessing model fit was measured by the following formula: Z score = (YGA – MGA)/SDGA. In this formula, YGA is the measured value at a known GA, MGA is the mean predicted value, and SD is the standard deviation associated with the predicted value at this GA. Normal distribution of the Z scores, using the Shapiro–Wilk W test was calculated as well.27
Results
Six hundred and sixty-four measurements were performed in a population of low-risk pregnancies over 18 months. All cases met our strict inclusion criteria of an uncomplicated pregnancy and a standardized image of the tongue was successfully obtained.
Intra and Interobserver Variability
A high (above 0.9) ICC was achieved for all the four measured parameters, indicating an excellent correlation between the two groups of measurement (Table 1). The mean absolute and percentage differences were low (less than 5%) for all, except tongue area, which was a slightly higher than the acceptable 10% in the intra observer group (Tables 2 and 3). The agreement between 2 measurements is presented by the Bland–Altman plot. Approximately 95% of measurements were in the limits of agreement (±1.96 SD) as suggested by Bland and Altman to represent a good achievement (online supplemental Figures S1–S4 for the intra observer variability and online supplemental Figures S5–S8 for the intra observer variability).
| Interobserver | Intraobserver | |
|---|---|---|
| Tongue length | 0.993 (0.981–0.997) | 0.980 (0.967–0.988) |
| Tongue width | 0.986 (0.965–0.995) | 0.975 (0.959–0.985) |
| Tongue area | 0.995 (0.988–.998) | 0.978 (0.963–0.986) |
| Tongue circumference | 0.997 (0.992–0.999) | 0.982 (0.971–0.989) |
| Mean ± SD | 5–95% CI | Percentage ± SD | 95–5% CI | |
|---|---|---|---|---|
| Tongue length | 0.78 ± 0.87 | 0.45–1.10 | 0.78 ± 0.87 | 0.87–1.10 |
| Tongue width | 0.91 ± 0.78 | 0.61–1.20 | 4.76 ± 3.91 | 3.28–6.25 |
| Tongue area | 22.36 ± 26.73 | 12.19–32.53 | 5.44 ± 5.30 | 3.42–7.46 |
| Tongue circumference | 1.94 ± 1.62 | 1.33–2.56 | 2.55 ± 0.47 | 1.93–3.87 |
- CI, confidence interval; SD, standard deviation.
| Mean ± SD | 5–95% CI | Percentage ± SD | 95–5% CI | |
|---|---|---|---|---|
| Tongue length | 0.78 ± 0.87 | 0.87–1.10 | 3.02 ± 2.87 | 1.92–4.11 |
| Tongue width | 0.91 ± 0.78 | 0.61–1.20 | 4.76 ± 3.91 | 3.28–6.25 |
| Tongue area | 47.08 ± 45.34 | 35.37–58.79 | 11.08 ± 8.85 | 8.79–13.36 |
| Tongue circumference | 1.94 ± 1.62 | 1.33–2.56 | 2.90 ± 2.55 | 1.93–3.87 |
- CI, confidence interval; SD, standard deviation.
The Nomograms
The raw tongue data were best correlated with GA by a cubic polynomial regression formula (online supplemental Table S1). The correlation coefficient (r2) was 0.934, 0.932, 0.925, and 0.953 for the tongue length, width, area, and circumference, (P < .001), respectively (Figures 3-6). After aggregation of the mean and the SD for each week, they were best fitted according to a cubic polynomial regression formula (online supplemental Table S1).
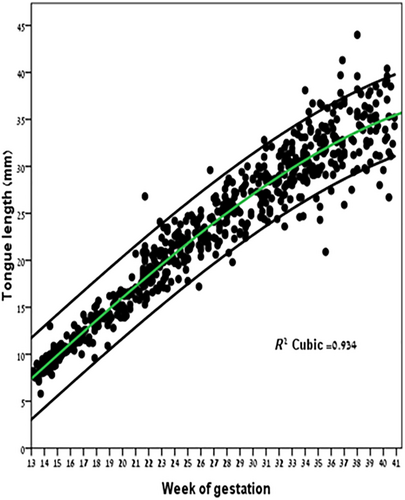
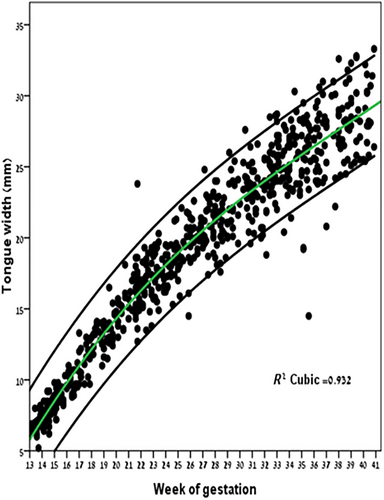
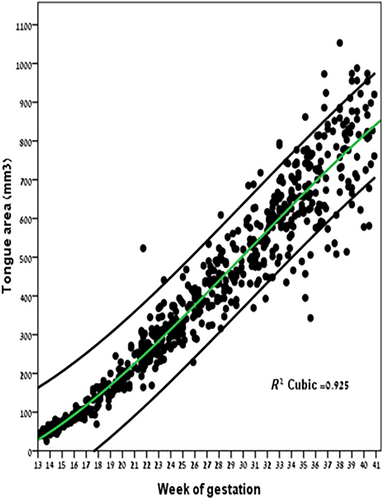
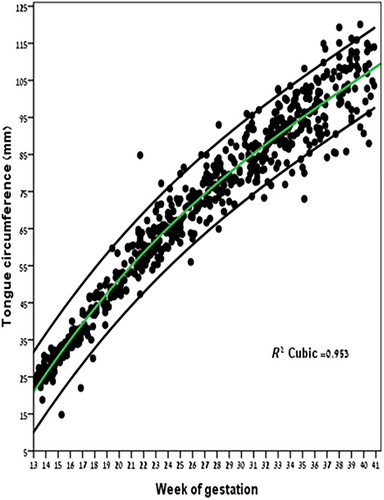
Tables 4–7 provide the predicted tongue length, width, area, and circumference 1st, 3rd, 10th, 25th, 75th, 90th, 95th, 97th, and 99th centiles for GA between 13 and 40 weeks of gestation. The mean absolute Z score between measured and predicted values was 0.1875 ± 0.146 SD, 0.208 ± 0.161 SD, 0.208 ± 0.265 SD, and 0.224 ± 0.194 SD for the tongue length, width, area, and circumference, respectively, close to the theoretical value of 0. The Shapiro–Wilk test indicated a normal distribution with P values of .998, .384, .978, and .494, respectively.
| Weeks | N | 1st | 3rd | 5th | 10th | 25th | 50th | 75th | 90th | 95th | 97th | 99th |
|---|---|---|---|---|---|---|---|---|---|---|---|---|
| 13 | 23 | 6.5 | 6.8 | 6.9 | 7.2 | 7.6 | 8.0 | 8.4 | 8.8 | 9.0 | 9.2 | 9.5 |
| 14 | 40 | 7.4 | 7.8 | 8.0 | 8.2 | 8.7 | 9.2 | 9.7 | 10.2 | 10.5 | 10.7 | 11.0 |
| 15 | 24 | 8.4 | 8.8 | 9.0 | 9.3 | 9.8 | 10.4 | 11.0 | 11.6 | 11.9 | 12.1 | 12.5 |
| 16 | 22 | 9.3 | 9.8 | 10.0 | 10.4 | 11.0 | 11.7 | 12.3 | 12.9 | 13.3 | 13.6 | 14.0 |
| 17 | 20 | 10.3 | 10.8 | 11.0 | 11.4 | 12.1 | 12.9 | 13.6 | 14.3 | 14.7 | 15.0 | 15.5 |
| 18 | 17 | 11.2 | 11.8 | 12.1 | 12.5 | 13.3 | 14.1 | 14.9 | 15.6 | 16.1 | 16.4 | 16.9 |
| 19 | 19 | 12.2 | 12.8 | 13.1 | 13.6 | 14.4 | 15.3 | 16.2 | 17.0 | 17.5 | 17.8 | 18.4 |
| 20 | 16 | 13.1 | 13.7 | 14.1 | 14.7 | 15.5 | 16.5 | 17.4 | 18.3 | 18.8 | 19.3 | 19.8 |
| 21 | 34 | 14.0 | 14.7 | 15.2 | 15.7 | 16.6 | 17.7 | 18.7 | 19.6 | 20.1 | 20.6 | 21.2 |
| 22 | 29 | 15.0 | 15.7 | 16.2 | 16.8 | 17.7 | 18.8 | 19.9 | 20.9 | 21.5 | 22.0 | 22.6 |
| 23 | 24 | 15.9 | 16.7 | 17.2 | 17.8 | 18.8 | 20.0 | 21.1 | 22.1 | 22.7 | 23.3 | 23.9 |
| 24 | 26 | 16.8 | 17.6 | 18.2 | 18.8 | 19.9 | 21.1 | 22.3 | 23.4 | 24.0 | 24.6 | 25.3 |
| 25 | 21 | 17.7 | 18.6 | 19.1 | 19.8 | 20.9 | 22.2 | 23.5 | 24.6 | 25.3 | 25.9 | 26.6 |
| 26 | 23 | 18.6 | 19.5 | 20.1 | 20.8 | 22.0 | 23.3 | 24.6 | 25.8 | 26.5 | 27.1 | 27.9 |
| 27 | 26 | 19.4 | 20.4 | 21.0 | 21.7 | 23.0 | 24.4 | 25.7 | 27.0 | 27.7 | 28.4 | 29.1 |
| 28 | 25 | 20.3 | 21.2 | 21.9 | 22.7 | 24.0 | 25.4 | 26.8 | 28.1 | 28.9 | 29.6 | 30.4 |
| 29 | 19 | 21.0 | 22.0 | 22.7 | 23.5 | 24.9 | 26.4 | 27.9 | 29.3 | 30.1 | 30.8 | 31.6 |
| 30 | 21 | 21.8 | 22.8 | 23.5 | 24.4 | 25.8 | 27.4 | 28.9 | 30.4 | 31.2 | 31.9 | 32.8 |
| 31 | 24 | 22.5 | 23.6 | 24.3 | 25.2 | 26.7 | 28.3 | 29.9 | 31.4 | 32.3 | 33.1 | 34.0 |
| 32 | 28 | 23.1 | 24.3 | 25.1 | 26.0 | 27.5 | 29.2 | 30.9 | 32.5 | 33.4 | 34.2 | 35.2 |
| 33 | 31 | 23.7 | 24.9 | 25.7 | 26.7 | 28.3 | 30.1 | 31.9 | 33.5 | 34.4 | 35.3 | 36.3 |
| 34 | 27 | 24.3 | 25.5 | 26.4 | 27.4 | 29.1 | 30.9 | 32.8 | 34.5 | 35.5 | 36.3 | 37.4 |
| 35 | 27 | 24.7 | 26.0 | 26.9 | 28.0 | 29.8 | 31.7 | 33.7 | 35.4 | 36.5 | 37.4 | 38.5 |
| 36 | 29 | 25.1 | 26.5 | 27.5 | 28.6 | 30.4 | 32.5 | 34.5 | 36.3 | 37.4 | 38.4 | 39.6 |
| 37 | 11 | 25.5 | 26.9 | 27.9 | 29.1 | 31.0 | 33.1 | 35.3 | 37.2 | 38.4 | 39.4 | 40.6 |
| 38 | 23 | 25.8 | 27.3 | 28.3 | 29.5 | 31.6 | 33.8 | 36.0 | 38.1 | 39.3 | 40.3 | 41.6 |
| 39 | 18 | 26.0 | 27.5 | 28.6 | 29.9 | 32.0 | 34.4 | 36.8 | 38.9 | 40.2 | 41.3 | 42.6 |
| 40 | 17 | 26.1 | 27.7 | 28.9 | 30.2 | 32.5 | 34.9 | 37.4 | 39.7 | 41.0 | 42.2 | 43.6 |
| Weeks | N | 1st | 3rd | 5th | 10th | 25th | 50th | 75th | 90th | 95th | 97th | 99th |
|---|---|---|---|---|---|---|---|---|---|---|---|---|
| 13 | 23 | 4.9 | 5.2 | 5.4 | 5.6 | 6.0 | 6.5 | 7.0 | 7.4 | 7.6 | 7.8 | 8.1 |
| 14 | 40 | 6.1 | 6.4 | 6.6 | 6.9 | 7.3 | 7.8 | 8.4 | 8.8 | 9.1 | 9.3 | 9.6 |
| 15 | 24 | 7.1 | 7.5 | 7.7 | 8.0 | 8.5 | 9.1 | 9.7 | 10.2 | 10.5 | 10.7 | 11.1 |
| 16 | 22 | 8.2 | 8.6 | 8.8 | 9.2 | 9.7 | 10.3 | 11.0 | 11.5 | 11.9 | 12.1 | 12.5 |
| 17 | 20 | 9.2 | 9.6 | 9.9 | 10.2 | 10.8 | 11.5 | 12.2 | 12.8 | 13.2 | 13.4 | 13.9 |
| 18 | 17 | 10.1 | 10.6 | 10.8 | 11.2 | 11.9 | 12.6 | 13.4 | 14.0 | 14.4 | 14.7 | 15.2 |
| 19 | 19 | 11.0 | 11.5 | 11.8 | 12.2 | 12.9 | 13.7 | 14.5 | 15.2 | 15.6 | 15.9 | 16.4 |
| 20 | 16 | 11.7 | 12.3 | 12.7 | 13.1 | 13.9 | 14.7 | 15.6 | 16.3 | 16.8 | 17.1 | 17.6 |
| 21 | 34 | 12.5 | 13.1 | 13.5 | 14.0 | 14.8 | 15.7 | 16.6 | 17.4 | 17.9 | 18.3 | 18.8 |
| 22 | 29 | 13.3 | 13.9 | 14.4 | 14.9 | 15.7 | 16.6 | 17.6 | 18.4 | 18.9 | 19.4 | 19.9 |
| 23 | 24 | 14.0 | 14.7 | 15.1 | 15.7 | 16.6 | 17.5 | 18.5 | 19.4 | 19.9 | 20.4 | 21.0 |
| 24 | 26 | 14.7 | 15.4 | 15.9 | 16.4 | 17.4 | 18.4 | 19.4 | 20.4 | 20.9 | 21.4 | 22.0 |
| 25 | 21 | 15.4 | 16.1 | 16.6 | 17.2 | 18.2 | 19.2 | 20.3 | 21.3 | 21.9 | 22.4 | 23.0 |
| 26 | 23 | 16.0 | 16.7 | 17.3 | 17.9 | 18.9 | 20.0 | 21.2 | 22.2 | 22.8 | 23.3 | 24.0 |
| 27 | 26 | 16.6 | 17.4 | 17.9 | 18.6 | 19.6 | 20.8 | 22.0 | 23.0 | 23.7 | 24.2 | 24.9 |
| 28 | 25 | 17.1 | 18.0 | 18.5 | 19.2 | 20.3 | 21.5 | 22.8 | 23.9 | 24.5 | 25.1 | 25.8 |
| 29 | 19 | 17.7 | 18.5 | 19.1 | 19.8 | 21.0 | 22.2 | 23.5 | 24.7 | 25.4 | 25.9 | 26.7 |
| 30 | 21 | 18.2 | 19.1 | 19.7 | 20.4 | 21.6 | 22.9 | 24.2 | 25.4 | 26.2 | 26.8 | 27.5 |
| 31 | 24 | 18.7 | 19.6 | 20.2 | 21.0 | 22.2 | 23.6 | 25.0 | 26.2 | 26.9 | 27.6 | 28.4 |
| 32 | 28 | 19.1 | 20.1 | 20.8 | 21.5 | 22.8 | 24.2 | 25.7 | 26.9 | 27.7 | 28.4 | 29.2 |
| 33 | 31 | 19.6 | 20.6 | 21.3 | 22.1 | 23.4 | 24.9 | 26.3 | 27.7 | 28.4 | 29.1 | 30.0 |
| 34 | 27 | 20.0 | 21.1 | 21.8 | 22.6 | 23.9 | 25.5 | 27.0 | 28.4 | 29.2 | 29.9 | 30.7 |
| 35 | 27 | 20.5 | 21.5 | 22.2 | 23.1 | 24.5 | 26.1 | 27.6 | 29.0 | 29.9 | 30.6 | 31.5 |
| 36 | 29 | 20.9 | 22.0 | 22.7 | 23.6 | 25.0 | 26.7 | 28.3 | 29.7 | 30.6 | 31.4 | 32.3 |
| 37 | 11 | 21.3 | 22.4 | 23.2 | 24.1 | 25.6 | 27.2 | 28.9 | 30.4 | 31.3 | 32.1 | 33.0 |
| 38 | 23 | 21.7 | 22.8 | 23.6 | 24.5 | 26.1 | 27.8 | 29.5 | 31.1 | 32.0 | 32.8 | 33.8 |
| 39 | 18 | 22.1 | 23.2 | 24.1 | 25.0 | 26.6 | 28.4 | 30.1 | 31.7 | 32.7 | 33.5 | 34.5 |
| 40 | 17 | 22.4 | 23.7 | 24.5 | 25.5 | 27.1 | 28.9 | 30.8 | 32.4 | 33.4 | 34.2 | 35.3 |
| Week | N | 1st | 3rd | 5th | 10th | 25th | 50th | 75th | 90th | 95th | 97th | 99th |
|---|---|---|---|---|---|---|---|---|---|---|---|---|
| 13 | 23 | 17.0 | 18.2 | 18.8 | 19.8 | 21.5 | 23.3 | 25.1 | 26.8 | 27.8 | 28.4 | 29.7 |
| 14 | 40 | 21.0 | 22.4 | 23.1 | 24.2 | 26.0 | 28.0 | 30.0 | 31.9 | 33.0 | 33.7 | 35.0 |
| 15 | 23 | 25.0 | 26.4 | 27.2 | 28.4 | 30.4 | 32.6 | 34.7 | 36.7 | 37.9 | 38.7 | 40.2 |
| 16 | 22 | 28.8 | 30.4 | 31.2 | 32.5 | 34.6 | 36.9 | 39.3 | 41.4 | 42.6 | 43.5 | 45.1 |
| 17 | 19 | 32.5 | 34.2 | 35.1 | 36.4 | 38.6 | 41.1 | 43.6 | 45.8 | 47.2 | 48.1 | 49.8 |
| 18 | 17 | 36.2 | 37.9 | 38.8 | 40.2 | 42.6 | 45.2 | 47.8 | 50.1 | 51.5 | 52.4 | 54.2 |
| 19 | 19 | 39.6 | 41.4 | 42.4 | 43.9 | 46.3 | 49.0 | 51.8 | 54.2 | 55.7 | 56.6 | 58.5 |
| 20 | 16 | 42.7 | 44.6 | 45.9 | 47.4 | 50.0 | 52.8 | 55.6 | 58.2 | 59.7 | 61.0 | 62.6 |
| 21 | 33 | 45.9 | 47.9 | 49.2 | 50.8 | 53.5 | 56.4 | 59.3 | 62.0 | 63.5 | 64.9 | 66.6 |
| 22 | 27 | 49.0 | 51.1 | 52.5 | 54.1 | 56.8 | 59.8 | 62.9 | 65.6 | 67.2 | 68.6 | 70.4 |
| 23 | 24 | 52.0 | 54.1 | 55.6 | 57.3 | 60.1 | 63.2 | 66.3 | 69.1 | 70.8 | 72.3 | 74.0 |
| 24 | 26 | 54.9 | 57.1 | 58.6 | 60.3 | 63.2 | 66.4 | 69.6 | 72.5 | 74.2 | 75.7 | 77.6 |
| 25 | 21 | 57.7 | 59.9 | 61.4 | 63.2 | 66.2 | 69.5 | 72.8 | 75.8 | 77.6 | 79.1 | 81.0 |
| 26 | 23 | 60.3 | 62.6 | 64.2 | 66.0 | 69.1 | 72.5 | 75.9 | 79.0 | 80.8 | 82.4 | 84.3 |
| 27 | 26 | 62.9 | 65.2 | 66.8 | 68.7 | 71.9 | 75.4 | 78.9 | 82.0 | 83.9 | 85.6 | 87.5 |
| 28 | 23 | 65.3 | 67.7 | 69.4 | 71.3 | 74.6 | 78.2 | 81.8 | 85.0 | 87.0 | 88.7 | 90.7 |
| 29 | 18 | 67.6 | 70.1 | 71.8 | 73.8 | 77.2 | 80.9 | 84.6 | 88.0 | 90.0 | 91.7 | 93.8 |
| 30 | 21 | 69.7 | 72.3 | 74.1 | 76.2 | 79.7 | 83.5 | 87.4 | 90.8 | 92.9 | 94.7 | 96.9 |
| 31 | 24 | 71.8 | 74.5 | 76.3 | 78.5 | 82.1 | 86.1 | 90.1 | 93.7 | 95.8 | 97.7 | 99.9 |
| 32 | 28 | 73.7 | 76.5 | 78.4 | 80.7 | 84.4 | 88.6 | 92.7 | 96.4 | 98.7 | 100.6 | 103.0 |
| 33 | 31 | 75.5 | 78.4 | 80.4 | 82.8 | 86.6 | 91.0 | 95.3 | 99.2 | 101.5 | 103.5 | 106.0 |
| 34 | 26 | 77.2 | 80.2 | 82.3 | 84.8 | 88.8 | 93.3 | 97.8 | 101.9 | 104.3 | 106.5 | 109.0 |
| 35 | 27 | 78.8 | 81.9 | 84.1 | 86.7 | 90.9 | 95.6 | 100.4 | 104.6 | 107.2 | 109.4 | 112.1 |
| 36 | 28 | 80.2 | 83.5 | 85.8 | 88.5 | 93.0 | 97.9 | 102.9 | 107.4 | 110.0 | 112.3 | 115.2 |
| 37 | 11 | 81.5 | 85.0 | 87.4 | 90.2 | 94.9 | 100.2 | 105.4 | 110.1 | 112.9 | 115.3 | 118.3 |
| 38 | 23 | 82.7 | 86.4 | 88.9 | 91.9 | 96.9 | 102.4 | 107.9 | 112.8 | 115.8 | 118.4 | 121.5 |
| 39 | 17 | 83.7 | 87.6 | 90.3 | 93.5 | 98.7 | 104.5 | 110.4 | 115.6 | 118.7 | 121.5 | 124.8 |
| 40 | 17 | 84.7 | 88.8 | 91.7 | 95.0 | 100.5 | 106.7 | 112.9 | 118.4 | 121.7 | 124.6 | 128.1 |
| Week | N | 1st | 3rd | 5th | 10th | 25th | 50th | 75th | 90th | 95th | 97th | 99th |
|---|---|---|---|---|---|---|---|---|---|---|---|---|
| 13 | 23 | 18.3 | 21.9 | 23.8 | 26.8 | 31.8 | 37.2 | 42.7 | 47.7 | 50.6 | 52.6 | 56.3 |
| 14 | 40 | 30.9 | 36.0 | 38.8 | 43.0 | 50.1 | 57.9 | 65.7 | 72.8 | 77.0 | 79.7 | 85.1 |
| 15 | 23 | 45.0 | 51.6 | 55.2 | 60.6 | 69.8 | 79.9 | 90.0 | 99.1 | 104.6 | 108.1 | 115.1 |
| 16 | 22 | 60.4 | 68.6 | 72.9 | 79.6 | 90.8 | 103.2 | 115.6 | 126.7 | 133.4 | 137.8 | 146.2 |
| 17 | 19 | 77.1 | 86.8 | 91.9 | 99.8 | 113.0 | 127.7 | 142.3 | 155.5 | 163.4 | 168.5 | 178.6 |
| 18 | 17 | 94.9 | 106.1 | 112.0 | 121.1 | 136.4 | 153.3 | 170.2 | 185.4 | 194.5 | 200.4 | 212.0 |
| 19 | 19 | 113.7 | 126.4 | 133.1 | 143.4 | 160.7 | 179.9 | 199.1 | 216.4 | 226.7 | 233.4 | 246.5 |
| 20 | 16 | 130.7 | 145.1 | 155.1 | 166.6 | 186.0 | 207.5 | 228.9 | 248.3 | 259.8 | 269.9 | 282.0 |
| 21 | 34 | 150.8 | 166.7 | 177.8 | 190.6 | 212.1 | 235.9 | 259.6 | 281.1 | 293.9 | 305.0 | 318.5 |
| 22 | 29 | 171.6 | 189.0 | 201.2 | 215.3 | 238.9 | 265.0 | 291.2 | 314.7 | 328.8 | 341.0 | 355.9 |
| 23 | 24 | 192.8 | 211.9 | 225.2 | 240.6 | 266.3 | 294.9 | 323.4 | 349.2 | 364.6 | 377.9 | 394.1 |
| 24 | 26 | 214.3 | 235.1 | 249.6 | 266.3 | 294.3 | 325.3 | 356.3 | 384.3 | 401.0 | 415.5 | 433.2 |
| 25 | 21 | 236.1 | 258.6 | 274.3 | 292.3 | 322.6 | 356.2 | 389.8 | 420.1 | 438.2 | 453.9 | 473.0 |
| 26 | 23 | 258.0 | 282.2 | 299.1 | 318.7 | 351.3 | 387.6 | 423.8 | 456.5 | 476.0 | 492.9 | 513.5 |
| 27 | 26 | 279.9 | 305.9 | 324.1 | 345.1 | 380.3 | 419.2 | 458.2 | 493.4 | 514.4 | 532.6 | 554.7 |
| 28 | 23 | 301.5 | 329.5 | 349.0 | 371.6 | 409.3 | 451.1 | 493.0 | 530.7 | 553.2 | 572.8 | 596.5 |
| 29 | 18 | 322.9 | 352.9 | 373.8 | 397.9 | 438.4 | 483.2 | 528.0 | 568.4 | 592.5 | 613.5 | 638.9 |
| 30 | 21 | 343.9 | 375.9 | 398.3 | 424.1 | 467.3 | 515.3 | 563.2 | 606.4 | 632.2 | 654.6 | 681.8 |
| 31 | 24 | 364.3 | 398.5 | 422.4 | 450.0 | 496.2 | 547.3 | 598.5 | 644.7 | 672.3 | 696.2 | 725.2 |
| 32 | 28 | 384.1 | 420.6 | 446.1 | 475.5 | 524.7 | 579.3 | 633.9 | 683.1 | 712.5 | 738.1 | 769.0 |
| 33 | 31 | 403.1 | 441.9 | 469.1 | 500.4 | 552.9 | 611.1 | 669.2 | 721.7 | 753.0 | 780.2 | 813.2 |
| 34 | 26 | 421.1 | 462.4 | 491.4 | 524.7 | 580.6 | 642.5 | 704.5 | 760.3 | 793.7 | 822.6 | 857.8 |
| 35 | 27 | 438.1 | 482.1 | 512.8 | 548.3 | 607.7 | 673.6 | 739.5 | 798.9 | 834.4 | 865.2 | 902.6 |
| 36 | 28 | 453.9 | 500.6 | 533.3 | 571.0 | 634.2 | 704.2 | 774.3 | 837.4 | 875.1 | 907.9 | 947.6 |
| 37 | 11 | 468.3 | 518.0 | 552.8 | 592.8 | 659.9 | 734.3 | 808.7 | 875.8 | 915.9 | 950.6 | 992.8 |
| 38 | 23 | 481.4 | 534.1 | 571.0 | 613.5 | 684.8 | 763.7 | 842.7 | 913.9 | 956.5 | 993.4 | 1038.2 |
| 39 | 17 | 492.8 | 548.8 | 587.9 | 633.1 | 708.6 | 792.4 | 876.2 | 951.8 | 996.9 | 1036.1 | 1083.7 |
| 40 | 17 | 502.6 | 561.9 | 603.4 | 651.3 | 731.5 | 820.3 | 909.2 | 989.3 | 1037.2 | 1078.7 | 1129.2 |
Pathological Cases
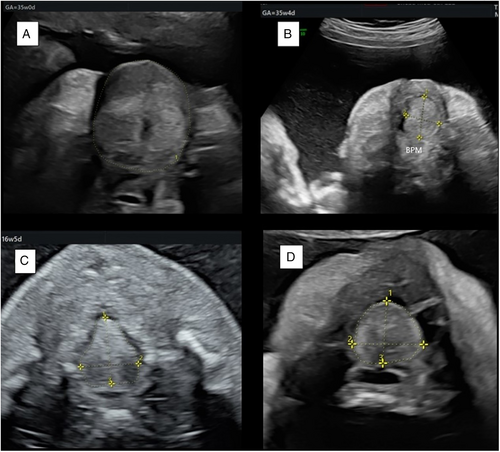
During the study period, using the nomograms, 2 cases of macroglossia and 4 cases of microglossia were detected (Table 8). Case 1 was referred for a targeted anomaly scan due to polyhydramnios at 35 weeks. A slightly protruding tongue was identified as an isolated finding and tongue measurements corresponded to the 97th centile (Figure 7A). An amniocentesis was performed with a normal microarray result. Subsequently, a whole exome sequencing was performed and a loss of methylation in locus KCNQ1OT1 was identified, establishing the diagnosis of Beckwith-Wiedemann syndrome. The pregnancy was continued, and the baby was born at 39 weeks weighing 3920 g (8.6 pounds), requiring no respiratory support.
| Patient (No.) | Gestational Age at Exam (Weeks) | EFW (g) | Circumference (mm) | Circumference (%) | Sonographic Findings | Genetic Findings | Prenatal Suspected Diagnosis | Perinatal Outcome | Postnatal/Postmortem Diagnosis |
|---|---|---|---|---|---|---|---|---|---|
| 1 | 35.5 | 2996 | 123 | 99 | Macroglossia Mild polyhydramnios Protruding tongue |
Normal WES and CMA Loss of methylation in KCNQ1OT1 |
Beckwith Wiedemann Syndrome |
Term delivery 3920 g |
Beckwith Wiedemann Syndrome |
| 2 | 36.1 | 2430 | 142 | >99% | Omphalocele Macroglossia Protruding tongue Large kidneys Mild polyhydramnios |
Normal WES and CMA Loss of methylation in KCNQ1OT1 |
Beckwith Wiedemann Syndrome | Cesarean Section 42 weeks 4300 g |
Beckwith Wiedemann Syndrome |
| 3 | 35.2 | 2297 | 57.5 | <1 | Severe polyhydramnios Suspected pharyngeal mass Small stomach Microglossia |
N/A | Upper airway obstruction | Term delivery 2800 g Early neonatal death |
Persistent buccopharyngeal membrane |
| 4 | 16.5 | 164 | 27.2 | <1 | Micrognathia Cleft hard palate Microglossia |
Normal CMA | Pierre Robin sequence | Termination of pregnancy | N/A |
| 5 | 22.5 | 461 | 48 | <1 | Cleft palate and uvula Retrognathia Microglossia Pelvic kidney Polydactyly PLSVC VSD Tethered cord |
3p deletion syndrome 15q12-q13.1 deletion | 3p deletion syndrome | Termination of pregnancy 24.3 weeks 504 g |
N/A |
| 6 | 32.3 | 1984 | 63.2 | <1 | Severe polyhydramnios Cleft palate Micrognathia Microglossia Duodenal atresia Hypertelorism |
1q24.2-q44 triplication | N/A | NVD 37.3 weeks 3120 g Ongoing NICU admission |
Cleft palate Micrognathia Microglossia Coloboma Hypertelorism Absence of gall bladder Duodenal atresia Intestinal malrotation |
- Macroglossia and microglossia defined as circumference ≥ 95% and ≤5%, respectively.
- CMA, chromosomal microarray analysis; EFW, estimated fetal weight; NVD, normal vaginal delivery; NICU, neonatal intensive care unit; N/A, not applicable; PLSVC, persistent left superior vena cava; VSD, ventricular septal defect; WES, Whole Exome Sequencing.
Case 2 was referred at 36 weeks due to an omphalocele that was detected at 32 weeks. A large omphalocele, large kidneys, and protruding tongue were observed. The tongue circumference measured 142 mm, well above the 99th centile on our circumference chart. Estimated fetal weight corresponded to 77th centile. After receiving consultation regarding suspected Beckwith-Wiedemann syndrome or possibly Down syndrome, the patient decided to continue pregnancy. At 42 weeks, a male baby was born weighing 4300 g (9.48 pounds), requiring no respiratory support. Surgical repair of omphalocele was performed at the age of 1 day. A postnatal genetic workup was performed and Beckwith-Wiedemann was confirmed by the detection of a loss of methylation in locus KCNQ1OT1.
Case 3 was referred at 35 weeks due to severe polyhydramnios (720 mm). Targeted scan detected microglossia (<1st centile), a suspected obstructed pharynx (Figure 7B) and a small stomach. The couple chose to continue the pregnancy. As compromised airway was anticipated, a multidisciplinary team was present in the delivery room, including a pediatric otolaryngologist team (ENT). Immediately after birth, the baby showed severe respiratory distress. Despite pediatric ENT preparation, multiple trials of intubation and tracheostomy were unsuccessful, due to an obstructive pharyngeal mass concealing the upper airway, and the baby died shortly after. Postmortem computerized tomography (CT) demonstrated a persistent buccopharyngeal membrane, a rare entity associated with other congenital anomalies including aglossia/microglossia, facial, cardiovascular, and skeletal anomalies.28, 29
Cases 4 and 5 both displayed features of Pierre-Robin Sequence with micro/retrognathia and cleft palate (Figure 7C). Case 4 had other multiple anomalies detected. Both were diagnosed with microglossia, below the first centile. In both cases, the patient chose to terminate the pregnancy, after an approval of a Supreme Termination of Pregnancy Committee, as the law in Israel requires. Postmortem autopsy was not performed, at patient discretion. A genetic investigation was performed in both cases. In case 4, microarray analysis detected 2 genetic abnormalities, 3p deletion syndrome (profound intellectual disability, autism, micrognathia, cleft palate, and facial dysmorphism)30 and 15q12-q13.1 deletion (albinism). Case 3 had a normal microarray, with no further genetic investigation.
Case 6 was referred due to polyhydramnios and double bubble. On targeted scan, multiple anomalies were detected including micrognathia, microglossia, cleft palate (Figure 7D). The patient declined genetic investigation prenatally. An appropriate for GA baby was born at term. He was admitted at neonatal intensive care unit (NICU) for duodenal atresia corrective surgery. All prenatally suspected malformations were confirmed, and a genetic investigation revealed a pathological triplication of 1q24.2-q44 region.
Discussion
Congenital tongue anomalies can be classified as growth abnormalities (macroglossia, microglossia/hypoglossia), positional abnormalities (glossoptosis), and lingual lesions. These conditions can cause chronic symptoms such speech impairment, feeding difficulties, respiratory difficulties, recurrent upper respiratory tract infections, and even life-threatening postnatal airway obstruction, in cases of significant macroglossia or glossoptosis, blocking the oropharynx.9, 10, 12, 14, 20, 23 Objective tongue measurement could assist distinguishing a truly pathologically sized tongue from a normal sized tongue erroneously judged abnormal. Currently, the size of the tongue is approximated in relation to structures in the oral cavity. If protruding beyond the lips, it is regarded as macroglossia.21, 31 If the tongue is perceived to be underdeveloped, it is termed microglossia. This subjective assessment does not take into account the possibility that the oral cavity, and not the tongue, is abnormally sized, such as in Down Syndrome.9, 23, 32 Furthermore, tongue protrusion may be a normal phenomenon.33
In this study, we present normal reference charts of fetal tongue measurements between 13 and 40 weeks of gestation. Two previous prenatal studies have established a fetal tongue nomogram, but both were of limited GA range, between 13 and 26 weeks of gestation.3, 5 Moreover, these nomograms were based on small numbers (2–10 cases per gestational week), measurements were performed by a single examiner, lacking inter/intra-operator variability analysis. One of these studies included only tongue width measurements since the terminal sulcus could not be demonstrated due to insufficient resolution. Our charts are based on a median of 23 measurements per gestational week (20–27, interquartile range). They were performed by 5 skilled sonographers and demonstrated an excellent correlation of the intra and inter-observer variability. Furthermore, as ultrasound resolution has significantly improved, we were easily able to demonstrate the terminal sulcus, the posterior border of the tongue (Figure 1). The use of this landmark as the posterior border of the tongue and the method of measuring the tongue length, width and area, has been performed and validated in a fetal cadaver population.6
Our data showed a positive and significant correlation between all 4 tongue biometric measurements and the GA best expressed by a cubic polynomial regression formula. This is in agreement with previous studies.3-6
The strengths of the study are its prospective design, strict adherence to inclusion and exclusion criteria and relatively large sample size for each week, all contributing to the quality of the nomogram. Furthermore, multiple examiners participated in acquiring measurements with high intra- and interclass correlation, strengthening the reproducibility of tongue measurements. The weaknesses of the study should also be addressed. Tongue measurement requires a clear image of the tongue and terminal sulcus, which can only be acquired in a fetal supine position with a slightly extended neck and tongue at rest. This may be time consuming. The time taken to acquire the appropriate image has not been addressed in the current study.
Conclusion
We present contemporary, comprehensive fetal tongue size charts from 13 to 40 weeks of gestation. These nomograms are an essential tool for distinguishing normal from pathologically sized tongues associated with syndromatic conditions, especially when micro/macroglossia is an isolated finding such as seen in case 1 which was diagnosed with Beckwith-Wiedemann. Clinical application of these novel nomograms may be beneficial in the prenatal diagnosis of syndromes associated with micro/macroglossia.


