Climate and community in Central Mesa Verde
ABSTRACT
Periods of acute climate stress – the convergence of low subsistence yields due to poor climate conditions and ineffective buffering strategies due to climate variability – critically reduces peoples’ ability to subsist and mitigate food shortages, thereby creating conditions that could result in profound social change. Here, paleoclimate reconstructions are used to identify periods of acute stress at three large Ancestral Pueblo villages in the US Southwest. These periods are examined in relation to occupation histories at each village showing that in certain instances, acute climate stress played a primary role in people's decisions to leave communities. However, not all of the communities reacted to stress in the same way indicating that distinct patterns of climate and social context played an important role in influencing how acute climate stress was experienced by different groups. Results from this study highlight the importance of community-specific histories when considering the impact of climate stress on past people.
Abbreviations
-
- ADF
-
- Augmented Dickey–Fuller
-
- CMV
-
- Central Mesa Verde
-
- FVAP
-
- Far View Archaeological Project
-
- FVC
-
- Far View Community
-
- GC
-
- Granger causality
-
- MI
-
- Match Interval
-
- MVNP
-
- Mesa Verde National Park
-
- MCGHV
-
- Morefield Canyon Great House Village
-
- YJP
-
- Yellow Jacket Pueblo
Introduction
In the last several decades, climate-oriented archaeology has evolved from climate determinism to nuanced models of vulnerability and resilience that show human–climate relationships are complex and multi-causal (Barrios 2016; Degroot et al., 2021; Ingram 2015; Nelson et al., 2016; Oliver-Smith 2013). Nevertheless, archaeologists most often study climate stress by focusing on periods when climate limited subsistence practices, such as during drought. Yet, there are many ways that climate conditions stress human subsistence practices, which in turn influence broader social dynamics, such as settlement organization and exchange. Thus, human–climate relationships are better understood by carefully examining the diverse, inter-related pathways through which climate constrains human subsistence efforts or creates opportunity for innovation (D'Alpoim et al., 2016).
Here, two related and intersecting patterns are examined to define and identify acute climate stress: (i) periods when climate conditions critically reduce people's subsistence yields, and (ii) periods when variability in climate conditions threaten the buffering strategies people use to mitigate climatically induced food shortages. During these times, and particularly when they converge and become periods of acute stress, people are less likely to meet their caloric and nutritional needs through their own subsistence efforts and are also less able to rely on alternative, mitigating strategies. These conditions can become a critical threat to communities. To examine these situations more closely, both discrete periods of acute stress and long-term patterns (i.e. acute stress regimes) are compared to the demographic histories at three Ancestral Pueblo villages in the northern US Southwest. Results show that in certain instances, population changes are meaningfully linked to periods and patterns of acute stress, which played a primary role in people's decisions to leave. Unique climate and social histories at each community also played an important role in influencing how acute climate stress was experienced.
Defining acute climate stress
One of the most direct connections between climate and human behavior is the effect of conditions (e.g. precipitation and temperature) on peoples’ ability to subsist (Halstead and O'Shea 1989). Climate conditions constrain subsistence efforts in many ways: droughts limit the ability of farmers to grow crops (e.g. Zori and Brant 2012), extreme changes in seasonal temperature affect the migration patterns of herds that hunters rely on (e.g. Minc and Smith 1989) and increased flooding affect where people grow food (Cooper and Peros 2010). However, nuanced archaeological studies of human–climate relationships have shown that people respond in many different ways when faced with climate-induced food stress as a result of unique social, political and historical trajectories that affect their resiliency, vulnerability and adaptability (Barrios 2016; Burke et al., 2021; Degroot et al., 2021; Holling and Meffe 1996; Ingram 2015; McAnany and Yoffee 2010; Middleton 2012; Nelson et al., 2012, 2016; Oliver-Smith 2013; Scheffer et al., 2021; Tucker and Nelson 2012; Weiss 2017).
One of the reasons that poor climate conditions do not always cause food shortages and/or vulnerability is because people have developed strategies to buffer themselves from the effects of disadvantageous climate conditions (Halstead and O'Shea 1989). For example, farming communities can build water management infrastructure to serve domestic and agricultural needs even during drought years (Ackerly 2016; Hill et al., 2015; Wilshusen et al., 1997). Others might store surplus food (Bogaard 2017; Kuijt 2015; Kuijt and Finlayson 2009; Winterhalder and Goland 1997), trade (Baldos and Hertel 2015; Kennett and Kennett 2000; Minc and Smith 1989; Minnis 1985; Tainter 1995), change mobility patterns (Petraglia et al., 2020; Varien et al., 2000) or rely on alternative food sources (Minnis 1985, 2021; O'Shea 1989) to cope with climatically constrained subsistence. Although buffering strategies are a key component of climate resiliency among past and present people, there is no guarantee that they will allow people to successfully mitigate future climate stressors. If food stores cannot sustain a population across years of insufficient production, or if all communities participating in a trade network experience equally limiting climate conditions, buffering strategies will prove incapable of transcending the climate constraints and people will suffer the effects of climatically induced food shortages or adopt significant social changes (Minc and Smith 1989).
Acute climate stress is when climate conditions not only reduce people's immediate subsistence efforts, but also threaten the buffering strategies that people use to mitigate food stress. Although acute stress is not necessarily a direct catalyst for social change, the consequences of acute stress, particularly food shortages, can be an immediate threat to people's basic nutritional needs (UNICEF 2020), and long-term malnutrition can have adverse effects including increasing perceptions of vulnerability (Minnis 1985) or decreasing life expectancy (Doblhammer et al., 2013). As a consequence, acute climate stress can cause people to change mobility patterns, abandoni urban areas, or divide into smaller groups and settlements in pursuit of new and/or different subsistence strategies.
Identifying acute climate stress
For much of human history, people have met their nutritional needs through the procurement of local, seasonally or yearly dependent resources, which are climatically constrained or enabled mainly through temperature and precipitation. These conditions must be reconstructed at local, annual resolutions to understand the potential local responses to climate (D'Alpoim et al., 2016). Furthermore, temporal and spatial variation in these conditions must also be considered to fully capture the impact of high-frequency climate impacts on subsistence and buffering strategies (D'Alpoim et al., 2016; Nelson et al., 2012; Van West and Dean 2000). For example, differences in conditions between local and non-local areas should be determined to establish if yields across a region varied enough to enable trade between communities with surpluses and those with shortages. If people stored food, annual climate reconstructions should be analyzed over the long term to assess if low-yield years required stores that lasted days, months or years. Yet, in many contexts, it can be difficult to accurately measure exactly how buffering strategies functioned (Kuijt 2015), or it may not be possible to identify which buffering strategies people were using due to a lack of material evidence. Since relationships between peoples and climate are ever changing, no buffering strategy is foolproof (Nelson et al., 2012), and peoples’ strategies will change as climate presents different constraints or allowances over time. Therefore, determining when climate conditions posed the greatest threat to buffering strategies regardless of the type of strategy people may have been relying upon is necessary.
Buffering strategies are designed primarily to cope with the known challenges of previously experienced climate patterns. If prior conditions allowed for general abundance accompanied by periodic shortages, people might prepare and maintain short-term food stores. If prior conditions were characterized by cyclical wet- and dry-seasons, people might build reservoirs or other water management infrastructure. If buffering strategies were built to cope with known climate challenges, then their success depends on the continuity and predictability of those challenges (Halstead and O'Shea 1989; Ingram 2015). Short-term food stores, for instance, will remain successful if the climate patterns continue to create short-term food shortages. However, if climate patterns start to create long-term shortages, short-term stores will no longer suffice. Consequently, as the difference between expected climate conditions (i.e. those that were buffered against) and experienced conditions increases, so too does the threat that buffering strategies will fail.
Determining when experienced and expected conditions meaningfully differ from one another requires defining the timescale at which climate expectations are established. Although climate conditions are experienced daily, it is only through repeated daily experience that people begin to build expectations about climate. For example, seasonal precipitation patterns become routinized due to their daily (re-)occurrence across seasons and years. If those patterns persist long enough, they are more likely to become embedded in the social memory that drives our collective understanding – and expectations – about the past (Van Dyke 2009). Thus, through the long-term accumulation of daily climate experiences, expectations about climate patterns inform, influence and structure social behavior (Bourdieu 1977; Giddens 1984; Hodder and Cessford 2004) including subsistence efforts and buffering strategies. Therefore, climate expectations develop and become ingrained at generational scales, which for this study is 20 years. Generational scales are long enough to allow climate experiences to become part of the social habitus and to play into decisions about labor, yield pay offs and investments.
While climate expectations may take time to develop, they can quickly reset or reconfigure when climate constraints have an immediate negative effect on active subsistence practice. For example, even if conditions allowed high productivity for extended periods, the onset of sudden, negative climatic conditions can rapidly alter expectations, especially when adverse effects, such as food insecurity and starvation, are exacerbated. Thus, although people may build expectations over longer periods of time and develop strategies using this knowledge, a single year with extreme conditions may be enough to cause buffering strategies to weaken or fail.
A compelling example of unexpected conditions causing buffering strategies to fail comes from Angkor, the capital of the Khmer Empire, centered in present-day Cambodia. Between the ninth and 13th centuries, people living in Angkor relied on a vast hydrological buffering strategy including networks of canals, reservoirs and embankments to cope with seasonal patterns of water abundance and scarcity (Buckley et al. 2010; Fletcher 2018). By managing excess water in the wet season and storing water in the dry season, people in Angkor were able to produce food surpluses to cope with seasonal or yearly shortages. However, in the 14th and 15th centuries, oscillations between the wet and dry season became less predictable and more dramatic. Consequently, water infrastructure became ineffective, food surpluses shrank and Angkor collapsed (Buckley et al. 2014; Cook et al., 2010; Fletcher 2018; Weiss 2017). Identifying periods of acute climate stress therefore requires attention to the periodicity and co-occurrence of poor climate conditions that threaten active subsistence practices, and to meaningful variability in climate conditions that threatens the efficacy of buffering strategies. This perspective of acute climate stress is operationalized in a case study from the US Southwest to understand periods when climate affected short- and long-term strategies of subsistence at three large ancestral Pueblo villages.
A US Southwest case study of acute climate stress
For centuries, ancestral Pueblo people depended heavily on dryland (rain-fed) maize agriculture in the Central Mesa Verde (CMV) region, which is present-day southwestern Colorado and southeastern Utah in the US Southwest (Coltrain and Janetski 2013). Thus, their subsistence practices were tightly constrained by climatic conditions, particularly low precipitation. To mitigate these uncertain conditions, ancestral Pueblo people used adaptive farming strategies, such as diversifying local maize varieties (Ermigiotti et al., 2022), as well as various buffering strategies, such as trade, storage and water management (Aiuvalasit 2017; Ford 1968; Whiting 1939).
To estimate the impact of climatic conditions on peoples’ ability to grow food, southwestern archaeologists have focused particularly on reconstructing precipitation regimes and identifying droughts1 using tree-ring, pollen and other proxy data (Bellorado 2007; Bocinsky and Kohler 2014; Bocinsky et al., 2016; Bocinsky and Varien 2017; Cordell et al., 2007; Ingram 2010, 2015; Kohler 2012; Kohler et al., 2008; Nelson et al., 2016; Van West 1994; Van West and Dean 2000). More than a century ago, Douglass (1929) used tree rings to identify a severe, region-wide drought that occurred between ad 1276 and 1299. He suggested that this drought was the primary catalyst in the Pueblo emigration from the CMV in the late 13th century. Since then, archaeologists have also shown that the drought of the late 1200 s amplified pre-existing imbalances between subsistence efforts and population size, thereby accelerating processes of emigration (Bocinsky and Kohler 2014; Schwindt et al., 2016). However, some areas remained agriculturally productive during the worst part of the drought (Bocinsky and Kohler 2014; Van West 1994; Van West and Dean 2000; Varien 1999; Varien et al., 2000; Wright 2010) and emigration, which began before ad 1276, was not uniform across the region (Duff and Wilshusen 2000; Glowacki 2015, 2020; Glowacki and Ortman 2012; Varien et al., 2007). Given the complex relationships among people and drought in CMV, researchers have concluded that poor precipitation conditions were just one process among many intricately related environmental, social, demographic and political processes that combined to create unstable conditions and vulnerable social groups during the 1200 s (Glowacki 2015; Schwindt et al., 2016; Van West and Dean 2000).
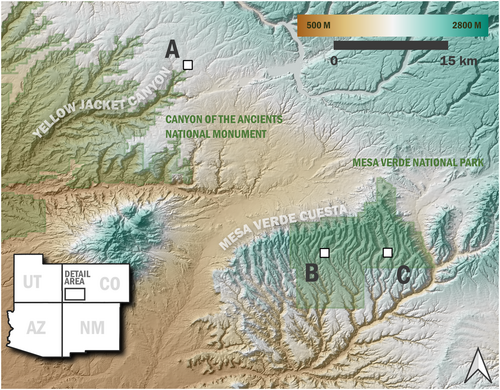
The role of climate in these interrelated processes, however, could be better understood by shifting the focus away from droughts and toward acute climate stress, which incorporates multiple climate stressors on human subsistence. To illustrate the utility of studying acute climate stress, patterns of acute stress are reconstructed and related to demographic trends at three large Ancestral Pueblo villages – Far View Community (FVC), Morefield Canyon Great House Village (MCGHV) and Yellow Jacket Pueblo (YJP) – in CMV (Figure 1). All three villages are among the largest, longest-lived ancestral Pueblo villages in the region. As such, these community centers – settlements with 50 rooms or more, nine or more kivas and/or public architecture – played key roles in the social, economic and ritual networks that connected communities across the region from ad 750 to 1280 (Glowacki 2015; Glowacki and Ortman 2012; Lipe and Ortman 2000; Varien 1999). FVC, MCGHV and YJP were selected as comparative examples because they are in distinct ecological settings with specific historical and social trajectories.
Identifying acute stress
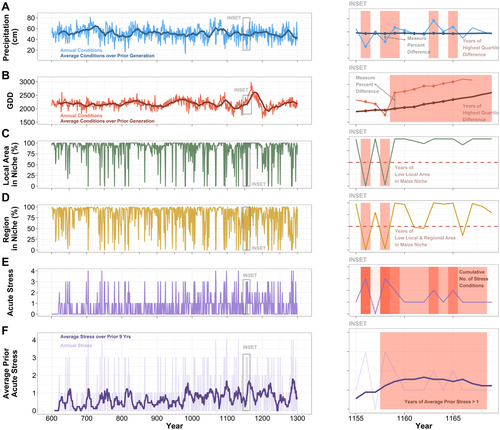
Acute climate stress was identified by reconstructing the periodicity of poor climate conditions and patterns of climate variability at each ancestral Pueblo village. To estimate acute climate stress, years characterized by local food shortages due to poor climate and an increased likelihood that buffering strategies would fail due to high variability in precipitation, high variability in temperature, and/or simultaneous local and non-local food shortages were identified. These four factors were identified annually using paleoclimate reconstructions produced via Paleocar,2 an R package developed by Bocinsky and Kohler (2014) for performing spatio-temporal paleoclimate reconstructions from tree-rings using a variable ranking and selection method called CAR (Correlation-Adjusted CorRelation). Paleocar was originally implemented for retrodicting 532 regional, climatically sensitive tree-ring chronologies to produce a 2000-year annual, high-resolution reconstruction of net water-year precipitation and accumulated heat over each growing season for the US Southwest. These high-frequency reconstructions were selected for this study over low-frequency reconstructions (e.g. Wright 2010, 2006) because acute stress is predicated on annual variability in local climate conditions. However, low-frequency climate patterns are also important factors in human–climate relationships because they capture long-term regime changes, which seem to correspond with some of the most archaeologically visible demographic processes, such as regional or century-scale population movements (Dean et al., 1985; Wright 2012). Yet, high-frequency data can better capture conditions that were directly experienced by past people, such as yearly conditions or local variability. More research on both high- and low-frequency climate change is needed to better understand the effect of climate on demographic change.
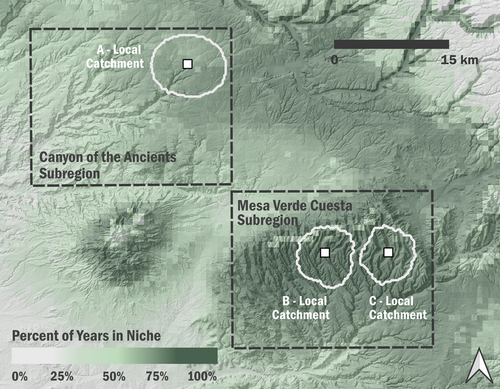
To examine the first stress indicator – years when local, climatically induced food shortages were likely – the paleoclimate reconstructions were compared with a maize farming niche model that estimates where and when dryland maize farming would have been possible (Bocinsky and Kohler 2014; Bocinsky et al., 2016). This analysis focused on maize because it was a primary food source for ancestral Pueblo people to meet their caloric needs (Coltrain and Janetski 2013; Varien et al., 2000). The local catchment areas for FVC, MCGHV and YJP were defined as a 2-h walk (roundtrip) from the center of the village because prior studies have shown that a 2-km catchment reasonably encompasses the area that a single community might use for intensive agriculture (Reese et al., 2019; Varien et al., 2000:52). Any year when less than half of the local catchment was within the maize farming niche probably resulted in an increased probability of climate-induced food shortages. During these years, distances between residences and farming plots may have increased as the number of arable plots shrank and amplified imbalances between food production and energy expenditure, which could cause food insecurity, malnutrition and conflict (Kohler et al., 2014; Varien et al., 2000).
Evidence suggests residents of FVC, MCGHV and YJP used storage, water management and trade to buffer themselves from the effects of climatically induced food shortages. Thus, the potential failure of these buffering strategies was estimated using variability in precipitation, variability in temperature and differences in the size of maize farming niches across the region. These measures were used with the assumption that as conditions become more variable and productivity across the region decreases, existing buffering strategies become less able to mitigate any food shortages. Threats to water management and food storage were estimated by measuring variability in annual, high-resolution (~800 m) temperature and precipitation reconstructions (Bocinsky et al., 2016). This variability was measured as the percentage difference between experienced and expected temperature and precipitation conditions. Experienced conditions were calculated as the average precipitation or temperature within each community's local catchment each year. Expected conditions were calculated by smoothing annual conditions with a 20-year trailing average, which ensured that only past experiences were used to establish expectations. For example, the expected climate conditions in ad 900 were determined by averaging the annual conditions for the preceding 20-year period ad 880–899. Any year when the percentage difference between experienced and expected conditions was in the highest quartile probably threatened local water management and food production/storage strategies. For instance, greater than expected rainfall could blow out, erode or fill in dams, canals or ditches, rendering them less effective in future years. As a result, productivity could decrease leading to smaller food stores.
The vulnerability of buffering strategies that relied on obtaining food produced non-locally through trade was assessed by examining the size of the maize farming niche in areas outside of each community's local catchment. Non-local areas were defined as the land within a 650-km2 rectangular area surrounding each community (Figure 2). These non-local areas encompassed the major physiographic features associated with the ancestral pueblo villages (i.e. the Mesa Verde Cuesta and Yellow Jacket Canyon). Any year when less than half of the local catchment and less than half of the non-local area was within the maize growing niche probably threatened trade strategies, assuming low maize niche size reduced non-local production and thus also reduced the ability of non-local communities to contribute surpluses to trade.
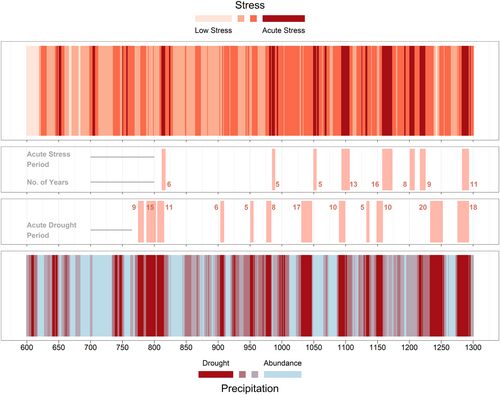
Acute stress regimes were determined for each ancestral Pueblo village across the period ad 600–1300 by tallying the occurrences of these indicators: (i) insufficient local subsistence due to reduced size of the local maize growing niche; (ii) threats to local buffering strategies due to high variability between experienced and expected precipitation; (iii) similar threats due to high variability in temperature; and (iv) threats to non-local buffering strategies due to the reduced size of the local and non-local maize growing niche (Figure 3). The effects of food shortages and/or vulnerable buffering strategies would continue and/or compound beyond the year of their occurrence. For example, low-productivity years could create a pattern of prolonged vulnerability as food stores and buffering strategies become depleted and less reliant. Yet, non-stressful years within otherwise stressful periods might also have short-term benefits that minimize community vulnerability. Therefore, the stress regimes were smoothed using a 9-year trailing average, following Kintigh and Ingram (2018: 27) who created smoothed drought reconstructions to accommodate, but not ignore, wet years within drought periods. Discrete acute stress periods were defined as any period with five or more consecutive years that had a smoothed stress index of ≥1 (Figure 3).
Studying acute stress in relation to droughts allows researchers to study different ways and points in time when climate threatened communities. For example, acute stress regimes reconstructed for FVC show seven discrete periods of acute stress and precipitation reconstructions show 12 periods with at least 5 years of consecutive, lowest quartile precipitation (Figure 4). However, acute stress and droughts at Far View do not always co-occur; there were two acute stress periods, but no droughts between ad 1200 and 1225 (Figure 4). Yet, in other cases, droughts and acute stress may have also been linked and influenced one another in important ways. For example, there is a nearly continuous 35-year drought in the late 700 s and early 800 s at Far View that is extended by an overlapping period of acute stress. The timing and interaction of these stressors may have had a particularly profound impact by creating a series of slowly accumulating drought-induced food shortages that were amplified by unpredictable conditions.
Measuring the effects of acute stress
Discrete periods and long-term patterns of acute stress are examined in relation to demographic changes at FVC, MCGHV and YJP to understand how acute stress may have affected people living in different communities. Demographic patterns are used to assess social responses to climate stress since there is some evidence suggesting poor climate conditions in CMV have corresponded to some demographic processes such as aggregation in the most productive catchments (Schwindt et al., 2016; Varien et al., 2007). Demographic reconstructions were produced by estimating phases of occupation at residential structures in each community for each occupation phase. Temporal assignments were made using a method that compares diagnostic ceramics with a seriation of calibrated ceramic data from the Village Ecodynamics Project (VEP) and the Brainerd Robinson coefficient of similarity (Glowacki and Field 2023). This method used correspondence analysis and a k-means cluster analysis to seriate diagnostic ceramic data from 81 sites that were originally assessed for the VEP (Schwindt et al., 2016). The result identified 10 distinct phases from ad 700 to 1280 defined by specific frequencies of diagnostic ceramics. The seriated data were then compared to assemblages of diagnostic ceramics at each residential site in FVC, MCGHV and YJP using the Brainerd Robinson formula (Peeples 2011). This effort produced momentary occupation estimates for all structures from ad 700 to 1280. Population was estimated for each occupied structure using two methods: (i) one based on the number of associated kivas with each occupied structure; and (ii) one using the Pueblo Decomposition Model to assign rooms based on rubble area (Duwe et al., 2016).3 Estimates from both methods were averaged for an overall estimate of the number of people living in each community between ad 700 and 1280.
The correspondence and causal effect of acute stress on demographic change was measured using two statistical methods. Match Interval (MI), a Monte Carlo approach developed by Kintigh and Ingram (2018), was used to identify when distinct periods of acute climate stress and demographic change correspond and determine if these correspondences were statistically meaningful. In addition, to determine whether one time series is useful in forecasting another, a Granger causality (GC) test (Granger 1969; Kohler et al., 2020; Turchin 2018; Zhang et al., 2011) was used to assess whether acute stress regimes are a useful predictor of demographic change. These complementary methods were used to determine if discrete acute stress periods and long-term patterns of acute stress (i.e. acute stress regimes) were meaningfully related to demographic change at FVC, MCGHV and YJP.
MI measures if the observed correspondence between climate regimes and social transitions, such as droughts and depopulation events, occurs more or less frequently than correspondence between random climate regimes and social transitions (Kintigh and Ingram 2018). If random regimes rarely produce an equal or greater number of correspondences than is observed, then the observed relationships are more likely to be meaningful (Kintigh and Ingram 2018). A critical component of MI is defining the temporal window within which climate downturns and social transitions must occur to be considered correspondent. For example, if a climate downturn had a causal impact on a social transition, then the social transition should begin sometime after the climate downturn began. Yet, there may be a lag between the start and/or end of climate downturn and the social transition, especially if people had buffering strategies in place. If people stored food, for instance, then the transformative impact of a climate downturn may not begin until after food stores run out, which could be months or even several years later (Bradfield 1971; Kintigh and Ingram 2018; Kuijt 2015; Winterhalder and Goland 1997). Additionally, if the exact timing of a social transition is uncertain due to inherent error in dating techniques, then some additional uncertainty should be incorporated when estimating the possible gap between associated climate downturns and social transitions (Kintigh and Ingram 2018: 28).
For this study, only stress periods during the known occupation history for each village were considered as possibly correspondent. Additionally, the lag between a period of acute climate stress and a demographic change is set at ±5 years, since ethnographic evidence shows that Pueblo people would try to store food to withstand at least 2 years of low production (Bradfield 1971; Ford 1968; Hough 1915; Kintigh and Ingram 2018; Whiting 1939), and because the stress effects of high variability on buffering strategies, such as degrading water management infrastructure, might take several years to compound. There is a relatively high amount of uncertainty regarding the onset of demographic transitions since the seriation method used to calculate demographic patterns at each community contains phases that are 40 years long at a minimum (Glowacki and Field 2023). Consequently, if a period of aggregation was identified in the phase from ad 980 to 1020, it is possible that aggregation could have begun as late as ad 1019. Therefore, in addition to the lag time of ±5 years, an uncertainty limit of ±20 years was also used to better account for uncertainty related to the onset of demographic changes. Thus, a social transition between ad 880 and 919 corresponds with any climate transition that began between ad 865 and 894.
GC is a useful, but under-used, test for measuring the causality between two time series, such as acute stress and demographic change (Kohler et al., 2020: 323). The Granger test can be particularly useful for climate-oriented research because it provides a statistical method for evaluating the relationship between patterns of gradual change, as opposed to periods of abrupt, discrete change. Understanding how patterns of climate and social change relate to one another provides a more comprehensive means of assessing human resiliency to climate change, which usually declines as the cumulative impacts of stress play out over the long term (Scheffer et al., 2021). The GC test assumes that X1 can be expected to play a causal role in Y1 if Y1 can be better predicted by past patterns in X1 than past patterns in Y1 (Granger 1969; Zhang et al., 2011: 26). For example, using the variables relevant to this study, we can expect that acute stress regimes played a causal role in demographic change if stress regimes are a better predictor of future demographic patterns than demographic patterns are themselves. However, one of the difficulties of using the GC test is that non-stationary and/or serially autocorrelated time series can produce meaningful results even if the relationships between series are not causal (Kohler et al., 2020). Therefore, at a minimum, time series should be subjected to a stationary test, such as an Augmented Dickey–Fuller (ADF) test, which is widely used for this purpose. If the ADF null hypothesis (e.g. a unit root is present in a time series) can be rejected for both series, then any meaningful GC result can be more confidently interpreted as an outcome of causality between the two series rather than trends within them (Kohler et al., 2020; Zhang et al., 2011). If the ADF null hypothesis cannot be rejected, then new series can be created wherein each observation is the difference between the present value and a previous value at some temporal lag (Kohler et al., 2020:323). This lag process can be used to de-trend time series, thereby allowing it to be confidently subjected to a GC test.
Given these considerations, an ADF test was conducted for each acute stress regime and demographic reconstruction to ensure they are comparable. The ADF results show that all the stress regimes are stationary (p < 0.01) and can be confidently used in the GC test without incorporating any lag. However, none of the demographic reconstructions were stationary and thus, following Kohler et al. (2020), we iteratively lagged the demographic series to produce stationary series that could be subjected to the GC test. Iterative lags at 1-year intervals from 1 to 25 years resulted in at least six stationary demographic series for all communities. All stationary demographic series and acute stress regimes were then subjected to the GC test, resulting in 24 GC results (Table 1). Given that at least six GC tests were conducted for each community, any differences between GC outcomes from FVC, MCGHV and YJP are more likely to be a result of actual variation in the causal effect of acute stress regimes rather than differences in the ability to conduct meaningful GC tests.
| Population lag (years) | ||||||||||||||||||||||||||
|---|---|---|---|---|---|---|---|---|---|---|---|---|---|---|---|---|---|---|---|---|---|---|---|---|---|---|
| 1 | 2 | 3 | 4 | 5 | 6 | 7 | 8 | 9 | 10 | 11 | 12 | 13 | 14 | 15 | 16 | 17 | 18 | 19 | 20 | 21 | 22 | 23 | 24 | 25 | ||
| FVC | ADF | 0.26 | 0.28 | 0.14 | 0.40 | 0.05 | 0.07 | 0.28 | 0.57 | 0.22 | 0.14 | 0.17 | 0.07 | 0.08 | 0.08 | 0.06 | 0.05 | 0.05 | 0.05 | 0.06 | 0.03 | 0.02 | 0.03 | 0.04 | 0.04 | 0.02 |
| GC | – | – | – | – | 0.05 | – | – | – | – | – | – | – | – | – | – | 0.01 | 0.01 | 0.01 | – | 0.01 | 0.01 | 0.01 | 0.01 | 0.02 | 0.05 | |
| MCGHV | ADF | 0.23 | 0.35 | 0.20 | 0.34 | 0.18 | 0.10 | 0.40 | 0.63 | 0.26 | 0.34 | 0.21 | 0.09 | 0.14 | 0.12 | 0.10 | 0.05 | 0.07 | 0.10 | 0.03 | 0.03 | 0.03 | 0.01 | 0.04 | 0.02 | 0.02 |
| GC | – | – | – | – | – | – | – | – | – | – | – | – | – | – | – | 0.17 | – | – | 0.37 | 0.64 | 0.88 | 0.91 | 0.58 | 0.38 | 0.18 | |
| YJP | ADF | 0.43 | 0.35 | 0.22 | 0.5 | 0.18 | 0.19 | 0.27 | 0.73 | 0.4 | 0.32 | 0.22 | 0.17 | 0.15 | 0.16 | 0.12 | 0.19 | 0.17 | 0.07 | 0.05 | 0.03 | 0.05 | 0.07 | 0.02 | 0.04 | 0.03 |
| GC | – | – | – | – | – | – | – | – | – | – | – | – | – | – | – | – | – | – | 0.41 | 0.23 | 0.39 | – | 0.20 | 0.15 | 0.09 | |
Acute stress at the Far View Community
The FVC, in Mesa Verde National Park (MVNP), is located on Chapin Mesa, which is the most densely occupied mesa on the cuesta (Figure 5). Due to the southward facing slope of the cuesta and a relatively high amount of annual precipitation, Far View, and other communities on the landform, benefited from some of the best agricultural lands in CMV (Adams and Peterson 1999). However, the FVC is at an elevation of ~2360 m (7750 ft) resulting in lower annual temperatures than most other places on the landform. Nevertheless, it is one of the largest and longest-lived communities on the Mesa Verde Cuesta containing 59 residential structures including a Chaco great house complex, 68 kivas, an oversized kiva and four towers. The community also has at least one reservoir and a system of culturally modified ditches, drainages and catchments used to manage water across a 270-acre area, if not more. A demographic history of FVC based on excavation and survey data shows that it was continuously occupied from at least the eighth to the early 13th centuries (Figure 6; Fewkes 1917, 1919; Glowacki and Field 2022; Lister 1964, 1965, 1966). These data show that the community began with about 75 people in the 700 s but declined briefly in the 800 s before growing steadily between ad 880 and 980. By the turn of the 10th century, FVC was at its peak population of about 300 people. The population remained relatively stable through the first part of the 11th century until about ad 1060, when the community began to gradually, but steadily decline until the end of its occupation by ad 1220–1250.
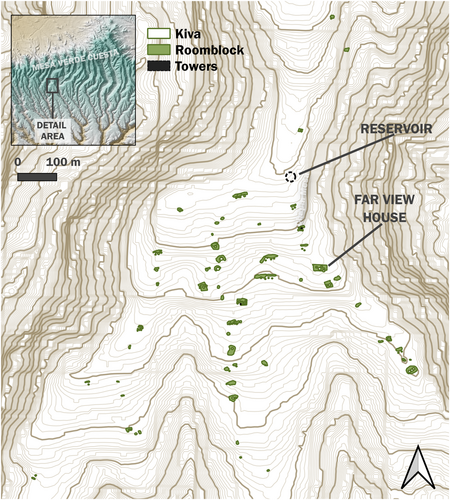
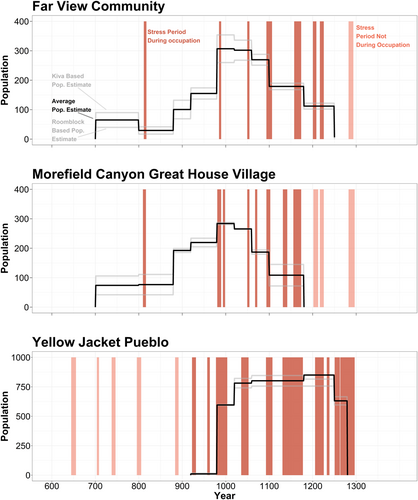
Seven acute stress periods were identified during the occupation of the community and there were also 252 years with the occurrence of at least one stress condition (Figure 6). On average acute stress periods lasted 8.9 years and the longest stress period was 16 years (ad 1158–1173). Acute stress periods were more common and more severe (i.e. characterized by a greater average number of acute stress indicators in each period of acute stress) during phases of disaggregation than during phases of aggregation. The MI analysis indicates a 24% probability that an equal or greater number of correspondences between stress and population decline would have occurred by chance (Table 2). These results suggest that disaggregation was impacted by acute stress. Importantly, the MI Monte Carlo simulation produced fewer than three matches between acute stress periods and disaggregation on average, which is the only instance in this study where MI consistently produced fewer matches during random trials than were observed (Table 2). Alternatively, there is a 94% probability that one or more randomized stress periods will correspond with a phase of population growth. Therefore, these results cautiously suggest that disaggregation at FVC was more meaningfully linked with acute climate stress than aggregation.
| Observed matches | ||||||||||
|---|---|---|---|---|---|---|---|---|---|---|
| Community | Number of tested social transitions (average length of tested transitions) | Nature of social transitions | Number of tested acute climate stress periods (average length of tested stress periods) | Number of observed matches | Social transition | Matched stress period | Analysis test period (determined from occupation range) | Computational interval (determined from range of stress periods) | Average number of matches by chance, rounded (non-rounded) | Probability of more matches by chance than by observation |
| Far View Community | 4 (60) | Population Increase | 7 (8.9) | 1 | 980–1019 | 985–989 | 700–1250 | 812–1225 | 2 (1.65) | 0.94 |
| 6 (56.8) | Population decrease | 4 | 812-879 | 812–817 | 3 (2.82) | 0.24 | ||||
| 1060–1099 | 1050–1054 | |||||||||
| 1100–1179 | 1094–1106 | |||||||||
| 1180–1249 | 1158–1173 | |||||||||
| Morefield Canyon Great House Village | 5 (64) | Population increase | 8 (8.5) | 2 | 810–879 | 810–816 | 700-1180 | 810–1173 | 3 (2.51) | 0.86 |
| 980–1019 | 981–989; 994–998 | |||||||||
| 4 (55) | Population decrease | 2 | 1060-1099 | 1050–1054; 1068–1072 | 2 (1.44) | 0.47 | ||||
| 1100–1179 | 1094–1102 | |||||||||
| Yellow Jacket Pueblo | 5 (50) | Population increase | 10 (18.1) | 3 | 920-979 | 923–931 | 900–1280 | 923–1296 | 4 (4.36) | 0.99 |
| 980–1019 | 958–963; 978–1003 | |||||||||
| 1060–1099 | 1036–1052 | |||||||||
| 1 (31) | Population decrease | 1 | 1250–1280 | 1233–1238; 1251–1262; 1264–1296 | 1 (0.84) | 0.84 | ||||
GC tests confirm and strengthen this association showing a strong causal relationship between patterns of climate stress and demographic change at Far View (Table 1). Ten of the 25 tests where the ADF p-value was <0.05 showed a strong GC between stress and demographic change (Table 1). GC results indicating a causal relationship between acute stress and demographic change occurred after a 5-year demographic lag and also occurred nearly every year with a demographic lag of 16–25 years. These results mean that past acute stress patterns may have had a strong impact on the demographic changes occurring in the community. For example, the population decline that began in FVC just after ad 1000 was probably influenced by the marked increase in average acute climate stress between ad 980 and 990. In short, for the FVC patterns of acute stress and discrete periods of heightened acute stress probably played a key role in the phases of population decline in the community.
Acute stress at Morefield Canyon Great House Village
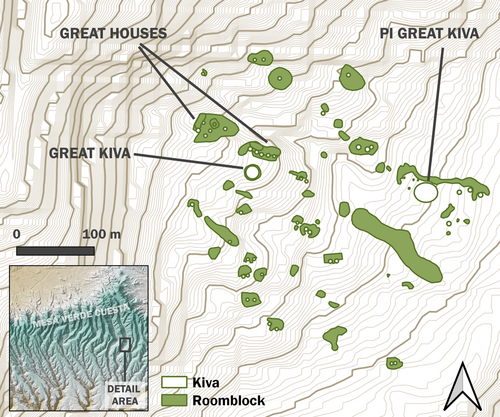
MCGHV, also located in MVNP, is ~8 km east of the FVC in the bottom of Morefield Canyon (Figure 7). Although MCGHV benefits from many of the same productive agricultural characteristics as Far View (i.e. higher precipitation and southward facing slopes), it is at a lower elevation (~2200 m/~7200 ft) resulting in slightly higher temperatures. It is also located within some of the most fertile agricultural lands in MVNP due to the wide canyon bottom and well-watered soils of Morefield Canyon (Benson 2011). MCGHV is smaller than FVC, containing at least 29 roomblocks and 48 pitstructures across an area of ~45 acres, as well as a Chaco great house complex and two great kivas (Glowacki 2012). Based on excavation and survey data (Glowacki 2012; Kleidon et al., 2003; Lister and Breternitz 1968; McLellan 1968), MCGHV began about the same time as FVC, but it grew faster than FVC reaching more than 200 people in the 900 s (Figure 6). The community also declined faster and earlier than FVC with occupation ending between ad 1150 and 1200.
Acute stress periods were slightly more common, but marginally shorter, at MCGHV than at FVC (Figure 6). Eight acute stress periods, averaging 8.5 years long, occurred when MCGHV was occupied (ad 700–1180), and there were 205 years with the occurrence of at least one stress condition. The longest stress period at MCGHV (ad 1156–1173) was also 2 years longer than the longest stress period at FVC. The somewhat more stressful conditions at MCGHV compared to FVC are interesting considering the village is thought to occupy some of the best agricultural areas in the CMV region (Benson 2011), and it is closer to natural springs than FVC. Two periods of acute climate stress correspond with phases of population decline at MCGHV, and two stress periods correspond with phases of population increase (Table 2). The MI results show about a 50/50 chance that phases of population decline will correspond with randomized stress regimes at the same rate that they correspond with observed regimes. There is also a high likelihood that randomly occurring stress periods and population increase will correspond at rates greater than or equal to those observed, indicating there was no meaningful relationship between acute stress and population change at MCGHV. Results from the GC tests also support these findings. None of the GC tests (even the nearly one-third of the tests where population lags produce an ADF p-value < 0.05) show a meaningful causality between climate stress and demographic time series (Table 1). Importantly, fewer of the ADF tests rejected the null hypothesis suggesting strong trends within the demographic reconstruction. Therefore, additional steps that minimize those trends might result in more meaningful GC tests. However, this possibility does not seem very likely since nearly one-third of the tests that produced an ADF p-value < 0.05 also generated a meaningful GC result. Regardless, both the MI and GC results suggest that climate stress was not a strong driver of demographic changes in MCGHV. Thus, in the case of MCGHV, it is more likely that population decline and village dissolution were driven more by social factors than climate stress.
Despite the lack of correspondence between demographic changes and acute stress, the timing and duration of acute stress at Morefield would still have had at least some impact on the residents. For example, between ad 1131 and 1180, MCGHV was in a period of acute stress for 28 years that conforms with a widely identified megadrought (Cook et al., 2007). During the same interval, FVC experienced 16 years of acute stress. Thus, people living in Morefield experienced considerably more time in an acute stress period than people living only 8 km to the east, which may have amplified subsistence stress and threatened social cohesion. A decrease in social cohesion at MCGHV may be evidenced by the high degree of autocorrelation in Morefield's demographic reconstruction. Previous research on human resilience to exogenous stressors, such as climate, has shown that increases in temporal autocorrelation, when paired with increasing variance, are a sign of critical slowing down, which signals reduced resilience to external perturbations (Scheffer et al., 2012, 2021; Spielmann et al., 2016). Thus, it still may be that the increased stress experiences at MCGHV during the mid- to late-12th century played some role in the decline of the community even if the demographic changes were not as directly associated with acute stress periods.
Acute stress at Yellow Jacket Pueblo
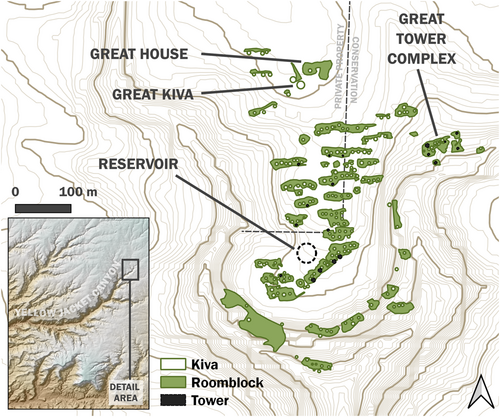
YJP is on the Great Sage Plain 35 km northwest of MVNP at the head of Yellow Jacket Canyon on the northeastern edge of Canyon of the Ancients National Monument (Figure 8). At about 2075 m (~6800 ft) elevation, Yellow Jacket receives less precipitation than FVC or MCGHV. However, it is situated at the confluence of two shallow, well-watered drainages, contains a seep-spring, and has a more conducive agricultural landscape than much of the surrounding area (Glowacki and Ortman 2012; Kuckelman 2003; Ortman et al., 2000). Based on the number of kivas YJP was nearly three times larger than FVC or MCGHV. In total, Yellow Jacket contained 42 roomblocks representing 600–1200 rooms, at least 195 kivas, 19 towers, a reservoir, a Chaco great house, a great kiva, and a Great Tower Complex that includes a bi-wall structure (Kuckelman 2003; Ortman et al., 2000; Varien et al., 2008). Yellow Jacket began in the mid-10th century, which was about when FVC and MCGHV were reaching peak populations, as shown by our demographic reconstruction of the village using the PDM and a kiva-based estimate, which were both informed through excavation and survey data (Figure 6; see Kuckelman 2003; Ortman et al., 2000). The population at YJP peaked nearly two centuries later (ad 1180–1250), when about 850 people were living in the community. Yet, population declined rapidly, and everyone chose to leave the community between ad 1250 and 1280. This reconstruction differs from prior studies that suggest the village formed sometime in the mid- to late 11th century and may have been much larger, containing as many as 1300–2700 people (Ferguson and Rohn 1986; Kuckelman 2003; Rohn 1983; Varien et al., 2008). The differences in occupation histories and settlement size are a result of different seriation, occupation and population estimate methods used in each study. Notably, our reconstruction represents a conservative population estimate and suggests that YJP began earlier, and perhaps with only a few families, based on the marginal presence of pre-1000s pottery and a potential late-900s tree-ring cutting date. The difference in occupation timing is especially important for understanding climate effects, because our reconstruction suggests that people were living at YJP for as much as a century earlier than previously suggested (Kuckelman 2003). Thus residents may have had an additional 100 years of experiencing and potentially responding to patterns of acute climate stress.
Unexpectedly, average climate stress at YJP was considerably higher than at FVC or MCGHV despite being one of the largest villages in the entire region and being located near a reliable water source (Figure 6). Ten periods of acute stress were identified during occupation of YJP (ad 920–1280), and there were 220 years with the occurrence of at least one climate stressor. Acute stress periods averaged 18.1 years, which is more than double the length of acute stress periods identified at FVC and MCGHV. Thus, YJP community members lived through nearly twice as many years in a period of acute stress than members of FVC or MCGHV. Furthermore, the longest acute stress period at YJP (ad 1137–1177) was two to three times as long as the longest stress period at MCGHV and FVC. In addition to these stressors, climate patterns not captured in this analysis probably added to the climate stress at YJP since, beginning around ad 1239, the long-standing dominant bi-modal precipitation pattern that produced winter and summer moisture across large parts of the US Southwest was disrupted. This significant change altered the timing and power of seasonal precipitation patterns (Van West and Dean 2000). Consequently, periods of acute climate stress in the mid-1200s may have had even more severe impacts on YJP residents as precipitation regimes changed in ways that were unprecedented during earlier occupation of the village.
Three periods of acute climate stress correspond with phases of population increase at YJP and one stress period corresponds with phases of population decline (Table 2). MI analysis indicates that population growth and decline at YJP are equally unrelated to climate stress due to a high probability of randomly occurring stress periods and population increase or decrease correspond at rates greater than or equal to those observed (Table 2). GC tests produce a similar result showing no causal relationship between acute stress regimes and future demographic change (Table 1). Among tests with an ADF p-value < 0.05, there were no meaningful GC results. The MI and GC results indicate that even though acute climate stress at YJP was more common and more profound than at FVC or MCGHV, it did not have a direct causal effect on aggregation or disaggregation in the community. The lack of impact of climate stress on YJP demography is intriguing, particularly because the longest acute stress period identified in this study (ad 1131–1177) occurred just before YJP reached its highest population sometime around ad 1200. These results indicate that people were moving into and staying at YJP despite climate stressors.
Experiencing acute climate stress (or not)
Our results show there is significant variability in whether and when acute stress is experienced and how it may affect population and settlement changes. Each of the three ancestral Pueblo communities experienced acute stress in different ways even though two of them were in the same subregion and experienced similar stress regimes (Far View and Morefield). Furthermore, all three communities experienced climate advantages in comparison to other areas in the CMV across time (Figure 9). As a result, FVC, MCGHV and YJP remained agriculturally viable during years when most other places were not. Despite these commonalities, acute stress had a causal impact on population decline at Far View, but not at MCGHV or YJP. How can we explain this variability, especially at YJP where acute stress was the most frequent, severe and prolonged? The relationships among the various factors are undoubtedly complex, but among them are differences in access to water, water management and political influence, and the correspondence of droughts with acute stress periods.
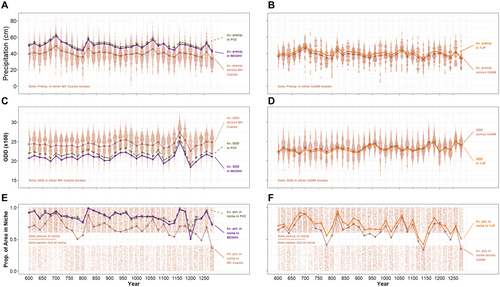
A significant difference among these villages is in their access to reliable water. Far View, located on Chapin Mesa, is several kilometers away from the nearest dependable water source. Thus, their primary local water source for farming and drinking was rain-fed. Conversely, Morefield and YJP are both on or near springs that provided residents with some access to year-round water. The lack of a nearby dependable water source may have been enough to make residents at FVC vulnerable to acute stress in ways that were ameliorated by the springs at MCGHV and YJP. For example, at all three villages, water management strategies involving reservoirs were vital for people's ability to mitigate acute stress. However, the success of these strategies may have been especially important at FVC because water access was less secure. For instance, at the very end of the 11th century, all three villages experienced an overlapping period of acute stress and drought, which may have interacted to impair reservoirs (Figure 6 and 9). An inability to capture and store water in the community may have been especially critical at Far View, where energy imbalances would be negatively impacted as residents had to walk further for guaranteed water access. The importance of reservoir and water access may help explain why the reservoir at Morefield was abandoned before the end of the community but the reservoir at Far View was maintained until it was no longer feasible (Breternitz 1999; Kuckelman 2003; WPI 2000; Wright 2006). At Morefield residents could persist without a reservoir because of the benefits of a spring, but Far View residents could not.
If the confluence of water access, reservoir use, and contemporaneous periods of acute stress and drought help us understand why Far View declined during acute stress and MCGHV did not, these same conditions help explain the persistence of YJP despite a comparatively worse acute stress context. Given the frequency and severity of acute stress at YJP, residents not only needed a nearby spring and a successful long-term water management strategy to succeed, but perhaps they also needed social benefits, such as access to and control over political networks. Some archaeologists have suggested that people in YJP controlled a sub-regional polity that enabled those in the community to receive benefits including trade, taxes or tribute (Crabtree et al., 2017; Kohler and Varien 2010). Given the size of the community, Yellow Jacket probably held some form of political authority in the region (Glowacki 2015; Kohler and Varien 2010) and data suggest community members participated in high degrees of local exchange (Arakawa 2012; Glowacki 2015). If the exchange and political authority held by YJP was great enough to incur subsistence support from subordinate communities, then the added benefits of trade or tribute may have been another critical component of YJP's resilience to acute stress. Ultimately, it is likely that YJP persisted because residents were able to mitigate acute stress by securing many interrelated benefits, including spring access, long-term water management, political authority and comparatively better climate conditions than their immediate neighbors.
Conclusion
Understanding the related, yet different ways that climate can stress people is foundational for better reconstructing human–climate relationships in past and present contexts. Defining acute climate stress through low subsistence yields and high variability refines research focused on when and where climate causes social change by interrogating the pathways through which climate affects subsistence and buffering strategies. Results from this perspective show that there is significant variability in the experience and effect of acute stress on community settlement in the CMV between ad 700 and 1280. Acute stress meaningfully impacted disaggregation at FVC yet did not impact demographic change at MCGHV or YJP. Therefore, people's experience of acute climate stress was not consistent, despite climate stress having potentially similar effects on subsistence efforts and buffering strategies. These results allow us to closely interrogate why, and how, certain communities, such as YJP, were able to mitigate the consequences of acute climate stress while others, such as FVC, were not. In particular, the case study of YJP shows that securing multiple beneficial factors can enable the persistence of large, aggregated villages in areas that have comparatively worse acute stress conditions than neighboring areas. Alternatively, communities such as Far View located in comparatively better climate contexts (i.e. on the Mesa Verde cuesta and subject to less frequent periods of acute stress) can be more affected by acute stress due to specific vulnerabilities, such as the lack of a nearby spring.
Ultimately, this study shows that the relationships between climate and social change are best understood by carefully examining both the ways climate stresses human subsistence and the unique social and environmental conditions specific to individual communities. The value of this perspective is exemplified by comparing acute stress with droughts since they do not always co-occur, nor do droughts always produce acute stress. However, when droughts and acute stress co-occur it can prolong the number of years when climate critically affected people's ability to subsist. Furthermore, we have defined acute stress with informed cutoffs between what we perceive as conducive climate conditions and stressful climate conditions (e.g. defining low productivity as any year when less than half of the local and non-local catchments are in the maize niche). Consequently, the results are sensitive to our underlying assumptions regarding when climate most severely threatens subsistence. We have worked to minimize the weight of any one assumption by defining acute stress through the convergence of several co-occurring negative conditions. Although this strategy is probably more productive than strategies focused on a single condition (e.g. drought), it is imperfect. As an additional cautionary note, even when strong relationships between stress and de-population events are observed, it is important to interrogate whether these social responses should be seen as an example of collapse or adaptation. In the northern US Southwest, cycles of migration are and were deeply embedded in ancestral Pueblo notions of settlement and mobility (Naranjo 1995). Therefore, people leaving places such as Far View during times of acute stress suggests the deliberate pursuit of a profound adaptive strategy by indigenous communities, and not collapse (Nelson and Schachner 2002). Lessons from this study should be seen in the context of how indigenous people have adapted and responded to climate stressors rather than the ways that they have faltered or collapsed under them.
Lessons from this study not only relate to archaeological inquiries about past peoples’ resilience, vulnerability and adaptation to climate stress, but also relationships between modern community and an increasingly stressful climate regime. It is apparent that although global climate conditions are being patterned around rapid warming, the effects of this patterning will probably have very different local effects. Even as much of the Earth's land and sea temperatures increase, certain parts of the continental USA are likely to receive more precipitation and other places will receive less. Climate conditions will also become more erratic as regimes shift. Thus, significant disruptions to modern communities will depend on how these climate changes are expressed on the local level, as well as communities’ capacity to buffer themselves from the potential stressors. Therefore, as archaeologists attempt to steer conversations regarding global climate change, it is imperative to re-focus analysis of climate consequences to the local scale.
Acknowledgments
This research would not have been possible without the assistance of all those who contributed to the Far View Archaeological Project (FVAP). We also thank the National Park Service and Crow Canyon Archaeological Center for the use of data related to Morefield Canyon Great House Village and Yellow Jacket Pueblo, respectively. Kyle Bocinsky and Kelsey Reese provided early insights regarding paleoclimate reconstructions. Finally, thanks go to Carrie Heitman, Mark Schurr, Ian Kuijt, Tim Kohler and an anonymous reviewer for their thoughtful contributions and recommendations.
Funding
This research was made possible through funding for the Far View Archaeological Project from the National Park Service, the Mesa Verde Museum Association, the Institute for Scholarship in the Liberal Arts (ISLA) and the Graduate School at the University of Notre Dame. Data from Morefield were also collected during the Mesa Verde Community Center Survey supported by VEP NSF Grant DEB-0816400, an REU Supplement (1132226), a National Geographic Society CRE Grant (9100-12), and ISLA at the University of Notre Dame.
Conflict of interest
The authors declare no conflicts of interest.
Open Research
Data availability statement
The data that support the findings of this study are openly available in Acute-Climate-Stress at https://github.com/sfield2/Acute-Climate-Stress.
References
- 1 The use of the term ‘drought’, which is widely defined as periods when aridity resulted in insufficient water access, requires more discussion in climate archaeology because use of the term assumes that aridity had a negative impact on people despite that not always being the case (Ingram 2015). Therefore, the term ‘dry period’ may be a more accurate term to use when discussing periods of greater than normal aridity (Ingram 2015). However, for this study we continue to use the term drought because it is very probable that decreased precipitation significantly impacted people's ability to grow food in the CMV and because the term is synonymous among southwestern archaeologists for periods of increased aridity.
- 2 The original Paleocar model (Bocinsky and Kohler 2014) was updated so that it conducts model selection by minimizing the corrected Akaike's Information Criterion (Bocinsky et al. 2016, see also Bocinsky 2023). This updated version was then modified by Reese (2020) to automate some of the procedures for a Mesa Verde-focused study. Other than the automation, Reese's (2020) version has no significant difference from the Paleocar models developed by Bocinsky and colleagues. However, Reese's (2020) version was slightly altered for this study to no longer depend on the upcoming deprecation of certain R packages (e.g. the ‘sp’ package).
- 3 Duwe et al. (2016) developed the Pueblo Decomposition Model (PDM) for ancestral Tewa Pueblo villages in northern New Mexico. However, excavation data from certain residential sites at FVC show that when applied to the CMV data, the original decomposition model overestimated room numbers by 35%. Therefore, the PDM was downscaled by 35% to better estimate room size and population in CMV communities.


